王鹏涛 , 李英杰
, 李英杰
WANG Pengtao, LI Yingjie
通讯作者:
收稿日期: 2017-06-24
修回日期: 2017-09-6
网络出版日期: 2017-11-20
版权声明: 2017 《地理学报》编辑部 本文是开放获取期刊文献,在以下情况下可以自由使用:学术研究、学术交流、科研教学等,但不允许用于商业目的.
基金资助:
作者简介:
作者简介:王鹏涛(1988-), 男, 陕西渭南人, 博士, 主要从事气候变化与生态系统服务相互关系研究。E-mail: wnpengtao@126.com
展开
摘要
多种生态系统服务之间的相互关系研究是生态系统服务研究的热点问题。目前,有关多种生态系统服务权衡与协同的研究多停留在定性描述阶段,缺乏具备空间位置信息的定量研究。综合土地利用、NDVI、土壤类型、气象等多源数据,对汉江上游流域2000-2013年的土壤保持服务、产水服务、植被碳固定(NPP)服务进行空间制图,并基于逐像元偏相关的时空统计制图方法,对三种生态系统服务之间的权衡与协同关系时空变化进行分析。结果表明:① 2000-2013年,汉江上游多年平均土壤保持量为434.20 t·hm-2·yr-1,且多年来以16.10 t·hm-2·yr-1速率递增。多年平均产水量为250.34 mm,多年递增速率为3.79 mm·yr-1。NPP多年平均值为854.11 gC·m-2·yr-1,多年递减速率为8.54 gC·m-2·yr-1。② 汉江上游土壤保持量在空间上呈现出“南北山地高,河谷盆地低”的分布格局;植被NPP在空间上表现为汉江河谷地带低,其余地方高的态势;产水服务在空间上呈现由北向南递增的分布规律。③ 整个汉江上游流域土壤保持与NPP、土壤保持与产水服务均以权衡关系为主,权衡关系区域的面积占比分别达到62.77%和71.60%;NPP与产水服务以协同关系为主,协同关系的面积占比达到62.89%。④ 林地、湿地、耕地、人工表面及裸地中,土壤保持与NPP服务、土壤保持与产水服务在空间上以权衡关系为主,产水与NPP服务在空间上以协同关系为主;而草地表现为三种服务两两之间均以权衡关系为主。定量评估生态系统服务相互关系的时空特征,有利于研究生态系统服务之间相互关系在时间上的非线性变化以及空间上的分布异质性,对区域土地管理与生态系统服务优化具有重要的指导意义。
关键词:
Abstract
The research on the interactions among multiple ecosystem services (ES) is a hotspot. Most of the previous studies focused on the qualitative description of ES interactions, however, there have been relatively few studies on spatially explicit and quantitative assessment of ES interactions. In this paper, we mapped the ecosystem service of soil conservation (SC), net primary production (NPP) and water yield (WY) in the upper reaches of Hanjiang River Basin (URHR) based on the land use and land cover (LULC), NDVI, soil properties and observed climate data covering 2000-2013. Moreover, we quantitatively assessed the variation characteristics of interactions among different ES with a spatio-temporal statistical framework by applying the partial correlation analysis at a pixel scale. The results are shown as follows: (1) From 2000 to 2013, the mean annual SC was 434.20 t·hm-2·yr-1, and the mean annual WY was 250.34 mm. They also presented a rising tendency at the rate of 16.10 t·hm-2·yr-1 and 3.79 mm·yr-1, respectively. However, the mean annual NPP was 854.11 gC·m-2·yr-1, and presented a decreasing tendency at the rate of 8.54 gC·m-2·yr-1. (2) Spatially, SC was high in the North-South mountain area, while it was low in the Middle valley region. Similarly, the NPP in the Middle valley region was lower than that of other regions. However, the WY increased from north to south. (3) The three pairwise ES presented different interactions. Both the interaction between SC and NPP and that between SC and WY presented as trade-off, accounting for 62.77% and 71.60% of the total area, respectively. On the contrary, the interaction between NPP and WY was prone to synergies, accounting for 62.89% of the total area. (4) Pairwise ES in different land cover types also presented a different interaction. As for woodland, wetland, cropland, artificial land and bare land, SC and NPP, as well as SC and WY both presented trade-off, while WY and NPP presented synergy. Specially, in grassland, all the three pairwise ES presented a trade-off relationship. Therefore, spatially explicit and quantitative assessment of ES interactions are more helpful for revealing the temporal non-linear evolution, and the spatial heterogeneity of ES interactions. This analysis framework also contributes to the regional sustainable land management and the optimization of multiple ES conservation.
Keywords:
生态系统服务(Ecosystem service, ES),是指生态系统为人类提供的各种福祉[1],通常分为供给服务、支持服务、调节服务及文化服务等类型[2-3]。不同的生态系统服务,在动态变化过程中存在着复杂的相互关系,表现为相互增益的协同关系和此消彼长的权衡关系[4-5]。厘清生态系统服务之间权衡和协同关系的时空变化特征,对促进区域多种生态系统服务总体效益最优、实现区域经济发展与生态环境保护的“双赢”具有重要意义[6-7]。
近年来,全球及区域尺度生态系统服务的权衡与协同关系,成为生态系统服务研究的重要议题[8-9]。综合来看,其研究方法可分为统计描述法、空间统计制图法、情景分析法、模型模拟法等4种类型[10-11]。
① 统计描述法:强调采用区域汇总数据、分区平均数据或离散样点数据等非空间化数据,借助数理统计方法分析生态系统服务之间相互关系[10, 12-13]。另外,研究中常见的雷达图、花瓣图、塔图等这些缺乏空间信息的方法,也可归属于统计描述法[1]。如Tian等[14]利用斯皮尔曼等级相关统计法研究西南喀斯特地貌流域生态系统服务权衡与协同关系,并利用玫瑰图对生态系统服务相互关系进行表征,结果表明该区域产水服务与产沙量为协同关系,NPP分别与产水服务和产沙量为权衡关系。Hou等[9]以延安宝塔区为例,利用斯皮尔曼秩相关统计法,对生态系统服务的相互关系进行了像元尺度及乡镇尺度的散点图表征,但对于其空间具体位置的表述存在空白,仍属于统计描述法的范围。Yang等[15]利用玫瑰图以及生产可能性边界方法,研究关中—天水经济区全区尺度上的净植被生产力(NPP)、土壤侵蚀与保水三种服务的相互关系,结果显示NPP与保水服务为协同关系,NPP与土壤侵蚀、土壤侵蚀与保水服务则呈现权衡关系。
② 空间统计制图:强调利用空间地图数据及ArcGIS等软件平台,借助统计学方法、地图代数等定量方法以及空间数据叠加、图形比较等方法,在像元尺度对生态系统服务的相互关系进行制图与评估[5, 16]。如Gonzalez-Redin等将贝叶斯网络模型与ArcGIS平台融合,开发基于像元尺度的分析工具bayesGIS,对阿尔卑斯山区韦科尔自然公园内生物多样性保护与林地潜在生产力的关系进行评价,研究表明在利益相关者参与程度较高的地区,生态系统服务的权衡关系普遍存在[17]。Haase等在德国城市化地区采用空间制图的方法,通过计算两个时间段生态系统服务的变化,对5种生态系统服务的相互关系进行集成研究,认为土地利用的变化导致生物多样性和气候调节功能主要表现为协同作用,而气候调节和娱乐功能以权衡作用为主[18]。
③ 模型模拟法:通过环境模型及社会模型,对生态系统服务进行量化、空间制图及可视化,并对生态系统服务相互关系进行分析及结果输出,使利益相关者通过目标优化等方法,获得生态系统服务管理的最优策略[1, 5]。在应用中,生态系统服务模型具有操作界面简单、数据批量处理及快速制图等优点,但是模型对数据质量要求较高,在生态系统机理模拟、结果验证等方面存在较多问题,对于生态系统服务管理与情景模拟过于简化,且对于人类活动影响下的文化服务仍没有较好的定量方法,很难大范围推广使用[3, 10, 19]。较为典型的工作是Nelson等[20]以美国俄勒冈流域为研究案例区,基于当地决策行为,利用InVEST模型设置3种土地利用/覆被变化情景,研究发现生态系统服务的供给水平与生态系统多样性存在权衡关系。Thompson等[21]在美国马萨诸塞州利用空间直观景观模型LANDIS-II,对2010-2060年4种土地利用情景进行模拟,并利用雷达图对生态系统服务间的权衡关系进行表征,研究表明人类活动的增加可能会导致生态系统服务供给的减小。
④ 情景分析法:通过设定一定时段(历史、现阶段或者未来)社会经济情况的发展状况及生态保护目标,模拟相应的土地利用情景作为背景变量,评估生态系统服务的自身变化以及相互之间的关系变化[22]。情景方法是生态系统服务相互关系研究的常用方法,通常也与模型模拟法、空间统计制图等结合使用。如Mina等[23]结合斯皮尔曼秩相关统计法与未来情景预估,对未来时期欧洲尺度高山林地生态系统服务间的权衡与协同关系进行了评估,认为在气候变化背景下,未来欧洲高山林地生态系统服务间主要以协同关系为主。
综上所述,生态系统服务权衡研究仍以统计分析与空间制图两种方法为主[1],而情景模拟及模型分析等方法的理论深化与应用、验证等工作仍需进一步加强。统计描述方法虽然对服务之间的关系机理有很好的揭示,对区域管理决策时目标服务类型筛选有重要作用,但是该方法描述性较强,难以定量地、空间位置明晰地揭示服务的相互关系,限制了其在区域空间规划方面的应用。空间制图可以弥补传统统计描述法的不足,但是目前这种方法大多只考虑前后两个年份生态系统服务的空间叠加权衡关系,稳定可靠性较差,很有可能对生态系统服务间的关系造成误判[24],亟需进行区域长时间序列连续时间段服务相互关系的研究。因此,本文拟采用时间序列连续的数据,首先分析土壤保持、产水、NPP三种生态系统服务的时空变化规律,然后利用偏相关方法,基于像元尺度计算三种生态系统服务的偏相关系数,厘清其权衡与协同关系的时间演变规律,并进行空间明晰的定量制图,最后对不同土地利用类型的生态系统权衡与协同关系进行探讨,以期为流域生态系统服务管理优化提供理论支持。
汉江是长江最大支流,发源于汉中盆地西部宁强县潘冢山,流经陕西、湖北两省,于武汉市汇入长江。汉江上游地区(Upper Reaches of Hanjiang River Basin, URHR),全长652 km,地理位置介于31.02°~34.48° N,105.85°~111.6° E,流域面积6.2万km2,占整个汉江流域面积的39.18%。
汉江流域上游地处北亚热带季风气候区,多年平均降水量653~1183 mm,年均气温12~18 ℃,植被以常绿—落叶阔叶林为主,植被覆盖率较高。汉江上游水系发达,河网密布,根据区域地貌及水文条件[25],可将汉江上游划分为12个子流域(图1),本文中利用简称对每个流域进行标识:漾河流域(YR)、褒河流域(BR)、湑河流域(XR)、子午河流域(ZR)、旬河流域(XUR)、金钱河流域(JR)、丹江流域(DR)、冷水河流域(LSR)、双马河流域(SR)、竹河流域(ZR)、月河流域(YR)、岚河流域(LR)。
图1 研究区位置与气象站点分布
Fig. 1 Locations, meteorological stations and geographical zones of URHR
汉江上游紧依中国南北分界线南界(秦岭—淮河线)[26],是南水北调中线工程的水源地,也是中国中部生态环境保护的重要屏障。然而,汉江在陕西境内由西向东穿行于北部的秦岭山地与南部米仓山、大巴山之间,地形起伏大,峡谷盆地交错分布,加之降水主要集中在夏季,因此暴雨、洪涝灾害频发[27]。当地人口增加、工业和旅游开发等人类活动的持续干扰,使得汉江上游地区的生物多样性持续降低、山地灾害频发和水源地水质持续退化,人地关系矛盾更加突出,严重影响经济社会的和谐发展。
本文中所使用的基础数据包括以下5类:
① 气象观测数据,选取2000-2013年汉江上游地区及周边区域24个气象站点的日降水量、平均气温及日照时数等气象数据,来源网址为中国气象数据网 http://data.cma.cn/。
② 土地利用数据,共2000年、2005年、2010年和2013年四期。来源于Global Land Cover Facility全球土地覆盖研究机构,来源网址为:http://www.landcover.org/data/。利用ENVI 5.2软件,对Landsat 5 TM数据进行人工解译,最终解译精度>94%,可以满足生态系统服务模拟与制图需求[28]。本文将土地利用类型分为草地,湿地,耕地,人工表面,裸地,林地6大地类[29]。
③ DEM高程数据,采用ASTER Global Digital Elevation Model(ASTER GDEM)数据,空间分辨率90 m,来源网址为http://gdem.ersdac.jspacesystems.or.jp/。
④ NDVI数据,采用2000-2013年MODIS NDVI数据,分辨率为250 m,来源网址为:http://ladsweb.nascom.nasa.gov/data/。
⑤土壤数据,采用基于世界土壤数据库(HWSD)的中国土壤数据集(v1.1),分辨率为1 km,来源网址为:http://westdc.westgis.ac.cn。
本文利用修正通用土壤流失方程(RUSLE)、流域产水模型、CASA模型等常用方法,定量评估汉江上游生态系统的土壤保持服务、产水服务与植被净初级生产力的时空变化特征,在此基础上引入基于偏相关系数的权衡与协同关系的时空统计制图方法,对该地区生态系统服务两两之间的相关关系进行定量评估。具体的计算过程如下:
2.3.1 土壤保持服务 生态系统土壤保持服务常用土壤保持量(Soil conservation, SC)进行评估。本文采用修正通用土壤流失方程(RUSLE)[30]估算汉江上游生态系统土壤保持量。计算公式如下:
式中:SC为土壤保持量(t·hm-2·yr-1),由潜在侵蚀(Ap)与实际土壤侵蚀(Ar)之差决定。潜在土壤侵蚀量指在区域无植被覆盖、不采取任何水保措施下的土壤侵蚀量(t·hm-2·yr-1)。实际土壤侵蚀则指考虑区域植被覆盖及水土保持条件的土壤侵蚀量(t·hm-2·yr-1)。式中各参数计算方法如下:
(1)R:代表降雨侵蚀力因子(MJ·mm·hm-2·h-1·yr-1),由Wischmeier经验公式求得[31],Pi和Pa分别代表月降水量和年降水量(mm):
(2)K:代表土壤可蚀性因子(t·ha·h·ha-1·MJ-1·mm-1),用以评价土壤被降水冲蚀和搬运的脆弱性,由Sharpley等发展的EPIC模型求得[32]:
式中:Sa、Si、Cl和C分别代表砂粒、粉粒、粘粒与有机质在土壤中的质量百分数。
(3)L为坡长因子,S为坡度因子,坡长坡度因子用以反映地貌特征对土壤侵蚀的影响,计算公式如下[33]:
式中:λ为坡长(m);m为坡长坡度指数;θ为坡度。
(4)C为植被覆盖因子,f为植被覆盖度,利用NDVI数据求得[34]:
(5)P是水土保持因子,由坡度斜率指数α求得[35-36]:
2.3.2 产水服务 流域生态系统产水服务(Water Yield, WY),一般采用区域水量平衡法进行评价,利用区域水分的输入量降水与输出量蒸散发的差值,得到区域生态系统的产水量[37]。该方法在全球不同气候类型的流域内进行了校正[38],成为产水量长时段评估的有效工具,计算公式如下[33, 39-40]:
式中:WY为流域产水量(mm);PPT为年降水量(mm);ΔS为流域土壤含水量的变化(mm),在长时间变化尺度可以忽略不计,因此流域长时间尺度的产水量主要由降水量及实际蒸散量决定[37]。PET代表年潜在蒸散量(mm),可采用Hamon潜在蒸散法求得[41];ET为实际蒸散量(mm),植被蒸散量由经验式(9)求得[42],流域水体蒸散量由降水与潜在蒸散量的最小值求得[33]。式(9)中植被可利用水系数(w)代表植被在蒸腾过程中利用土壤水分的能力,根据前人校正结果,将覆盖率> 30%的林地w设置为2.0,覆盖率< 30%的林地w设置为1.0,草地及耕地为0.5,人工用地及裸地为0.1[33, 39, 43-44]。
2.3.3 植被净初级生产力 植被净初级生产力(Net primary production, NPP),指植被在单位时间、单位面积累积的有机物数量,即绿色植物光合作用后产生的有机物质总量减去自身呼吸消耗后的实际积累量。Potter等建立的Carnegie Ames-Stanford Approach(CASA)模型,基于光能利用率原理,实现了对全球陆地植被净初级生产力的有效估算[45]。该方法可以方便的利用遥感数据与方法,因此得到广泛应用[46]。其估算方法如下:
式中:x代表栅格数据中的具体像元;t代表时间,
2.3.4 权衡与协同关系的时空统计制图方法 基于逐像元偏相关的时空统计制图方法定量评估生态系统服务间的相互关系:一方面可研究生态系统服务连续的时间演变规律,另一方面可对生态系统服务相互关系进行空间明晰的定量制图。从时间变化来看,生态系统服务表现出连续的时间演变的规律,若仅有两个时间点或者某几个时间段内数据,无法衡量生态系统对于外部突发状况的响应和时滞效应,会造成对生态系统时间变化的误判[24];从空间分布来看,空间制图需要结合空间化了的遥感数据、气象数据、社会统计数据等,提供空间明确的生态系统服务空间变化特征,可促进生态保护决策的实施[48]。
生态系统服务具有复杂性和多样性,一个生态系统服务的变化不仅受到另一个生态系统服务的影响,还受到气候要素及土地利用变化的共同影响。因此,需要消除其他因素的影响,然后分析生态系统服务两两之间关系,这种统计方法称为偏相关分析。我们考虑到年降水量、NDVI对土壤保持、产水、NPP变化有影响,对其进行偏相关分析,即保持年降水量、NDVI不变,求3种生态系统服务两两之间的偏相关系数[6]。具体计算步骤如下[49]:
(1)在MATLAB软件平台中,基于像元尺度计算相应的相关系数与偏相关系数。
第一步,计算简单相关系数:
第二步,计算一级偏相关系数:
第二步,计算二级偏相关系数:
式中:ES1与ES2分别代表两种生态系统服务;r为ES1与ES2之间的相关系数;i、j分别代表栅格数据中具体像元的行号和列号;n为栅格数据的时间序列。
(2)统计ES1与ES2的偏相关系数:若相关系数为正,表明生态系统服务之间为协同关系;相关系数为负,说明生态系统服务之间存在权衡关系;相关系数为零,则表明生态系统服务之间无相关关系。
(3)利用t检验方法,判断生态系统服务之间相互关系的显著性,划分权衡与协同系数的显著性等级如下:显著协同(r>0,0.01<P<0.05),文中用“协同**”表示;较显著协同(r>0,0.05<P<0.1),文中用“协同*”表示;弱协同(r>0,0.1<P),文中用“协同”表示;微弱权衡(r<0,0.01<P<0.05),文中用“权衡”表示;较显著权衡(r<0,0.05<P<0.1),文中用“权衡*”表示;显著权衡(r<0,0.1<P),文中用“权衡**”表示。
在2000-2013年,汉江上游地区土壤保持服务及产水服务均呈上升趋势,而NPP则呈下降趋势(图2)。具体而言,土壤保持量多年平均值为434.20 t·hm-2·yr-1,最低值在2001年(239.45 t·hm-2·yr-1),最高值在2010年(739.42 t·hm-2·yr-1),多年来以16.10 t·hm-2·yr-1速率递增。从年际变化来看,2000-2006年,土壤保持量增加较为缓慢,且呈明显的波动状态,2007-2013年土壤保持量年际间剧烈变化,分别于2007年、2010年达到峰值,其余年份土壤保持量则相对较低。产水量多年平均值为250.34 mm,最低值在2001年(140.16 mm),最高值在2011年(431.96 mm),多年递增速率为3.79 mm·yr-1。年际间,2000-2006年产水量呈现波动上升趋势,2007-2013年,产水量的年际变化则存在一个明显的峰值(2011年),之后产水量迅速下降。NPP多年平均值为854.11 gC·m-2·yr-1,最低值在2012年(730.84 gC·m-2·yr-1),最高值在2005年(918.30 gC·m-2·yr-1),多年递减速率为8.54 gC·m-2·yr-1。2004年以前,NPP呈现波动变化趋势,2004年之后NPP基本呈现持续下降趋势,并在2012年达到NPP谷值。
图2 2000-2013年汉江流域上游生态系统服务的时间变化趋势
Fig. 2 The temporal changes of three ES in URHR from 2000 to 2013
分析生态系统服务在时间变化上的关系,土壤保持量与产水量在2003-2007年呈现明显的协同变化规律,土壤保持量与NPP在2005-2012年大致呈现权衡变化关系,产水量与NPP在2005-2013年大致呈现协同关系,其余时段生态系统之间的相互关系则不明显。
土壤保持量在空间上呈现出“南北山地高,河谷盆地低”的分布态势(图3)。汉江河谷两侧的秦岭山地与大巴山区土壤保持量较高,包括双马河、竹河、岚河等流域南部以及子午河、湑河、月河流域北部,土壤保持量普遍高于770 t·hm-2·yr-1。低值区集中分布于汉江河谷西部与丹江、金钱河流域,土壤保持量普遍低于200 t·hm-2·yr-1。多年来,全区大部土壤保持量呈现上升趋势,仅岚河流域东部土壤保持量呈微弱下降趋势。汉江河谷地区及丹江流域东部,土壤保持量增加趋势较为缓慢,递增速率普遍低于10 t·hm-2·yr-1,增加最快的区域分布在漾河西部、褒河中部及湑河北部,递增速率普遍高于40 t·hm-2·yr-1。
图3 2000-2013年汉江流域上游生态系统服务的时间变化趋势
Fig. 3 Spatial patterns of the three ES mean values and change trend in the URHR from 2000 to 2013
汉江上游植被NPP空间差异较大(图3)。NPP低值区集中分布在汉江河谷湑河南部、月河中部、旬河南部等流域以及丹江北部河谷地区,NPP均低于700 gC·m-2·yr-1;高值区位于子午河、旬河、月河流域交接区、双马河流域南部及岚河流域中部,其NPP均高于900 gC·m-2·yr-1。NPP的变化趋势大致与平均值的空间分布格局呈现相反态势。NPP增加较快地区主要分布在汉江河谷东段及金钱江流域,其NPP的递增速率普遍高于10 gC·m-2·yr-1;漾河、褒河、湑河、子午河等流域北部及冷水河、双马河流域南部为NPP下降区域,汉中盆地、米仓山地区等NPP递减速率最大,为20 gC·m-2·yr-1。
产水量在空间上呈现由北向南递增的分布规律:北部的旬河、金钱河及丹江等流域产水量最少,产水量在121~178 mm之间,北部的褒河、湑河、子午河等流域产水量在200~280 mm之间,处于汉江流域上游的中等水平;南部地区产水量最高,特别是双马河、竹河等流域南部,产水量可达400 mm以上。产水量的多年变化趋势呈现“东高西低”的分布格局,大致以岚河、金钱河等流域及旬河流域东部为界,界线以西为多年产水量增加区,界线以东为多年产水量减少区。其中,漾河流域北部及冷水河流域产水量的递增率最高,这些地区递增速率普遍高于15 mm·yr-1,而东部岚河流域递减率最大,为5 mm·yr-1。
基于像元尺度,对汉江上游地区生态系统间的关系进行空间制图:土壤保持量与NPP的空间关系(图4a,SC&NPP)、土壤保持量与产水(图4b,SC&WY)、产水量与NPP(图4c,WY&NPP)。
图4 2000-2013年汉江流域上游生态系统服务权衡与协同关系的空间格局
Fig. 4 The spatial patterns of pairwise ES interactions in URHR from 2000 to 2013
土壤保持量与NPP的相互关系,在空间上权衡关系的像元个数占比为62.77%,表明全区土壤保持量与NPP呈现权衡关系,但是这种相互关系呈现显著的南北差异。汉江上游北部地区土壤保持量与NPP的相互关系以协同关系为主,秦岭山地北缘为两者显著协同区;汉江上游南部地区两者的相互关系则以权衡为主,显著权衡区主要位于米仓山地区。
土壤保持量与产水的相互关系,在空间上权衡的像元个数占比71.60%,表明权衡的分布范围更为广泛。两者的关系在空间分布上表现为东西差异,汉江上游东部地区两者的关系主要以权衡关系为主,显著权衡区分布在岚河流域西部;汉江上游西部地区两者的关系则主要以协同关系为主。
NPP与产水的相互关系以协同为主,协同的像元个数占比62.89%。权衡的区域仅分布在金钱河、岚河等流域东部及丹江流域,并零星分布于漾河流域北部、褒河流域南部,显著权衡区域分布在丹江流域东部、金钱河流域东南部。其余地区均以协同关系为主,显著协同区零星分布于旬河、子午河、湑河及双马河等流域。
利用ArcGIS空间分析工具,统计汉江上游各子流域生态系统服务权衡与协同关系分布特征(图5),可以看出:① 在流域西部,包括褒河、湑河、子午河、双马河流域,土壤保持与NPP、土壤保持与产水量、NPP与产水量均以协同关系为主。② 在丹江流域,土壤保持与NPP、土壤保持与产水量、NPP与产水量均以权衡关系为主。③ 在旬河与金钱河流域,土壤保持与NPP 、NPP与产水量均以协同为主、土壤保持与产水量以权衡为主。④ 在南部地区,包括漾河、冷水河、竹河、月河、岚河流域,土壤保持与NPP、土壤保持与产水量以权衡关系为主,NPP与产水量以协同关系为主。
图5 2000-2013年汉江流域上游生态系统服务权衡与协同关系的分区统计
Fig. 5 The area proportion of pairwise ES interactions in each sub-basin from 2000 to 2013
通过统计分析不同土地利用类型的生态系统服务间的关系(图6)特征发现,不同土地利用类型间,土壤保持量与NPP的相互关系以权衡为主,土地类型中林地、湿地、耕地、人工表面、草地的生态系统权衡关系占比均在50%以上,而裸地生态系统权衡关系也接近于50%。不同土地利用类型间,土壤保持量与产水量的相互关系也以权衡关系为主,各土地类型,权衡的占比均在60%以上,而人工表面生态系统权衡关系占比高于50%。在不同土地利用类型中,NPP与产水的相互关系则主要以协同关系为主,各土地利用类型协同关系的占比均高于52%,仅草地生态系统协同关系接近50%。
图6 2000-2013年汉江流域上游不同土地类型生态系统服务权衡与协同关系统计
Fig. 6 The area proportion of pairwise ES interactions in each LULC type from 2000 to 2013
综上可以看出,不同土地类型中,林地、湿地、耕地、人工表面及裸地,土壤保持与NPP服务、土壤保持与产水服务在空间上以权衡关系为主,产水与NPP服务以协同关系为主的分布格局。仅草地表现为3种服务两两之间均以权衡关系为主。
本文利用2000-2013年数据,分析了汉江流域上游地区土壤保持服务、NPP与产水服务的时空变化特征,对生态系统服务相互关系在时间和空间上的变化特征进行了定量评价,并探讨了土地利用类型对生态系统服务权衡与协同关系的影响,得到基本结论如下:
(1)在2000-2013年,汉江上游地区土壤保持服务及产水服务均呈上升趋势,而NPP则呈下降趋势,其中土壤保持量与产水量在2003-2007年呈现明显的协同变化规律,土壤保持量与NPP在2005-2012年大致呈现权衡变化关系,产水量与NPP在2005-2013年大致呈现协同关系。
(2)汉江上游土壤保持量在空间上基本呈现出“南北山地高,河谷盆地低”的分布态势,且多年来全区大部土壤保持量呈现上升趋势。植被NPP空间差异较大,其中低值区集中分布于汉江河谷地带以及丹江北部河谷区,高值区位于子午河、旬河、月河流域的交接区、双马河流域南部及岚河流域中部,空间上土壤保持量的变化趋势大致与平均值的分布格局呈现相反态势。产水量在空间上呈现明显的由北向南递增的分布规律,而产水量的多年变化趋势则呈现东高西低的分布格局。
(3)在全区尺度,土壤保持量与NPP、土壤保持量与产水呈现权衡关系,NPP与产水呈现协同关系。从空间来看,土壤保持量与NPP表现为“南部权衡—北部协同”的空间格局,土壤保持量与产水表现为“东部权衡—西部协同”的相互关系,NPP与产水表现为“全区大部协同—东部局部权衡”的分布态势。
(4)不同土地类型中,土壤保持与NPP服务、土壤保持与产水服务在空间上以权衡关系为主,产水与NPP服务在空间上以协同关系为主,仅草地表现为3种服务两两之间均以权衡关系为主。
明晰生态系统服务权衡与协同关系的时间、空间尺度,对于生态环境管理、社会经济良性发展具有重要的理论及应用价值[50]。基于逐像元偏相关空间制图框架,本文分析了三种生态系统服务的相互关系在时间和空间上的变化特征。
(1)偏相关系数方法有效集成了时间的动态过程分析。从时间变化上看,汉江上游地区土壤保持服务及产水服务呈上升趋势,NPP呈下降趋势,且在一定的时段内三者在时间变化上存在大致的权衡或者协同关系。Renard等[51]在加拿大魁北克地区生态系统以及Wu等[52]在青藏高原高山生态系统研究时均认为,生态系统服务之间的相互关系随着时间变化存在着一定的演变规律,并表现出一定的阶段性与差异性。首先,一些外界的突发因素,可能会对生态系统造成较大的影响,如某一时段突然发生的环境变化。其次,生态系统的组成具有复杂性,生态系统服务的相互关系,并不是简单的线性关系,存在6种简化形式[53]。Hao等[54]进一步研究表明,分析成对生态系统的非线性变化时,需考虑一个生态系统服务对于另一个生态系统服务的约束阈值效应。在外界扰动的合理范围(约束阈值范围)内,生态系统服务对于社会系统、生态系统内扰动的响应并不敏感,存在明显的阈值效应和滞后效应;而当外界扰动强度超过生态系统的约束阈值后,作为响应的生态系统服务则会受到约束条件的影响从而发生剧烈变化,此时滞后效应几乎消失,导致生态系统相互关系发生转变。总之,生态系统服务之间的相互关系随着时间变化,可能会发生演变[51]。在目前阶段,理解生态系统服务权衡与协同的时间尺度效应,对我们而言仍然是一个重要的挑战[24]。如果仅静态研究两个时间点或者某几个时间段,就可能对生态系统的相互关系造成误判。考虑长时期观测数据的偏相关系数方法,可以有效的探查生态系统服务的随时间的动态演变特征,避免对于生态系统长时间演变过程中突发因素及时滞效应的误判[55]。
(2)借助遥感数据、土地利用以及水文模型的空间制图等,偏相关系数方法在空间上的应用,有效的解决了权衡关系的空间制图问题。结合时间的动态和空间的分布,可以更好地定量评估生态系统服务的相互关系。从空间上看,本文结果表明土壤保持量与NPP的相互关系以及土壤保持量与产水的相互关系,以权衡关系为主,NPP与产水的相互关系以协同为主,并且这种相互关系还存在着一定的空间差异(南北差异或者东西差异)。这种空间差异,可以利用约束阈值大致分析[54]。这里以土壤保持量与NPP的相互关系的南北差异为例。首先,NPP高的地区植被覆盖水平较高,因此对该地降水造成的土壤侵蚀起到抑制作用,这时土壤保持与NPP呈现协同关系。另一方面,一般而言NPP高的地方降水量充沛,降水量增大则相应的土壤侵蚀量增加,这时NPP又与土壤保持呈现权衡关系[54]。这在一定程度上可以解释,降水对NPP的阈值效应,可能是南部二者呈现权衡关系,北部二者以协同关系为主的原因。因此生态系统服务权衡随时空变化的差异,可能是由于不同的约束阈值影响造成的。
本文研究过程中,仍存在部分数据获取问题,如土地利用数据只有2000年、2005年、2010年和2013年四期数据,气象站点数量少且分布不均,这势必会影响相应的生态系统服务功能的评估[56]。第二,生态系统服务之间的权衡与协同关系,具有明显而又复杂的尺度效应[57]。对于生态系统服务过程尺度效应背后的生物与物理机理研究的欠缺,势必影响生态系统服务的驱动分析。基于时空演变方法的生态系统服务权衡分析框架,可以规避生态系统服务权衡时间演变过程中的阶段性与差异性,并能在空间分布上以像元尺度表征生态系统服务间的相互关系,但是基于统计方法的时空分析无法探求生态系统服务权衡过程中出现的具体阈值以及不同阶段的变化等问题。因此,在生态系统服务权衡研究中,进一步获得更加详实的高分辨率的统计数据,结合生态系统服务机理深入研究权衡与协同的演变的滞后与阈值效应,这可能是下一步工作的重要方面。
The authors have declared that no competing interests exist.
| [1] |
Trade-off analyses and synthetic integrated method of multiple ecosystem services. https://doi.org/10.18402/resci.2016.01.01 URL Magsci [本文引用: 4] 摘要
生态系统服务是人类从生态系统中所获得的各种的惠益,自20世纪90年代提出后在国际上迅速成为生态学、地理学和环境科学等领域的研究前沿热点。联合国大会于2012年正式批准生物多样性与生态系统服务政府间科学政策平台(IPBES)建设,制定概念框架,确定近期研究主要任务包括三项快速的评估和两项政策决策性的评估。本文探索了生态系统服务权衡及区域集成方法,并以黄土高原地区为例进行了应用。研究结果表明,土地利用变化与土壤保持、碳固定具有正效应,与产水量间存在负效应;粮食生产能力与农业生产条件改善、人工投入增加和技术进步密切相关。生态系统服务之间的消长和权衡具有尺度依赖性,植被恢复的区域适宜性评价及水分效应方面还需要进一步研究。
生态系统服务权衡与集成方法 .https://doi.org/10.18402/resci.2016.01.01 URL Magsci [本文引用: 4] 摘要
生态系统服务是人类从生态系统中所获得的各种的惠益,自20世纪90年代提出后在国际上迅速成为生态学、地理学和环境科学等领域的研究前沿热点。联合国大会于2012年正式批准生物多样性与生态系统服务政府间科学政策平台(IPBES)建设,制定概念框架,确定近期研究主要任务包括三项快速的评估和两项政策决策性的评估。本文探索了生态系统服务权衡及区域集成方法,并以黄土高原地区为例进行了应用。研究结果表明,土地利用变化与土壤保持、碳固定具有正效应,与产水量间存在负效应;粮食生产能力与农业生产条件改善、人工投入增加和技术进步密切相关。生态系统服务之间的消长和权衡具有尺度依赖性,植被恢复的区域适宜性评价及水分效应方面还需要进一步研究。
|
| [2] |
Mapping the hotspots and coldspots of ecosystem services in conservation priority setting. https://doi.org/10.1007/s11442-017-1400-x URL [本文引用: 1] |
| [3] |
Research progress on ecosystem service trade-offs: From cognition to decision-making. https://doi.org/10.11821/dlxb201706002 URL [本文引用: 2] 摘要
作为沟通自然生态系统与人类社会的重要桥梁,生态系统服务一直以来都是地理学、生态学等学科的研究前沿和热点。正确认知生态系统服务之间的关系,是开展多种生态系统服务可持续管理决策的前提,有助于人类福祉的全面提升。本文通过厘定生态系统服务权衡的概念内涵,梳理了生态系统服务权衡的空间、时间和可逆性特征,将多层次人类福祉的满足作为权衡的最终目标,视生态补偿为权衡决策的基本保障途径。生态系统服务权衡关系的识别依托于定量指标法和综合模型法,且权衡关系可能随时空尺度的推移发生改变;情景分析与多目标分析是生态系统服务权衡决策的有效手段。生态系统服务权衡多尺度关联、生态系统服务流与远程耦合、生态系统服务消费与生态补偿,成为当前生态系统服务权衡研究的重点方向。
生态系统服务权衡研究进展: 从认知到决策 .https://doi.org/10.11821/dlxb201706002 URL [本文引用: 2] 摘要
作为沟通自然生态系统与人类社会的重要桥梁,生态系统服务一直以来都是地理学、生态学等学科的研究前沿和热点。正确认知生态系统服务之间的关系,是开展多种生态系统服务可持续管理决策的前提,有助于人类福祉的全面提升。本文通过厘定生态系统服务权衡的概念内涵,梳理了生态系统服务权衡的空间、时间和可逆性特征,将多层次人类福祉的满足作为权衡的最终目标,视生态补偿为权衡决策的基本保障途径。生态系统服务权衡关系的识别依托于定量指标法和综合模型法,且权衡关系可能随时空尺度的推移发生改变;情景分析与多目标分析是生态系统服务权衡决策的有效手段。生态系统服务权衡多尺度关联、生态系统服务流与远程耦合、生态系统服务消费与生态补偿,成为当前生态系统服务权衡研究的重点方向。
|
| [4] |
Understanding relationships among multiple ecosystem services. https://doi.org/10.1111/j.1461-0248.2009.01387.x URL PMID: 19845725 [本文引用: 1] 摘要
Abstract Ecology Letters (2009) 12: 1394 1404 Abstract Ecosystem management that attempts to maximize the production of one ecosystem service often results in substantial declines in the provision of other ecosystem services. For this reason, recent studies have called for increased attention to development of a theoretical understanding behind the relationships among ecosystem services. Here, we review the literature on ecosystem services and propose a typology of relationships between ecosystem services based on the role of drivers and the interactions between services. We use this typology to develop three propositions to help drive ecological science towards a better understanding of the relationships among multiple ecosystem services. Research which aims to understand the relationships among multiple ecosystem services and the mechanisms behind these relationships will improve our ability to sustainably manage landscapes to provide multiple ecosystem services.
|
| [5] |
The tradeoffs and synergies of ecosystem services: Research progress, development trend, and themes of geography.
由于生态系统服务的多样性、空间分布的不均衡性以及人类使用的选择性,在人为活动和自然因素作用下,服务之间的关系出现了此消彼长的权衡、相互增益的协同等变化。理解服务权衡与协同的表现类型、形成机理、尺度依存和区域差异,对于制定区域发展与生态保护"双赢"的政策措施具有重要意义。从相互作用与联系、类型与形成机制、研究方法与工具、尺度效应以及不确定性等方面评述了生态系统服务权衡与协同的国内外研究进展和局限性,并对研究趋势进行了展望。在此基础上,提出从地理学视角研究生态系统服务权衡与协同的主要议题,包括服务供需的时空异质性、权衡与协同的形成机制、尺度依存和区域差异等。可为拓展生态系统服务权衡与协同研究的深度和广度,提升地理学综合研究水平提供借鉴与参考。
生态系统服务权衡与协同研究进展及地理学研究议题 .
由于生态系统服务的多样性、空间分布的不均衡性以及人类使用的选择性,在人为活动和自然因素作用下,服务之间的关系出现了此消彼长的权衡、相互增益的协同等变化。理解服务权衡与协同的表现类型、形成机理、尺度依存和区域差异,对于制定区域发展与生态保护"双赢"的政策措施具有重要意义。从相互作用与联系、类型与形成机制、研究方法与工具、尺度效应以及不确定性等方面评述了生态系统服务权衡与协同的国内外研究进展和局限性,并对研究趋势进行了展望。在此基础上,提出从地理学视角研究生态系统服务权衡与协同的主要议题,包括服务供需的时空异质性、权衡与协同的形成机制、尺度依存和区域差异等。可为拓展生态系统服务权衡与协同研究的深度和广度,提升地理学综合研究水平提供借鉴与参考。
|
| [6] |
Spatially explicit quantification of the interactions among ecosystem services. https://doi.org/10.1007/s10980-017-0527-6 URL [本文引用: 2] 摘要
Human demands for ecosystem services (ES) have tremendously changed the landscape and led to degradation of ecosystems and associated services. The resolving of current eco-environmental problems call
|
| [7] |
Research progress on trade-offs and synergies of ecosystem services:an overview. https://doi.org/10.5846/stxb201109161360 URL Magsci [本文引用: 1] 摘要
生态系统服务作为生态系统评估的核心领域,是生态学的研究热点。生态系统提供服务的形式与能力受人类活动强烈影响,反之,生态系统服务的变化又影响着人类相关决策的制定。不同生态系统服务之间很难甚至不可能同时达到利益最大化,即存在着不同程度此消彼长的竞争关系。此外,不同生态系统服务之间也可能形成相互促进或抑制的协同作用。探讨不同生态系统服务的相互关系(竞争与协同作用),有利于揭示不同尺度利益相关方与生态系统服务之间的作用与反馈机制,避免生态系统服务的重复估算;同时可为制定与实施生态补偿、提高人类福祉提供科学依据,优化生态系统服务管理。综合研究了近期国外生态系统服务竞争关系与协同作用的相关文献,在简述当前生态系统服务研究若干问题的基础上,以生态系统服务竞争与协同为视角,厘清了生态系统服务竞争与协同的基本内涵,总结了生态系统服务竞争与协同的主要类型,探讨了生态系统服务竞争与协同的空间与时间尺度效应;介绍并总结了生态系统服务竞争与协同两种主要研究方法(生态-经济综合模型方法、基于土地利用的情景分析法)的特点与适应范围。
生态系统服务竞争与协同研究进展 .https://doi.org/10.5846/stxb201109161360 URL Magsci [本文引用: 1] 摘要
生态系统服务作为生态系统评估的核心领域,是生态学的研究热点。生态系统提供服务的形式与能力受人类活动强烈影响,反之,生态系统服务的变化又影响着人类相关决策的制定。不同生态系统服务之间很难甚至不可能同时达到利益最大化,即存在着不同程度此消彼长的竞争关系。此外,不同生态系统服务之间也可能形成相互促进或抑制的协同作用。探讨不同生态系统服务的相互关系(竞争与协同作用),有利于揭示不同尺度利益相关方与生态系统服务之间的作用与反馈机制,避免生态系统服务的重复估算;同时可为制定与实施生态补偿、提高人类福祉提供科学依据,优化生态系统服务管理。综合研究了近期国外生态系统服务竞争关系与协同作用的相关文献,在简述当前生态系统服务研究若干问题的基础上,以生态系统服务竞争与协同为视角,厘清了生态系统服务竞争与协同的基本内涵,总结了生态系统服务竞争与协同的主要类型,探讨了生态系统服务竞争与协同的空间与时间尺度效应;介绍并总结了生态系统服务竞争与协同两种主要研究方法(生态-经济综合模型方法、基于土地利用的情景分析法)的特点与适应范围。
|
| [8] |
A quantitative review of relationships between ecosystem services. https://doi.org/10.1016/j.ecolind.2016.02.004 URL [本文引用: 1] 摘要
Ecosystems provide multiple ecosystem services (ES) to society. Ignoring the multi-functionality of land systems in natural resource management generates potential trade-offs with respect to the provisioning of ES. Understanding relationships between ES can therefore help to minimize undesired trade-offs and enhance synergies. The research on relationships between ES has recently gained increasing attention in the scientific community. However, a synthesis on existing knowledge and knowledge gaps is missing so far. We analyzed 67 case studies that studied 476 pairwise ES combinations. The relationships between these pairs of ES were classified into three categories: “trade-off”, “synergy” or “no-effect”. We tested three hypotheses: (1) a dominant relationship between ES exists for each ES pair; (2) this relationship is influenced by the scale at which the relationship had been studied as well as by the land system the analysis took place; and (3), this relationship is further affected by the method applied to characterize the relationship. For the first hypothesis, we demonstrated a comprehensive matrix of pairs of ES. Most pairs of ES (74%) had a clear association with one category: the majority of case studies reported similar relationships for pairs of ES. A synergistic relationship was dominant between different regulating services and between different cultural services, whereas the relationship between regulating and provisioning services was trade-off dominated. Increases in cultural services did not influence provisioning services (“no-effect”). For the second hypothesis, our analysis showed that the overall pattern of ES relationships did not change significantly with scale and land system archetypes except for some ES pairs. The regional scale was the most commonly considered, and case studies were biased among different land system archetypes, which might affect our ability to find the effect of scale or land system archetypes on the pattern of relationships. The analysis for the third hypothesis showed that the choice of methods used to determine the relationship had an effect on the direction of the relationship: studies that employed correlation coefficients showed an increased probability to identify no-effect relationships, whereas descriptive methods had a higher probability of identifying trade-offs. Our results provide helpful information of which services to include in ES assessments for the scientific community as well as for practitioners. Furthermore, they allow a first check if critical trade-offs and synergies have been considered in an analysis.
|
| [9] |
Temporal variation and spatial scale dependency of ecosystem service interactions: a case study on the central Loess Plateau of China. https://doi.org/10.1007/s10980-017-0497-8 URL [本文引用: 2] 摘要
An important feature of ecosystem service interaction is that it changes over time and across spatial scales. This research aims to find which ecosystem service interactions temporally vary and depend
|
| [10] |
Methods, tools and research framework of ecosystem service trade-offs. 生态系统服务权衡:方法、模型与研究框架 . |
| [11] |
Quantifying ecosystem service trade-offs.//International Environmental Modelling and Software Society (iEMSs) 2010 International Congress on Environmental Modelling and Software Modelling for Environment's Sake. Ottawa, |
| [12] |
The tradeoff and synergy between ecosystem services in the Grain-for-Green areas in Northern Shaanxi, China. https://doi.org/10.1016/j.ecolind.2014.02.028 URL [本文引用: 1] 摘要
As an important part of the strategy of Western development, the Grain-for-Green Program (GFGP) was initiated to protect the environment and mitigate disasters. Ecosystem services and their dynamics are considered emerging features of ecological quality and the change in direction by many scholars and practitioners. Extending from ecosystem services (ESs) modeling, we propose a simple and feasible framework for quantitatively assessing the benefits and equilibrium of the consequences of the GFGP. Our starting evaluation shows that ESs has changed dramatically in the GFGP area. By fitting pair-wise ESs spatial concordances at the grid-cell level, we have revealed the tradeoffs between provisioning and regulating services and the synergies between the regulating services. The analysis of the variability of the relationship between ESs on different land cover types clearly identifies the vegetation that has produced exceptionally strong ESs. Our findings suggest that quantifying the interactions between ESs may improve the ecosystem-based management practices and support policy-making to address the challenges of the sustainable use of natural resources. The framework designed for regional-scale analysis can help in clearly understanding the interrelations of ESs and make natural resources related decisions more effective and efficient, although this framework still needs to move beyond these fundamental and illustrative analyses to more fully explain the synergies and tradeoffs.
|
| [13] |
Trade-off analyses of multiple ecosystem services by plantations along a precipitation gradient across Loess Plateau landscapes. https://doi.org/10.1007/s10980-014-0101-4 URL [本文引用: 1] 摘要
Trade-off is defined as a situation where one ecosystem service (ES) increases while another decreases. In a broader sense, trade-off also refers to unidirectional changes with uneven paces or rates i
|
| [14] |
Trade-offs among ecosystem services in a typical karst watershed, SW China .https://doi.org/10.1016/j.scitotenv.2016.05.190 URL PMID: 27265738 [本文引用: 1] 摘要
61We developed an integrated model to quantify ecosystem services by coupling CASA and SWAT.61Cultivated field shrinkage, pasture and forest land expansion were observed during 2000–2010.61The sediment and water yields exhibited a decreasing trend, whereas NPP was reversely varied.61We assessed the synergies and trade-offs relationships among ecosystem services.61The area of afforestation should be based on runoff and soil erosion instead of pursuing the forest coverage rate blindly.
|
| [15] |
Trade-offs between carbon sequestration, soil retention and water yield in the Guanzhong-Tianshui Economic Region of China. https://doi.org/10.1007/s11442-016-1337-5 URL [本文引用: 1] 摘要
Natural ecosystems provide human society with very important products and services. With the rapid increase in population and the over-exploitation of natural resources, humans are continually enhancing the production of some services at the expense of others. This paper estimates changes in ecosystem services, and the relationship between these services in the Guanzhong-Tianshui Economic Region of China. These ecosystem changes are of great significance to the sustainable development of this economic region. The concept of production possibility frontier (PPF) is applied to evaluate the trade-offs and synergy between carbon sequestration, water yield and soil retention. Three land use strategy scenarios lanning, exploitation and protection re applied to evaluate potential changes in ecosystem services. This study reveals noticeable trade-offs between carbon sequestration, soil retention and water yield, with synergy between carbon sequestration and soil retention. There are synergies between carbon sequestration, water yield and soil retention in the three scenarios. The protection scenario is the most favourable land use strategy for regulating ecosystem service capacity. This scenario results in the highest carbon sequestration, water yield and soil retention. The results could have implications for natural capital and ecosystem services planning, management and land use decision-making.
|
| [16] |
A review on the tradeoffs and synergies among ecosystem services. https://doi.org/10.13292/j.1000-4890.201611.020 URL Magsci [本文引用: 1] 摘要
<div style="line-height: 150%">作为链接人类福祉和生态系统的桥梁,生态系统服务成为地理学、生态学和其他相关学科的重要研究内容。掌握生态系统服务权衡与协同关系,对提升生态系统服务总体效益和人类福祉至关重要,并可辅助自然资源管理和生态规划实践,目前已成为生态系统服务研究的热点。在归纳生态系统服务内涵、分类及价值评估研究进展基础上,从理论基础、类型划分和研究方法等方面系统梳理了生态系统服务权衡与协同研究进展,并从以下4个方面提出未来可能的研究趋势,包括丰富权衡与协同理论基础,建构多学科综合研究体系;完善生态系统服务分类体系,量化权衡与协同非线性特征;刻画生态系统服务空间流动,加强权衡与协同跨时空集成;系统化揭示权衡与协同机理,推动成果在国土领域的应用。</div><div style="line-height: 150%"> </div>
生态系统服务权衡与协同研究进展 .https://doi.org/10.13292/j.1000-4890.201611.020 URL Magsci [本文引用: 1] 摘要
<div style="line-height: 150%">作为链接人类福祉和生态系统的桥梁,生态系统服务成为地理学、生态学和其他相关学科的重要研究内容。掌握生态系统服务权衡与协同关系,对提升生态系统服务总体效益和人类福祉至关重要,并可辅助自然资源管理和生态规划实践,目前已成为生态系统服务研究的热点。在归纳生态系统服务内涵、分类及价值评估研究进展基础上,从理论基础、类型划分和研究方法等方面系统梳理了生态系统服务权衡与协同研究进展,并从以下4个方面提出未来可能的研究趋势,包括丰富权衡与协同理论基础,建构多学科综合研究体系;完善生态系统服务分类体系,量化权衡与协同非线性特征;刻画生态系统服务空间流动,加强权衡与协同跨时空集成;系统化揭示权衡与协同机理,推动成果在国土领域的应用。</div><div style="line-height: 150%"> </div>
|
| [17] |
Spatial Bayesian belief networks as a planning decision tool for mapping ecosystem services trade-offs on forested landscapes .https://doi.org/10.1016/j.envres.2015.11.009 URL PMID: 26597639 [本文引用: 1] 摘要
An integrated methodology, based on linking Bayesian belief networks (BBN) with GIS, is proposed for combining available evidence to help forest managers evaluate implications and trade-offs between forest production and conservation measures to preserve biodiversity in forested habitats. A Bayesian belief network is a probabilistic graphical model that represents variables and their dependencies through specifying probabilistic relationships. In spatially explicit decision problems where it is difficult to choose appropriate combinations of interventions, the proposed integration of a BBN with GIS helped to facilitate shared understanding of the human–landscape relationships, while fostering collective management that can be incorporated into landscape planning processes. Trades-offs become more and more relevant in these landscape contexts where the participation of many and varied stakeholder groups is indispensable. With these challenges in mind, our integrated approach incorporates GIS-based data with expert knowledge to consider two different land use interests – biodiversity value for conservation and timber production potential – with the focus on a complex mountain landscape in the French Alps. The spatial models produced provided different alternatives of suitable sites that can be used by policy makers in order to support conservation priorities while addressing management options. The approach provided provide a common reasoning language among different experts from different backgrounds while helped to identify spatially explicit conflictive areas
|
| [18] |
Synergies, trade-offs, and losses of ecosystem services in urban regions: An integrated multiscale framework applied to the Leipzig-Halle Region, Germany. https://doi.org/10.5751/ES-04853-170322 URL [本文引用: 1] 摘要
Because we have entered the #039;millennium of the cities#039;, urban ecological research needs to account for the provisions ecosystem services provide to urban regions. In urban areas, ecosystem service assessment studies need to account for the complex land use patterns, which change over relatively short periods of time. We discuss an analytical framework for the spatial and temporal integration of different ecosystem services in an urban region to determine synergies, trade-offs and losses, and we employ a case study in Leipzig-Halle, Germany. The following five ecosystem services, which are of special importance for urban areas, were selected: local climate regulation, recreation potential, biodiversity potential, food supply, and above-ground carbon storage. These services were analyzed from 1990 to 2006. Our results identified only slight increases in urbanization (1% or 3 km ) and in mining restoration (-11 km ). However, the detected land use changes led to synergies with biodiversity and climate regulation of gt; 50% of the total area, whereas trade-offs of approximately 60% were detected between variables such as climate regulation and recreation. Finally, we address both the opportunities and the challenges that were encountered in the integration study, specifically with respect to the application in land use planning.
|
| [19] |
Comparing strengths and weaknesses of three ecosystem services modelling tools in a diverse UK river catchment .https://doi.org/10.1016/j.scitotenv.2016.12.160 URL PMID: 28147292 [本文引用: 1] 摘要
Ecosystem services modelling tools can help land managers and policy makers evaluate the impacts of alternative management options or changes in land use on the delivery of ecosystem services. As the variety and complexity of these tools increases, there is a need for comparative studies across a range of settings, allowing users to make an informed choice. Using examples of provisioning and regulating services (water supply, carbon storage and nutrient retention), we compare three spatially explicit tools LUCI (Land Utilisation and Capability Indicator), ARIES (Artificial Intelligence for Ecosystem Services) and InVEST (Integrated Valuation of Ecosystem Services and Tradeoffs). Models were parameterised for the UK and applied to a temperate catchment with widely varying land use in North Wales. Although each tool provides quantitative mapped output, can be applied in different contexts, and can work at local or national scale, they differ in the approaches taken and underlying assumptions made. In this study, we focus on the wide range of outputs produced for each service and discuss the differences between each modelling tool. Model outputs were validated using empirical data for river flow, carbon and nutrient levels within the catchment. The sensitivity of the models to land-use change was tested using four scenarios of varying severity, evaluating the conversion of grassland habitat to woodland (0 30% of the landscape). We show that, while the modelling tools provide broadly comparable quantitative outputs, each has its own unique features and strengths. Therefore the choice of tool depends on the study question.
|
| [20] |
Modeling multiple ecosystem services, biodiversity conservation, commodity production, and tradeoffs at landscape scales. https://doi.org/10.1890/080023 URL [本文引用: 1] |
| [21] |
The consequences of four land-use scenarios for forest ecosystems and the services they provide. https://doi.org/10.1002/ecs2.1469 URL [本文引用: 1] 摘要
Abstract Anticipating landscape- to regional-scale impacts of land use on ecosystems and the services they provide is a central challenge for scientists, policymakers, and resource managers. Working with a panel of practitioners and regional experts, we developed and analyzed four plausible but divergent land-use scenarios that depict the future of Massachusetts from 2010 to 2060 to address two questions: (1) ow do the magnitude and spatial distribution of ecosystem service provisioning vary under the different land-use regimes? and (2) hat are the synergies and trade-offs among direct human uses, ecosystem services, and habitat quality? Each scenario specifies the detailed prescriptions for the major uses of the forests, including conversion to residential and commercial development, clearing new farmland, shifting silvicultural practices, and designating forests protected from development. We simulated the land-use scenarios and their interactions with anticipated climate change by coupling statistical models of land use to the LANDIS-II landscape model and then evaluated the outcomes in terms of the magnitude and spatial distribution of (1) direct human uses of the landscape (residential and commercial development, agricultural, timber harvest), (2) ecosystem services (carbon storage, flood regulation, nutrient retention), and (3) habitat quality (forest tree species composition, interior forest habitat). Across all scenarios, conflicts occurred between dispersed residential development and the supply of ecosystem services and habitat quality. In all but the scenario that envisioned a significant agricultural expansion, forest growth resulted in net increases in aboveground carbon storage, despite the concomitant forest clearing and harvesting. One scenario, called Forests as Infrastructure, showed the potential for synergies between increased forest harvest volume through the sustainable practices that encouraged the maintenance of economically and ecologically important tree species, and carbon storage. This scenario also showed trade-offs between development density and water quantity and quality at the watershed scale. The process of integrated scenario analysis led to important insights for land managers and policymakers in a populated forested region where there are tensions among development, forest harvesting, and land conservation. More broadly, the results emphasize the need to consider the consequences of contrasting land-use regimes that result from the interactions between human decisions and spatially heterogeneous landscape dynamics.
|
| [22] |
Ecosystem services in changing land use. https://doi.org/10.1007/s11368-015-1082-x URL [本文引用: 1] 摘要
Ongoing population growth and economic development place increasing demands on the supply of services produced in and by ecosystems. The resulting degradation compromises their ability to continue sup
|
| [23] |
Future ecosystem services from European mountain forests under climate change. https://doi.org/10.1111/1365-2664.12772 URL [本文引用: 1] 摘要
Abstract Ecosystem services (ES) from mountain forests are highly relevant for human societies. ES with a direct economic support function (e.g. timber production), regulatory services (e.g. protection from natural hazards) and cultural services (e.g. recreation) are likely to be affected strongly by a rapidly changing climate. To evaluate whether adverse climate change effects on ES can be counteracted by adapting management, dynamic models and indicator-based assessments are needed. 2.We applied a forest dynamic model in case study areas of four European mountain regions and evaluated the future supply of four ES - timber production, carbon sequestration, biodiversity, and protection against natural hazards - using state-of-the-art ES indicators. Forest dynamics were simulated under three management scenarios (no management, business-as-usual, and alternative management) and five climate change projections for selected representative stand types in each region. We analysed potential trade-offs and synergies between ES, and evaluated future changes among regions, forest stands, climate and management scenarios. 3.Impacts of climate change on the provision of multiple ES were found to be highly heterogeneous and to depend on the region, site, and future climate. In the absence of large-scale natural disturbance (not considered), protection services, carbon stock and deadwood abundance (proxy for biodiversity) benefitted from no management in all regions. Negative impacts of climate change were evident for the provision of multiple ES but limited to the most severe climate scenarios and low-elevation stands. Synergies and trade-offs between the majority of ES were found to be sensitive to the choice of management strategy and in some regions to climate change. 4.Synthesis and applications. Management regimes in European mountain forests should be regionally adapted to stand and site conditions. Although in some cases alternative management regimes may be more suitable than current management for supporting multiple ecosystem services, adaptation options should be evaluated carefully at the local scale due to the highly different magnitude of the impacts of climate change in different regions and along elevation gradients. This article is protected by copyright. All rights reserved.
|
| [24] |
Ecosystem service trade-offs and synergies misunderstood without landscape history. https://doi.org/10.5751/ES-08345-210143 URL [本文引用: 3] 摘要
Dramatic changes in ecosystem services have motivated recent work characterizing their interactions, including identifying trade-offs and synergies. Although time is arguably implicit in these ideas of trade-offs and synergies (e.g., temporal dynamics or changes in ecosystem services), such interactions are routinely inferred based on the spatial relationships among ecosystem services alone (e.g., spatial concordance of ecosystem services indicates synergies, whereas incongruence signifies trade-offs). The limitations of this approach have not been fully explored. We quantified ecosystem service interactions using correlations among contemporary ecosystem services and compared these results to those derived by incorporating change in ecosystem services from an earlier decade. To document change over ~60 years in an urbanizing floodplain, we used aerial photography to map multiple floodplain-associated ecosystem services. Our results demonstrate how incorporating landscape baselines can influence measured synergies and trade-offs. Spatial correlations among contemporary ecosystem services missed several interactions that were detected when using prior baseline ecosystem services. Ignoring the history of ecosystem services and their change over time may result in missed opportunities to foster their synergies and lead to unnecessary trade-offs. Efforts to incorporate ecosystem services into land management should include long-term monitoring and baseline reconstructions of ecosystem services.
|
| [25] |
Soil conservation service function of Hanjiang River upstream forest ecosystems.
汉江上游是南水北调中线水源地主要集水区,流域森林生态系统土壤保持是保证水源地水质的关键因素之一。该研究以汉江上游森林生态系统为对象,运用In-vest模型土壤保持模块(Sediment Retention Model)对区域土壤保持功能进行动态变化分析。结果表明,2000年、2005年、2010年汉江上游森林生态系统土壤保持功能价值先减后增,总体呈下降趋势,三期价值依次为8.23、7.86、8.18亿元;从空间上看,三期均为中低山区潜在土壤侵蚀明显高于中高山区,土壤保持功能随海拔增高而增强,在区域内总体呈西南高、东北低的趋势。研究表明,区域潜在土壤侵蚀较高,土壤保持功能有所下降,应进一步做好相应防治措施。
汉江上游森林生态系统土壤保持服务功能研究 .
汉江上游是南水北调中线水源地主要集水区,流域森林生态系统土壤保持是保证水源地水质的关键因素之一。该研究以汉江上游森林生态系统为对象,运用In-vest模型土壤保持模块(Sediment Retention Model)对区域土壤保持功能进行动态变化分析。结果表明,2000年、2005年、2010年汉江上游森林生态系统土壤保持功能价值先减后增,总体呈下降趋势,三期价值依次为8.23、7.86、8.18亿元;从空间上看,三期均为中低山区潜在土壤侵蚀明显高于中高山区,土壤保持功能随海拔增高而增强,在区域内总体呈西南高、东北低的趋势。研究表明,区域潜在土壤侵蚀较高,土壤保持功能有所下降,应进一步做好相应防治措施。
|
| [26] |
Vegetation dynamics in Qinling-Daba Mountains in relation to climate factors between 2000 and 2014. https://doi.org/10.1007/s11442-016-1253-8 URL [本文引用: 1] 摘要
用中等分辨率成像使分光辐射函数正常化的差别植被索引(NDVI ) 数据集,我们在 20002014 在 Qinling-Daba (Qinba ) 山在植被范围和它的联系驱动力调查了空间与时间的变化的模式。参议员和 MannKendall 模型和部分关联分析被用来分析数据,由林中小丘索引的计算列在后面在植被范围分析未来趋势。学习的结果证明(1 ) 学习区域的 NDVI 在 20002014 展出了重要增加(线性趋势, 2.8%/10a ) 。在这个时期期间,稳定的增加在 2010 前被检测(线性趋势, 4.32%/10a ) ,在 2010 以后由锋利的衰落列在后面(线性趋势, 6.59%/10a ) 。(2 ) 空间地,植被盖子在中间显示出高度并且一在环境模式低。植被范围的高价值主要在 Shaanxi 省的 Qinba 山被发现。(3 ) 有改进植被范围的区域比降级的区域大,分别地,在学习时期期间是 81.32% 和 18.68% 。Piecewise 分析表明 71.61% 全部的学习区域在 20102014 在植被范围显示出一个减少的趋势。(4 ) 植被范围变化的反向的特征是比 Qinba 山上的一样的特征强壮的。大约 46.89% 全部学习区域被预言以后减少,当 34.44% 全部的区域将跟随一个连续地增加的趋势时。(5 ) 植被范围的变化主要在降水被归因于赤字。而且,植被范围在 El Nino 年期间在拉·尼娜年期间比那高。(6 ) 人的活动能在植被范围上导致模糊效果:两积极效果(通过生态的恢复工程的实现) 并且否定效果(通过都市化) 被观察。
|
| [27] |
Chemical weathering characteristics and regional comparative study of the loess deposits in the upper Hanjiang River. https://doi.org/10.11821/dlxb201702008 URL [本文引用: 1] 摘要
本文对汉江上游黄土的常量元素含量及相关地球化学参数CIA、Na/K、淋溶系数、退碱系数、残积系数等进行了系统分析。结果显示:①汉江黄土的主要化学成分为SiO2、Al2O3和Fe2O3,三者含量总和达767.3g/kg;常量元素含量大小排序为SiO2〉Al2O3〉Fe2O3〉K2O〉MgO〉Na2O〉CaO。风化成壤过程中Na、Ca、Mg、Si发生不同程度的迁移淋溶,而Fe、Al、K相对富集。②其风化成壤强度呈现从马兰黄土L1→过渡性黄土Lt→古土壤S0逐渐升高、全新世黄土L0又降低的规律,记录了该区域气候经历了末次冰期(55.0-15.0kaBP)冷干、早全新世(15.0-8.5kaBP)增温增湿、中全新世(8.5-3.1kaBP)达到最暖湿,晚全新世(3.1-0.0kaBP)降温变干的演变过程。③汉江黄土与洛川、巫山、下蜀黄土的元素组合特征高度一致,不同地区常量元素(CaO除外)含量十分接近且UCC标准化值变幅均小于0.25,这暗示了它们风化之初具有相似的风成沉积基础;但不同区域黄土的化学风化强度差异明显,大致呈现洛川黄土〈汉江黄土〈巫山黄土〈下蜀黄土的趋势,与中国现代季风气候的空间变化规律相吻合,即不同地区黄土风化程度差异主要是东亚季风变化影响的结果。
汉江上游黄土常量元素地球化学特征及区域对比 .https://doi.org/10.11821/dlxb201702008 URL [本文引用: 1] 摘要
本文对汉江上游黄土的常量元素含量及相关地球化学参数CIA、Na/K、淋溶系数、退碱系数、残积系数等进行了系统分析。结果显示:①汉江黄土的主要化学成分为SiO2、Al2O3和Fe2O3,三者含量总和达767.3g/kg;常量元素含量大小排序为SiO2〉Al2O3〉Fe2O3〉K2O〉MgO〉Na2O〉CaO。风化成壤过程中Na、Ca、Mg、Si发生不同程度的迁移淋溶,而Fe、Al、K相对富集。②其风化成壤强度呈现从马兰黄土L1→过渡性黄土Lt→古土壤S0逐渐升高、全新世黄土L0又降低的规律,记录了该区域气候经历了末次冰期(55.0-15.0kaBP)冷干、早全新世(15.0-8.5kaBP)增温增湿、中全新世(8.5-3.1kaBP)达到最暖湿,晚全新世(3.1-0.0kaBP)降温变干的演变过程。③汉江黄土与洛川、巫山、下蜀黄土的元素组合特征高度一致,不同地区常量元素(CaO除外)含量十分接近且UCC标准化值变幅均小于0.25,这暗示了它们风化之初具有相似的风成沉积基础;但不同区域黄土的化学风化强度差异明显,大致呈现洛川黄土〈汉江黄土〈巫山黄土〈下蜀黄土的趋势,与中国现代季风气候的空间变化规律相吻合,即不同地区黄土风化程度差异主要是东亚季风变化影响的结果。
|
| [28] |
Spatial heterogeneous response of land use and landscape functions to ecological restoration: The case of the Chinese loess hilly region. https://doi.org/10.1007/s12665-014-3175-z URL [本文引用: 1] 摘要
Ecological restorations over time may have profound effects on ecological and socio-economic systems. However, land-use changes and landscape functions that accompany ecological restorations can have spatial differentiations due to varied biophysical and socio-economic contexts. Therefore, these spatial differentiations caused by ecological restoration must be understood for better planning and management of restoration activities. The Baota District, with 576 villages in the center of the Chinese Loess Plateau, was selected as the study area because of its dramatic transition from cropland to grassland and shrubland from 1990 to 2010. Using the ArcGIS software and a k -means clustering analysis, an approach to identify types of land-use change patterns (TLCPs) at the village level was developed, and four TLCPs were delineated. The analysis indicated a general pattern of cropland decline by 21.6%, but revealed significant spatial variations between villages in different TLCPs. Vegetation cover and soil retention, which are key proxies for landscape functions, increased by 22.70 and 108%, respectively, from 2000 to 2010 with significant spatial heterogeneity. The Universal Soil Loss Equation was employed for the assessment of soil retention. The analysis of landscape metrics revealed a major trend of fragmentation and regularity on the county and village scale; however, spatial variations remained. Physical attributes were used to characterize different TLCPs, and notable differences were found. The spatial heterogeneous change in land use and landscape functions on the village scale may be useful for land use and ecological restoration management policy makers.
|
| [29] |
Classification system of China land cover for carbon budget. https://doi.org/10.5846/stxb201310102431 URL Magsci [本文引用: 1] 摘要
生态系统的碳收支是影响全球变化的重要环节,而土地覆被变化改变了生态系统碳收支的现状、速率.提出了面向碳收支的中国土地覆被分类系统,服务于生态系统碳收支估算和国家生态环境监测.分类系统由一、二级土地覆被类型、三级土地覆被辅助特征构成.通过物质组成、结构、排列、季节特征等19个指标,将土地覆被划分38个二级类型,反映生态系统的碳储量现状.三级土地覆被辅助特征利用9个指标补充了二级土地覆被类型的属性.其中5个环境指标主要反映生态系统碳储备的潜力和强度,土地利用方式指标反映植被演替过程植被碳收支中的人为扰动影响,植被覆盖度、植被生育期、物种特征指标用于进一步细化植被类型.二级类型与三级特征为分层组织的土地覆被产品,有利于产品管理和应用.分类系统已应用到面向全国生态系统碳收支的30m格网的中国土地覆被制图中.
基于碳收支的中国土地覆被分类系统 .https://doi.org/10.5846/stxb201310102431 URL Magsci [本文引用: 1] 摘要
生态系统的碳收支是影响全球变化的重要环节,而土地覆被变化改变了生态系统碳收支的现状、速率.提出了面向碳收支的中国土地覆被分类系统,服务于生态系统碳收支估算和国家生态环境监测.分类系统由一、二级土地覆被类型、三级土地覆被辅助特征构成.通过物质组成、结构、排列、季节特征等19个指标,将土地覆被划分38个二级类型,反映生态系统的碳储量现状.三级土地覆被辅助特征利用9个指标补充了二级土地覆被类型的属性.其中5个环境指标主要反映生态系统碳储备的潜力和强度,土地利用方式指标反映植被演替过程植被碳收支中的人为扰动影响,植被覆盖度、植被生育期、物种特征指标用于进一步细化植被类型.二级类型与三级特征为分层组织的土地覆被产品,有利于产品管理和应用.分类系统已应用到面向全国生态系统碳收支的30m格网的中国土地覆被制图中.
|
| [30] |
Predicting rainfall-erosion losses from cropland east of the rocky mountains-guide for selection of practices for soil and water conservation. |
| [31] |
Predicting rainfall erosion losses-a guide to conservation planning. Agriculture Handbook, Vol. 537 . |
| [32] |
EPIC-erosion/productivity impact calculator: 1. Model documentation . |
| [33] |
Balancing multiple ecosystem services in conservation priority setting. https://doi.org/10.1007/s10980-014-0106-z URL [本文引用: 4] 摘要
Conservation priority setting is the critical process of allocating the limited resources available for nature conservation and; safeguarding the sustainability of biodiversity and ecosystem services (ESs). It is difficult, however, to achieve the goal of simultaneously conserving both biodiversity and ESs, not only because of the potential trade-offs between biodiversity and ESs, but also because of the trade-offs between multiple ESs. Thus far, research has focused on the trade-offs between ESs caused by spatial competition resulting from land use change or by the destruction of biophysical interaction between multiple ESs. Few studies, however, have paid attention to the trade-offs induced during the decision-making process. Approaches for measuring the trade-offs between multiple ESs in decision-making processes would thus prove to be extremely helpful. In this paper, we map the water supply, soil conservation, and net primary production as ESs in the Jiangxi province of China in the year 2010, and use risk, tradeoff, and spatial efficiency indices to measure the conservation efficiency of seven established ordered weighted averaging (OWA) scenarios under two conservation levels (conserving the top ESs at 10 or 20 % of the area of the Jiangxi province). The main results are as follows: (1) conserving one ES may result in inefficient conservation of other ESs; and (2) conserving multiple ESs and the use of GIS-based OWA methods can balance conflicts among multiple ESs and can significantly enhance the spatial efficiency of the identified priority areas. Decision-makers may combine the spatial efficiency, risk and tradeoff levels of each OWA scenario with other specific conservation demands of their own specific cases in order to achieve the optimal identification of priority areas for the simultaneous conservation of multiple ESs.
|
| [34] |
Significant trade-off for the impact of Grain-for-Green Programme on ecosystem services in north-western Yunnan, China. https://doi.org/10.1016/j.scitotenv.2016.09.026 URL PMID: 27623527 [本文引用: 1] 摘要
Abstract Ecological restoration can mitigate human disturbance to the natural environment and restore ecosystem functions. China's Grain-for-Green Programme (GFGP) has been widely adopted in the last 15years and exerted significant impact on land-use and ecosystem services. North-western Yunnan is one of the key areas of GFGP implementation in the upper Yangtze River. Promotion of ecosystem services in this region is of great importance to the ecological sustainability of Yangtze River watershed. In this study, remote sensing and modelling techniques are applied to analyse the impact of GFGP on ecosystem services. Results show that the transformation from non-irrigated farmland to forestland could potentially improve soil conservation by 24.89%. Soil conservation of restored forest was 78.17% of retained forest while net primary production (NPP) already reached 88.65%, which suggested different recovery rates of NPP and soil conservation. Increasing extent of GFGP implementation improved soil conservation but decreased NPP and water yield at sub-watershed scale, which revealed trade-offs between ecosystem services under ecological restoration. Future ecosystem management and GFGP policy-making should consider trade-offs of ecosystem services in order to achieve sustainable provision of ecosystem services. Copyright 2016 Elsevier B.V. All rights reserved.
|
| [35] |
Prediction of soil erosion in a Lake Victoria basin catchment using a GIS-based Universal Soil Loss model. https://doi.org/10.1016/S0308-521X(02)00012-4 URL [本文引用: 1] 摘要
Soil erosion patterns in watersheds are patchy, heterogeneous and therefore difficult to assess. The problem can be overcome by using predictive models. However, wide spread soil erosion model-factor parameterization and quantification is difficult due to the costs, labor and time involved. The objective of this study was to evaluate different methods of USLE input parameter derivation and to predict soil loss within a microcatchment of the Lake Victoria basin (LVB). The highest soil loss was predicted for annual cropland use (93 t ha 611 year 611 ), followed by rangeland (52 t ha 611 year 611 ), banana–coffee (47 t ha 611 year 611 ), banana (32 t ha 611 year 611 ) and forest and papyrus swamp. In the terrain units, soil loss was highest within the back slopes (48 t ha 611 year 611 ) followed by the summits (42 t ha 611 year 611 ) and valleys (0 t ha 611 year 611 ). For the soil units, soil loss was highest in the Chromic Luvisols (52 t ha 611 year 611 ) followed by Petroferric Luvisols (37 t ha 611 year 611 ), Mollic Gleysols (5 t ha 611 year 611 ) Dystric Planasols (0 t ha 611 year 611 ) in large part because soil classification often correspond to various slope position.
|
| [36] |
Assessing the soil erosion control service of ecosystems change in the Loess Plateau of China. https://doi.org/10.1016/j.ecocom.2011.07.003 URL [本文引用: 1] 摘要
Soil erosion in terrestrial ecosystems, as an important global environmental problem, significantly impacts on environmental quality and social economy. By protecting soil from wind and water erosion, terrestrial ecosystems supply human beings with soil erosion control service, one of the fundamental ecosystem services that ensure human welfare. The Loess Plateau was one of the regions in the world that suffered from severe soil erosion. In the past decades, restoration projects were implemented to improve soil erosion control in the region. The Grain-to-Green project, converting slope croplands into forest or grasslands, launched in 1999 was the most massive one. It is needed to assess the change of soil erosion control service brought about by the project. This study evaluated the land cover changes from 2000 to 2008 by satellite image interpretation. Universal Soil Loss Equation (USLE) was employed for the soil erosion control assessment for the same period with localized parameters. Soil retention calculated as potential soil erosion (erosion without vegetation cover) minus actual soil erosion was applied as indicator for soil erosion control service. The results indicate that ecosystem soil erosion control service has been improved from 2000 to 2008 as a result of vegetation restoration. Average soil retention rate (the ratio of soil retention to potential soil loss in percentage) was up to 63.3% during 2000–2008. Soil loss rate in 34% of the entire plateau decreased, 48% unchanged and 18% slightly increased. Areas suffering from intense erosion shrank and light erosion areas expanded. Zones with slope gradient of 8°–35° were the main contribution area of soil loss. On average, these zones produced 82% of the total soil loss with 45.5% of the total area in the Loess Plateau. Correspondingly, soil erosion control capacity was significantly improved in these zones. Soil loss rate decreased from 5000 t km 612 yr 611 to 3600 t km 612 yr 611, 6900 t km 612 yr 611 to 4700 t km 612 yr 611, and 8500 t km 612 yr 611 to 5500 t km 612 yr 611 in the zones with slope gradient of 8°–15°, 15°–25°, and 25°–35° respectively. However, the mean soil erosion rate in areas with slope gradient over 8° was still larger than 3600 t km 612 yr 611, which is far beyond the tolerable erosion rate of 1000 t km 612 yr 611. Thus, soil erosion is still one of the top environmental problems that need more ecological restoration efforts.
|
| [37] |
Regional effects of vegetation restoration on water yield across the Loess Plateau, China. |
| [38] |
Potential water yield reduction due to forestation across China. https://doi.org/10.1016/j.jhydrol.2005.12.013 URL [本文引用: 1] 摘要
It is widely recognized that vegetation restoration will have positive effects on watershed health by reducing soil erosion and non-point source pollution, enhancing terrestrial and aquatic habitat, and increasing ecosystem carbon sequestration. However, the hydrologic consequences of forestation on degraded lands are not well studied in the forest hydrology community as a whole. China has the largest area of forest plantations in the world now, and the hydrologic consequences of massive forestation are unknown. We applied a simplified hydrological model across the diverse physiographic region to estimate the potential magnitude of annual water yield response to forestation. Our study suggests that the average water yield reduction may vary from about 50 mm/yr (50%) in the semi-arid Loess Plateau region in northern China to about 300 mm/yr (30%) in the tropical southern region. We conclude that forestation in China that often involves a combination of tree planting and engineering (e.g., terracing) may have even a higher potential to greatly reduce annual water yield in headwater watersheds, especially in the semi-arid Loess Plateau region. However, the forestation area is relatively small for most large basins with mixed landuses in China, thus the regional effects of forestation on water resource management may not be of major concern. Comprehensive science-based evaluation of roles of forests on regulating regional water resources is critical to the current forestation endeavors in China.
|
| [39] |
Water yield responses to climate change and variability across the North-South Transect of Eastern China (NSTEC). https://doi.org/10.1016/j.jhydrol.2012.12.020 URL [本文引用: 2] 摘要
China is facing a growing water crisis due to climate and land use change, and rise in human water demand across this rapidly developing country. Understanding the spatial and temporal ecohydrologic responses to climate change is critical to sustainable water resource management. We investigated water yield (WY) responses to historical (1981–2000) and projected potential climate changes across a large and complex climatic and land cover gradients over the North–South Transect of Eastern China (NSTEC, a standard terrestrial transect of the International GeoBiological Project, IGBP). After an annual scale evapotranspiration (ET) model was validated with historical streamflow records from ten watersheds, the model was applied to the NSTEC that encompasses seven climatic zones. We found that (1) The spatial and temporal variations of WY were highly dependent on precipitation ( P ) patterns during 1981–2000. Overall, the influences of significant temperature ( T ) rise on the trend of WY were suppressed by the insignificant P change during 1981–2000. (2) The long-term mean WY by climatic zone had a similar pattern as P . The different climatic zones had differential contributions to the total volumetric WY of the NSTEC. Within each climatic zone, the volumetric WY for each land cover type was highly dependent on its area of each land cover. (3) Corresponding to the P pattern, the mean WY decreased from the low (South) to high latitude (North), but the rates of changes varied along the NSTEC. Along the NSTEC, the sensitivity of WY to potential T and P changes increased from the high latitude to the low latitude. Future potential changes in WY are likely to follow changes in P with some modification by changes in energy availability. We conclude that precipitation is a major driver for water resource availability, and reliable prediction of future precipitation change patterns is critical to hydrologic forecast across the study region.
|
| [40] |
The effect of forest harvesting and climatic variability on runoff in a large watershed: The case study in the Upper Minjiang River of Yangtze River Basin .https://doi.org/10.1016/j.jhydrol.2012.05.050 URL [本文引用: 1] 摘要
Forest disturbance (or land cover change) and climatic variability are commonly recognized as two major drivers interactively influencing hydrology in forested watersheds. However, separating their relative contributions to hydrology is rarely examined, particularly in large watersheds (>100002km 2 ). This study used a large watershed, the Upper Zagunao River watershed, situated in the upper reach of the Minjiang River, the Yangtze River basin, China as an example to demonstrate how the effects of forest harvesting and climatic variability on hydrology can be quantitatively separated. Long-term data on climate, hydrology and forest harvesting history are available from1953 to 1996. Time series cross-correlation analysis and non-parametric tests were performed first to identify possible responses of annual and seasonal runoff to forest harvesting, and to determine breakpoints of runoff change over its long-term time series. Then, modified double mass curve of accumulated annual effective precipitation (the residual of precipitation and evapotranspiration) and accumulated annual runoff was used to quantify the relative contributions of forest harvesting and climatic variability to annual runoff variation. Our analysis showed that the breakpoint of significant annual runoff change occurred in1969, about 1002yrs after the intensive harvesting period of 1955–1962, suggesting the delayed hydrological response in the studied large watershed. Over the period of 1970–1996, the average annual runoff increment attributed to forest harvesting was 3802mm/yr, while the annual runoff variation attributed to climatic variability was 6138.302mm/yr, clearly demonstrating that forest harvesting and climatic variability had offsetting effects on annual runoff. Our results also disclosed that the positive effect of forest harvesting on runoff decreased with forest recovery and eventually diminished about 2002yrs after intensive harvesting period.
|
| [41] |
Computation of direct runoff amounts from storm rainfall. |
| [42] |
Response of mean annual evapotranspiration to vegetation changes at catchment scale. https://doi.org/10.1029/2000WR900325 URL [本文引用: 1] |
| [43] |
Quantitative effects of climate variations and land-use changes on annual streamflow in Chaobai River basin. |
| [44] |
Regional annual water yield from forest lands and its response to potential deforestation across the southeastern United States. https://doi.org/10.1016/j.jhydrol.2004.11.021 URL [本文引用: 1] 摘要
Regional water yield at a meso-scale can be estimated as the difference between precipitation input and evapotranspiration output. Forest water yield from the southeastern US varies greatly both in space and time. Because of the hot climate and high evapotranspiration, less than half of the annual precipitation that falls on forest lands is available for stream flow in this water-rich region. Water yield is highest in the mountainous regions that receive the highest precipitation and have the lowest air temperature, and the lowest in the coastal regions that are dominated by wetlands receiving moderate rainfall but high evapotranspiration. Water resource management for both floods and droughts demands an accurate estimation of water yield from forests. Projected climate and land use changes further increase the variability of water yield in the region. The objectives of this study were to (1) develop a simple annual water yield modeling procedure by testing and calibrating a generalized global evapotranspiration model, (2) to apply the validated model to estimate regional forest water yield and to predict potential water yield response to forest removal. Hydrologic databases at a watershed-scale and a regional-scale were developed for model development, calibration, and validation. We applied the water yield model to the southern region by integrating land cover and high resolution climate databases by using a Geographic Information System (GIS). The model developed in this paper can be used to examine the spatial and temporal variability for water yield and predict the effects of climate and land cover changes at the regional scale.
|
| [45] |
Terrestrial ecosystem production: A process model based on global satellite and surface data. https://doi.org/10.1029/93GB02725 URL [本文引用: 1] 摘要
This paper presents a modeling approach aimed at seasonal resolution of global climatic and edaphic controls on patterns of terrestrial ecosystem production and soil microbial respiration. We use satellite imagery (Advanced Very High Resolution Radiometer and International Satellite Cloud Climatology Project solar radiation), along with historical climate (monthly temperature and precipitation) and soil attributes (texture, C and N contents) from global (1°) data sets as model inputs. The Carnegie-Ames-Stanford approach (CASA) Biosphere model runs on a monthly time interval to simulate seasonal patterns in net plant carbon fixation, biomass and nutrient allocation, litterfall, soil nitrogen mineralization, and microbial COproduction. The model estimate of global terrestrial net primary production is 48 Pg C yrwith a maximum light use efficiency of 0.39 g C MJPAR. Over 70% of terrestrial net production takes place between 30°N and 30°S latitude. Steady state pools of standing litter represent global storage of around 174 Pg C (94 and 80 Pg C in nonwoody and woody pools, respectively), whereas the pool of soil C in the top 0.3 m that is turning over on decadal time scales comprises 300 Pg C. Seasonal variations in atmospheric COconcentrations from three stations in the Geophysical Monitoring for Climate Change Flask Sampling Network correlate significantly with estimated net ecosystem production values averaged over 50°-80° N, 10°-30° N, and 0°-10° N.
|
| [46] |
Spatial and temporal variability in the net primary production of alpine grassland on the Tibetan Plateau since 1982. https://doi.org/10.1007/s11442-014-1087-1 URL [本文引用: 1] 摘要
Based on the GIMMS AVHRR NDVI data (8 km spatial resolution) for 1982–2000, the SPOT VEGETATION NDVI data (1 km spatial resolution) for 1998–2009, and observational plant biomass data, the CASA model was used to model changes in alpine grassland net primary production (NPP) on the Tibetan Plateau (TP). This study will help to evaluate the health conditions of the alpine grassland ecosystem, and is of great importance to the promotion of sustainable development of plateau pasture and to the understanding of the function of the national ecological security shelter on the TP. The spatio-temporal characteristics of NPP change were investigated using spatial statistical analysis, separately on the basis of physico-geographical factors (natural zone, altitude, latitude and longitude), river basin, and county-level administrative area. Data processing was carried out using an ENVI 4.8 platform, while an ArcGIS 9.3 and ANUSPLIN platform was used to conduct the spatial analysis and mapping. The primary results are as follows: (1) The NPP of alpine grassland on the TP gradually decreases from the southeast to the northwest, which corresponds to gradients in precipitation and temperature. From 1982 to 2009, the average annual total NPP in the TP alpine grassland was 177.2×10 12 gC yr 611 (yr represents year), while the average annual NPP was 120.8 gC m 612 yr 611 . (2) The annual NPP in alpine grassland on the TP fluctuates from year to year but shows an overall positive trend ranging from 114.7 gC m 612 yr 611 in 1982 to 129.9 gC m 612 yr 611 in 2009, with an overall increase of 13.3%; 32.56% of the total alpine grassland on the TP showed a significant increase in NPP, while only 5.55% showed a significant decrease over this 28-year period. (3) Spatio-temporal characteristics are an important control on annual NPP in alpine grassland: a) NPP increased in most of the natural zones on the TP, only showing a slight decrease in the Ngari montane desert-steppe and desert zone. The positive trend in NPP in the high-cold shrub-meadow zone, high-cold meadow steppe zone and high-cold steppe zone is more significant than that of the high-cold desert zone; b) with increasing altitude, the percentage area with a positive trend in annual NPP follows a trend of “increasing-stable-decreasing”, while the percentage area with a negative trend in annual NPP follows a trend of “decreasing-stable-increasing”, with increasing altitude; c) the variation in annual NPP with latitude and longitude co-varies with the vegetation distribution; d) the variation in annual NPP within the major river basins has a generally positive trend, of which the growth in NPP in the Yellow River Basin is most significant. Results show that, based on changes in NPP trends, vegetation coverage and phonological phenomenon with time, NPP has been declining in certain places successively, while the overall health of the alpine grassland on the TP is improving.
|
| [47] |
Simulation of maximum light use efficiency for some typical vegetation types in China. https://doi.org/10.1007/s11434-006-0457-1 URL 摘要
Maximum light use efficiency (εmax) is a key parameter for the estimation of net primary productivity (NPP) derived from remote sensing data. There are still many divergences about its value for each vegetation type. The εmax for some typical vegetation types in China is simulated using a modified least squares function based on NOAA/AVHRR remote sensing data and field-observed NPP data. The vegetation classification accuracy is introduced to the process. The sensitivity analysis of εmax to vegetation classification accuracy is also conducted. The results show that the simulated values of εmax are greater than the value used in CASA model, and less than the values simulated with BIOME-BGC model. This is consistent with some other studies. The relative error of εmax resulting from classification accuracy is -5.5%―8.0%. This indicates that the simulated values of εmax are reliable and stable.
|
| [48] |
The using of composite indicators to assess the conservational effectiveness of ecosystem services in China. https://doi.org/10.11821/dlxb201605006 URL [本文引用: 1] 摘要
将生态系统服务保护纳入到传统的以保护区为基础的自然保护之中是生态保护研究的新领域。利用综合指标方法,分析了中国从2000-2010年的4种生态系统服务时空变化特征;并对中国的七大生态保护和恢复区域的服务空间保护成效进行评价,提出了国家尺度上的生态系统服务保护优先性分级。主要结论为:1中国的生态系统服务自西北向东南逐渐增加,显著增加区主要分布在黄土高原地区,显著减少区主要分布在东北及华北地区。黄土高原的生态系统服务提高主要是农田向草地和林地、草地向林地的转换引的;华北地区的降低主要是耕地的减少以及人工用地的增加引起的;东北地区是由于林地向耕地草地、耕地向湿地与人工用地的转换引起的。2七大生态保护和恢复区的生态系统服务均为增加趋势而且显著增加面积大于减少面积;显著增加面积最大的为三北防护林工程区、最小的为重点生态功能区;显著减少最大为重要生态功能区、最小的为三北防护林工程区。而且,对服务的保护成效在重要生态功能区最高,其次为天然林保护工程区,其余区域均小于全国平均水平。3提出的生态系统服务保护优先性等级中,极高级别占到了国土面积的26.18%,保护的生态系统服务量占到全国总量的64.19%,保护成效为全国平均水平的2.47倍。
基于综合指标法的中国生态系统服务保护有效性评价研究 .https://doi.org/10.11821/dlxb201605006 URL [本文引用: 1] 摘要
将生态系统服务保护纳入到传统的以保护区为基础的自然保护之中是生态保护研究的新领域。利用综合指标方法,分析了中国从2000-2010年的4种生态系统服务时空变化特征;并对中国的七大生态保护和恢复区域的服务空间保护成效进行评价,提出了国家尺度上的生态系统服务保护优先性分级。主要结论为:1中国的生态系统服务自西北向东南逐渐增加,显著增加区主要分布在黄土高原地区,显著减少区主要分布在东北及华北地区。黄土高原的生态系统服务提高主要是农田向草地和林地、草地向林地的转换引的;华北地区的降低主要是耕地的减少以及人工用地的增加引起的;东北地区是由于林地向耕地草地、耕地向湿地与人工用地的转换引起的。2七大生态保护和恢复区的生态系统服务均为增加趋势而且显著增加面积大于减少面积;显著增加面积最大的为三北防护林工程区、最小的为重点生态功能区;显著减少最大为重要生态功能区、最小的为三北防护林工程区。而且,对服务的保护成效在重要生态功能区最高,其次为天然林保护工程区,其余区域均小于全国平均水平。3提出的生态系统服务保护优先性等级中,极高级别占到了国土面积的26.18%,保护的生态系统服务量占到全国总量的64.19%,保护成效为全国平均水平的2.47倍。
|
| [49] |
|
| [50] |
Spatial and temporal changing analysis of synergy and trade-off between ecosystem services in valley basins of Shaanxi Province. https://doi.org/10.11821/dlxb201703012 URL [本文引用: 1] 摘要
陕西河谷盆地是区域主要粮食基地和社会经济中心,人口增长、城镇化和工业化的加快发展,使得该地区生态环境受到人类活动的强烈冲击,生态环境面临着潜在的巨大危机,严重影响社会经济的可持续发展。本文选取西北地区经济中心—关中盆地和陕西省生态保护指定区—汉中盆地进行对比研究,以1990-2010年的生态系统服务数据(NPP、保水服务、食物供给)分析生态服务时空差异,通过相关分析、线性和幂函数回归等方法分析了生态系统服务协同与权衡的时空差异。结果表明:NPP与保水是协同关系,NPP与食物供给、保水与食物供给是权衡关系;21年中,两大盆地的协同关系均呈减弱趋势,权衡关系为加强趋势,且关中盆地的变化速度要高于汉中盆地;NPP与保水的协同程度,在关中盆地东部的耕地区域以及汉中盆地的宁强县与略阳县西部最强,以关中的铜川市和汉中的西乡县最弱;NPP与食物供给的权衡程度,在关中盆地的铜川市和西安市境内的秦岭区域以及汉中盆地的西乡县南部制约关系更为突出,以关中的宝鸡市及汉中的略阳县最弱。
陕西河谷盆地生态系统服务协同与权衡时空差异分析 .https://doi.org/10.11821/dlxb201703012 URL [本文引用: 1] 摘要
陕西河谷盆地是区域主要粮食基地和社会经济中心,人口增长、城镇化和工业化的加快发展,使得该地区生态环境受到人类活动的强烈冲击,生态环境面临着潜在的巨大危机,严重影响社会经济的可持续发展。本文选取西北地区经济中心—关中盆地和陕西省生态保护指定区—汉中盆地进行对比研究,以1990-2010年的生态系统服务数据(NPP、保水服务、食物供给)分析生态服务时空差异,通过相关分析、线性和幂函数回归等方法分析了生态系统服务协同与权衡的时空差异。结果表明:NPP与保水是协同关系,NPP与食物供给、保水与食物供给是权衡关系;21年中,两大盆地的协同关系均呈减弱趋势,权衡关系为加强趋势,且关中盆地的变化速度要高于汉中盆地;NPP与保水的协同程度,在关中盆地东部的耕地区域以及汉中盆地的宁强县与略阳县西部最强,以关中的铜川市和汉中的西乡县最弱;NPP与食物供给的权衡程度,在关中盆地的铜川市和西安市境内的秦岭区域以及汉中盆地的西乡县南部制约关系更为突出,以关中的宝鸡市及汉中的略阳县最弱。
|
| [51] |
Historical dynamics in ecosystem service bundles. https://doi.org/10.1073/pnas.1502565112 URL PMID: 26460005 [本文引用: 2] 摘要
Managing multiple ecosystem services (ES), including addressing trade-offs between services and preventing ecological surprises, is among the most pressing areas for sustainability research. These challenges require ES research to go beyond the currently common approach of snapshot studies limited to one or two services at a single point in time. We used a spatiotemporal approach to examine changes in nine ES and their relationships from 1971 to 2006 across 131 municipalities in a mixed-use landscape in Quebec, Canada. We show how an approach that incorporates time and space can improve our understanding of ES dynamics. We found an increase in the provision of most services through time; however, provision of ES was not uniformly enhanced at all locations. Instead, each municipality specialized in providing a bundle (set of positively correlated ES) dominated by just a few services. The trajectory of bundle formation was related to changes in agricultural policy and global trends; local biophysical and socioeconomic characteristics explained the bundles' increasing spatial clustering. Relationships between services varied through time, with some provisioning and cultural services shifting from a trade-off or no relationship in 1971 to an apparent synergistic relationship by 2006. By implementing a spatiotemporal perspective on multiple services, we provide clear evidence of the dynamic nature of ES interactions and contribute to identifying processes and drivers behind these changing relationships. Our study raises questions about using snapshots of ES provision at a single point in time to build our understanding of ES relationships in complex and dynamic social-ecological systems.
|
| [52] |
Land management influences trade-offs and the total supply of ecosystem services in alpine grassland in Tibet, China. https://doi.org/10.1016/j.jenvman.2017.02.008 URL [本文引用: 1] 摘要
61Grassland managements varied the trade-offs between ecosystem services.61Plowing and sowing converted the trade-off relationships into synergies immediately.61Grazing exclusion reduced the level of trade-offs gradually over time.61Variation in trade-offs relationships is because the varied dry matter allocation.61Another cause is the varied mechanism of species competition.
|
| [53] |
Evaluating tradeoffs among ecosystem services to inform marine spatial planning. https://doi.org/10.1016/j.marpol.2012.05.022 URL [本文引用: 1] 摘要
A central challenge for natural resource management is developing rigorous yet practical approaches for balancing the costs and benefits of diverse human uses of ecosystems. Economic theory has a long history of evaluating tradeoffs in returns from different assets to identify optimal investment strategies. There has been recent progress applying this framework to the delivery of ecosystem services in land use planning. However, despite growing national and international interest in marine spatial planning, there is a lack of parallel frameworks in the marine realm. This paper reviews an ecosystem service tradeoff analysis framework and provides a more comprehensive synthesis for how it can be applied to marine spatial planning and marine ecosystem-based management. A tradeoff analysis approach can reveal inferior management options, demonstrate the benefits of comprehensive planning for multiple, interacting services over managing single services, and identify 'compatible' services that provide win-win management options. (C) 2012 Elsevier Ltd. All rights reserved.
|
| [54] |
Relationship between paired ecosystem services in the grassland and agro-pastoral transitional zone of China using the constraint line method. Agriculture, https://doi.org/10.1016/j.agee.2017.02.015 URL [本文引用: 3] 摘要
Understanding the relationships between ecosystem services is important for promoting ecosystem service management and sustainable development. The relationships between ecosystem services have commonly been characterized as tradeoffs and synergies. Here, we report that a third type of relationship also exists, in which one ecosystem service constrains the other. Selecting the grassland and agro-pastoral transitional zone of North China (GAPTZ) as the study area, we examined the relationships between paired ecosystem services: net primary productivity (NPP), soil conservation (SC), soil erosion by wind (SL), water yield (WY), and water retention (WR). The constraint effect of one ecosystem service on the other was determined by extracting the upper constraint lines from the scatter plots of the paired ecosystem services with segmented quantile regression on the levels of landscape, class, and ecoregion. Our results revealed eight types of constraint effects between the ten paired ecosystem services: (1) positive linear, (2) negative linear, (3) logarithmic, (4) negative convex, (5) backward S-shaped, (6) hump-shaped, (7) convex-waved, and (8) concave-waved. At the landscape, class, and ecoregion levels, there was a hump-shaped constraint effect between NPP and SC. Precipitation was the main factor shaping the constraint line of the paired NPP-SC. The gradually increasing constraint effect of higher NPP on WY indicated that, in arid and semiarid areas, improving NPP decreases water yield. In farmland areas, the backward S-shaped constraint line of the paired NPP-SL indicates that crops, unlike forests and grasslands, could not protect soil from wind erosion. The constraint effects of SL on WY and WR are negative convex on the landscape level and convex-waved or concave-waved on the class and ecoregion levels. The constraint line approach enriches the understanding of linkages between ecosystem services and the potential drivers. The constraint effects of ecosystem services have important implications for sustainable land use planning to optimize landscapes services.
|
| [55] |
Historical influences on the current provision of multiple ecosystem services. https://doi.org/10.1016/j.gloenvcha.2015.01.015 URL [本文引用: 1] 摘要
Ecosystem service provision varies temporally in response to natural and human-induced factors, yet research in this field is dominated by analyses that ignore the time-lags and feedbacks that occur within socio-ecological systems. The implications of this have been unstudied, but are central to understanding how service delivery will alter due to future land-use/cover change. Urban areas are expanding faster than any other land-use, making cities ideal study systems for examining such legacy effects. We assess the extent to which present-day provision of a suite of eight ecosystem services, quantified using field-gathered data, is explained by current and historical (stretching back 150 years) landcover. Five services (above-ground carbon density, recreational use, bird species richness, bird density, and a metric of recreation experience quality ( continuity with the past ) were more strongly determined by past landcover. Time-lags ranged from 20 (bird species richness and density) to over 100 years (above-ground carbon density). Historical landcover, therefore, can have a strong influence on current service provision. By ignoring such time-lags, we risk drawing incorrect conclusions regarding how the distribution and quality of some ecosystem services may alter in response to land-use/cover change. Although such a finding adds to the complexity of predicting future scenarios, ecologists may find that they can link the biodiversity conservation agenda to the preservation of cultural heritage, and that certain courses of action provide win-win outcomes across multiple environmental and cultural goods.
|
| [56] |
Mapping ecosystem services for China's ecoregions with a biophysical surrogate approach. https://doi.org/10.1016/j.landurbplan.2016.12.015 URL [本文引用: 1] 摘要
Spatially explicit mapping of ecosystem services (ESs) is an essential step in drawing up policies and practices designed to improve human well-being by ensuring the sustainable provision of ESs. This study used a set of quantitative surrogate biophysical indicators to map the capability of China's eleven ecoregions to provide four types of ESs (carbon capture, soil protection, water purification and provision, and habitat provision) from 2000 to 2010. The results revealed the spatial distribution patterns and time trends of the ESs of the eleven ecoregions in China. This study shows that: (1) the average annual total value of ESs provided from 2000 to 2010 increased from northwest to southeast, and in the Middle and lower reaches of the Yangtze River as well as over the entirety of the Yunnan-Guizhou Plateau and South China ecoregions; (2) the temporal trends of annual total ESs from 2000 to 2010 showed increases in most ecoregions except those of northeast China and northern China, which experienced decreases; and (3) the surrogate biophysical method for mapping the spatial and temporal characteristics of ESs gives acceptable results, especially at large spatial scales, compared to research results obtained using more complex modeling approaches. Thus the simple surrogate approach is suitable for the rapid assessment and long-term dynamic surveillance of ESs at broad spatial scales, and for tasks such as priority setting or performance assessments for nature conservation and ecological restoration with ESs as key targets. The methodology is also suitable for land-use impact analysis and trade-off analysis concerning land-use decisions in terrestrial environments.
|
| [57] |
Ecosystem service trade-offs and their influencing factors: A case study in the Loess Plateau of China .https://doi.org/10.1016/j.scitotenv.2017.07.079 URL PMID: 28732403 [本文引用: 1] 摘要
Soil erosion control (SEC), carbon sequestration (CAS), and soil moisture (SMO) strongly interact in the semi-arid Loess Plateau. Since SMO has supportive effects on SEC and CAS, it can be considered as ecosystem service (ES), and there is an immediate need to coordinate the relationships among these ecosystem services (ESs) to promote the sustainability of vegetation recovery. In this study, we quantified the ESs, ES trade-offs, and the environmental factors in 151 sample plots in the Ansai watershed, and we used a redundancy analysis (RDA) to clarify the effects of environmental factors on these ESs and their trade-offs. The results were as follows: (1) the general trend in the SEC of vegetation types was Robinia pseudoacacia (CH)02>02native grass (NG)02>02small arbor (ST)02>02 Hippophae rhamnoides (SJ)02>02artificial grass (AG)02>02 Caragana korshinskii (NT)02>02apple orchard (GY)02>02crop (CP); the CAS trend was CH02>02SJ02>02NT02>02AG02>02CP02>02ST02>02GY02>02NG; and the SMO trend was CP02>02NG02>02GY02>02AG02>02SJ02>02ST02>02CH02>02NT. (2) For SEC-SMO trade-offs, the influence of vegetation type, altitude, silt and sand composition was dominant. The arrangement of NG, AG, and SJ could decrease the extent of the trade-offs. (3) For CAS-SMO trade-offs, vegetation coverage and types were the dominant factors, but the effects were not complex. The extent of these trade-offs was lowest for NT, and that for SJ was the second lowest. (4) Considering the relationships among the three ESs, SJ was the most appropriate afforestation plant. Combing the vegetation types, slope position, slope gradient, and soil properties could regulate these ES relationships. The dominant factors influencing ES trade-offs varied among the different soil layers, so we must consider the corresponding influencing factors to regulate ESs. Moreover, manual management measures were also important for coordinating the ES relationships. Our research provides a better understanding of the mechanisms influencing the relationships among ESs.
|

/
| 〈 |
|
〉 |
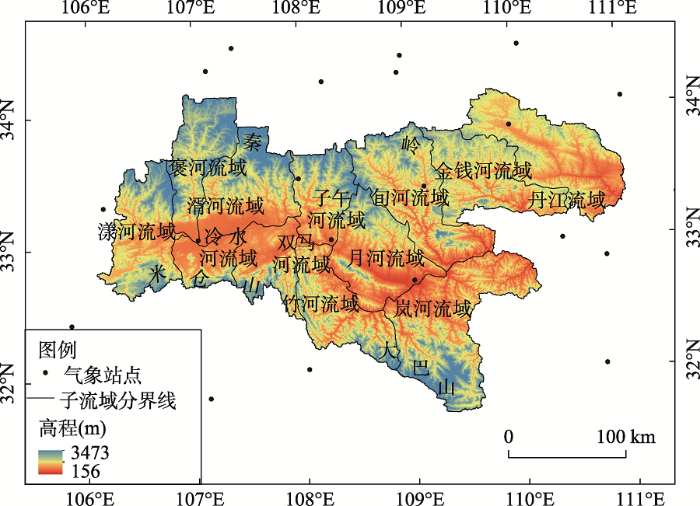
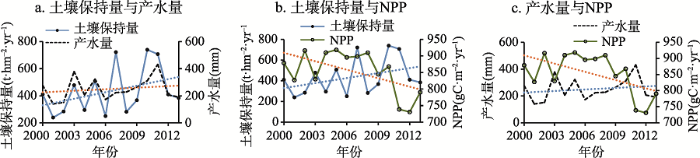
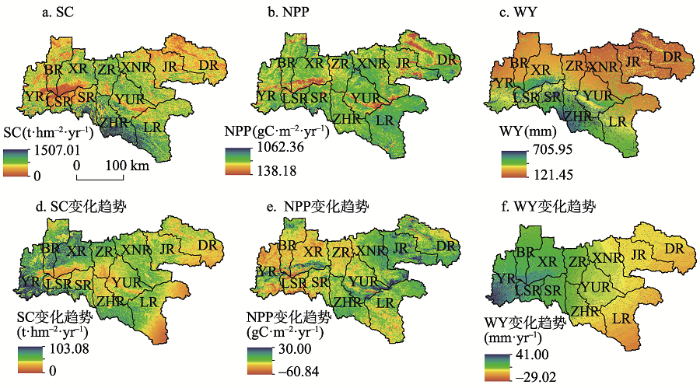

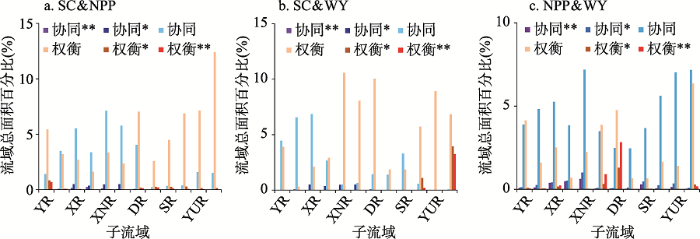
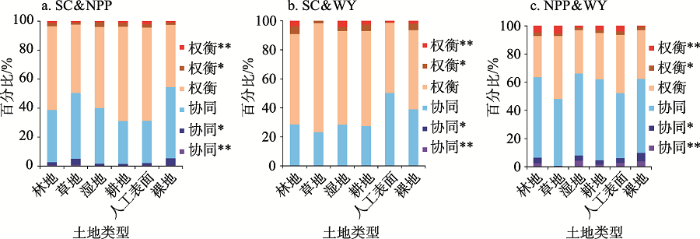