丁建丽 , 王飞
, 王飞
新疆大学资源与环境科学学院 绿洲生态教育部重点实验室,乌鲁木齐 830046
DING Jianli, WANG Fei
收稿日期: 2016-08-6
修回日期: 2016-11-26
网络出版日期: 2017-01-20
版权声明: 2017 《地理学报》编辑部 本文是开放获取期刊文献,在以下情况下可以自由使用:学术研究、学术交流、科研教学等,但不允许用于商业目的.
基金资助:
作者简介:
作者简介:丁建丽(1974-), 男, 山东人, 博士, 教授, 博士生导师, 中国地理学会会员(S110010255M), 主要从事干旱区环境演变与遥感应用研究。E-mail: watarid@xju.edu.cn
展开
摘要
区域空间信息有助于决策者针对特定潜在和既定的土壤盐渍化区域制定改良和优化政策,以避免灌区水土资源的不合理配置和干旱区土地生态系统持续性退化。然而现存区域尺度土壤盐度数据以矢量方式留存,多边形内部土壤属性无空间变异性,缺乏实时更新,对当下实际指导作用具有一定的局限性。随着人类活动的加剧,土壤及其结构性退化正加速危害土壤质量和健康。对此,急需更新或升级,用于刻画干旱区生态系统中土壤盐度数据,以辅助制定相关政策,减缓土壤盐渍化的危害。针对此问题,本文基于代表性等级的采样设计方法(Integrative Hierarchical Sampling Strategy, IHSS),获取少量典型样点,结合土壤—环境推理模型(soil land inference model, SoLIM),尝试推理区域尺度土壤盐分含量信息。研究以新疆天山南北中低海拔冲积平原为案例,仅以23个代表性样本,推理陆表(0~10 cm)土壤盐分含量,源自3个典型绿洲94个野外样本的验证数据显示,依据评判标准,预测结果与实际情况较为相符,与线性回归模型相比,具备处理土壤与环境变量之间非线性关系的SoLIM,推理精度更高。所以,研究认为模糊隶属度加权平均的方法(IHSS-SoLIM)可以通过较小的建模点得到更好的预测效果,可作为区域尺度土壤盐度推理的备选方案。
关键词:
Abstract
Regional information on the spatial distribution of soil salinity can be used as guidance in avoiding the continued degradation of land and water resources. However, most regional soil salinity maps are produced through a conventional direct-linking method derived from historic observations. Such maps lack spatial details and are limited in describing the evolution of soil salinization in particular instances. In anthropogenic regions, soil change, and soil formation and degradation, have accelerated, jeopardizing soil quality and health. The need for up-to-date soil and environmental data that characterize the physicochemical, biological, and hydrological conditions of arid ecosystems across continents has intensified (e.g. soil salinization in arid land). Digital soil mapping (DSM) and modeling techniques have been widely used in the past few decades. To overcome these limitations, we employed a method that included an integrative hierarchical-sampling strategy (IHSS) and the Soil Land Inference Model (SoLIM) to map soil salinity over a regional area. This case study, the Xinjiang Uygur Autonomous Region of China, demonstrates that the employed method can produce soil salinity maps at a higher level of spatial detail and accuracy. Twenty-three representative points are determined. The results show that: (1) the prediction is accurate in Kuqa Oasis (R2=0.70, RPD=1.55, RMSE=12.86) and Keriya Oasis (R2=0.75, RPD=1.66, RMSE=10.92), and performed a little better than in Fukang Oasis (R2=0.77, RPD=2.01, RMSE=6.32), according to the evaluation criteria. (2) Based on all validation samples from three oases, accuracy estimation shows that the employed method (R2= 0.74, RPD=1.67, RMSE=11.18) performed better than the multiple linear regression model (R2=0.60, RPD= 1.47, RMSE=14.45). Finally, this study concludes that the employed method can serve as an alternative model for soil salinity mapping on a large scale.
Keywords:
近几十年,人口增加,气候和土地利用的频繁变更,不断迫使地球系统逐步偏离常态,其中土壤的加速变化(土壤形成或者土壤退化)最为明显,由此导致土壤质量和健康受到危害[1]。干旱区灌区土壤中积累的盐分大部分源于水土资源不合理利用而引起的次生盐渍化过程,致使灌溉作物减产,弃耕地增加,生态环境趋于恶化[2]。据统计,世界范围内接近9.51 × 10⁸ hm2土壤为原生盐渍地,而次生盐渍化土地面积约7.10 × 10⁷ hm2[3],且灌溉区耕地每年以1%~2%的速度转为盐渍化土地[4]。
区域土壤盐度制图有助于决策者针对特定潜在和既定的土壤盐渍化区域制定改良和优化政策,以避免灌区水土资源的不合理配置和干旱区土地生态系统持续性退化。现存覆盖新疆地区的土壤盐度数据完成于1971-1981年的第二次国土大调查。空间信息以矢量多边形方式留存,土壤属性的空间变异性只存在于类型边界处,类型内部假设为同质,空间信息详实程度不足,与自然地理环境的空间特征不相符[5]。虽然自然界存在地理环境的突变行为,但多数以渐变形式存在。同时,此数据缺乏当下实测样本数据更新,数据精度难以满足当下需求。
由于主题的差异性,新疆地区土壤盐渍化数字推理研究覆盖多个尺度范围[6-8],多数研究集中于田间和本地尺度,时间不连续,研究成果空间分布不均匀。土壤环境问题涉及的尺度越来越大,区域斑块化信息的提取无法让决策者了解和掌握整体土壤环境的变化趋势。区域尺度的土壤盐渍化研究尚处在定性半定量的研究阶段,结合多层环境要素数据库和野外定点调查分析等数据,采用多要素综合分析解译法,通过人机交互式解译,综合判断并提取新疆盐渍化耕地的空间分布和塔里木盆地灌区土壤盐渍化的时空变 化[9-10],方法以主观判断占主导,不同盐渍化类型区域内的空间变异性依然不得而知,但这些成果为区域土壤属性数字化制图研究做了一定的铺垫。基于定量反演方式推理区域土壤属性,密集型采样不符合现实,且采样成本直线攀升,近年来,土壤环境推理模型、遥感和典型位置采样等技术的发展为快速获取区域盐度信息提供了可能[11]。
本文将研究区设定在新疆人类活动和土壤盐渍化最为集中的天山南北中低海拔冲积平原区,利用地貌类型和植被盖度数据层叠加分割土壤相对同质区,借助MODIS数据,DEM衍生变量(坡度和地形湿度指数)和土壤质地数据,基于代表性等级的采样设计,获取少量典型样点,借助以土壤—景观模型理论为基础SoLIM模型,尝试推理研究区表层(0~10 cm)土壤盐分含量。
新疆深居欧亚大陆腹地,四周距海遥远,加之北、西、南三面为高山所环抱,很难受到海洋气流的影响,属典型的温带大陆性干旱气候。该地区整体上干旱少雨,大陆性气候极强,蒸发强烈,以致形成大面积的漠土、干旱土、盐碱土、风沙土等。中部的天山将新疆分为塔里木和准噶尔南北两大盆地,高山和盆地之间的平原绿洲带为新疆的主要农业基地(图1)。根据中国第二次土壤普查数据,新疆平原绿洲分布的土壤类型主要是人为土(anthrosols)、潜育土(gleysol)、冲积土(fluvisol)、黑土(phaeozems)和盐土(solonchaks)。农田区域以棉花、玉米、小麦等非盐生植被为主。天然植被以芦苇(Phragimites australis)、柽柳(Tamarix ramosissima)、骆驼刺(Allhagi sparisifolia)、花花柴(Karelina caspica)和盐爪爪(Kalidium gracile)等为主。干旱区盐生植被属于典型隐域性植物[12],其分布与盐渍土地带性特征高度相关。
图1 新疆天山南北中低海拔冲积平原空间分布
Fig. 1 Low and middle altitude alluvial plain located in southern and northern Tianshan Mountains, Xinjiang
现存可耕作灌溉用地,自20世纪50年代-90年代末,分成6个阶段逐步开发完成[13]。① 1950-1957年为早期荒地开发起步阶段,这一阶段的开荒多采用大水漫灌(粗放式)的方式,对解决新疆当时400多万人口吃粮问题,以及帮助农民尽快摆脱贫困起到了重要作用,但也为土壤盐渍化埋下了伏笔。② 1958-1960年是所谓的“大跃进”阶段,执行“边开荒、边勘测、边设计、边生产、边积累”方针,只注意开荒数量,不注重开荒质量,虽耕地面积增加很多,却没有形成有效的生产能力,农田依靠无节制灌溉进行种植。灌溉水量大,灌溉渠道渗漏及其他管理工作不善引起土壤发生盐渍化。③ 1961-1966年为开荒速度放缓,这一时期由于在土地开发政策方面贯彻执行了“调整、巩固、充实、提高”八字方针,开始重视了土壤改良和培肥,农田防护林建设也取得一定成绩,降低了盐碱和风沙灾害,同时也注意了水利工程建设配套措施;在扩大耕地面积的同时,也重视了单位面积产量的提高。④ 1967-1977年为零星开发阶段,由粮食调出变为粮食调入,这一阶段是新疆土地开发和农业发展最低谷。⑤ 1978-1995年以提高单位面积产量为主时期,由过去外延式发展向内涵挖潜转变,由土地广度开发向深度开发转变。随后大量兴建农田水利工程,进行平原储水,但因某些地区布局不合理,破坏原有排水流势,水盐动态失衡,加剧次生盐渍化。⑥ 1996-2009年为提高单产与扩大面积相结合时期,这10多年来,新疆耕地面积快速增长,得益于水利建设和节水灌溉。这与党中央和国务院对农业的高度重视分不开,曾连续出台过多个关于推进农村改革和农业发展的中央文件,十分强调必须巩固和加强农业的基础地位,并制定了一系列稳定和完善农村基本经营制度和政策。综上所述,20世纪60年代至今,陆续发展排水系统,科学合理布局,改善灌排关系,地下水位降低,次生盐渍化免于进一步恶化。尽管如此,地表水和地下水汇集于盆地,水盐无外泄的条件,通过搬运、迁移、蒸散等方式,盆地的各个地形部位,积累不同数量和质量的水溶性盐类,积盐程度十分强烈,土壤盐渍化依旧存在。土地大开发伴随着耕地盐渍化面积的扩大,据统计,1985年新疆土壤普查盐渍化耕地面积为126.4×10⁴ hm2,占耕地总面积的31%,通过解译2006年卫星像片结合实际调查分析得知,盐渍化耕地面积162×104 hm2 [14],由于新垦土地是盐碱地,所以较土壤普查时净增加35.6×10⁴ hm2,占耕地总面积的32%,提高了1.0%。绿洲面积约占全疆面积的3%~5%,却聚集着90%的人口,贡献95%的工业和农业产值。但因气候条件影响,人类活动干扰,以及缺乏科学管理,土壤盐渍化现象依旧普遍,这已成为新疆绿洲农田发展的主要障碍之一。
3.1.1 环境变量 不同土壤的形成与发展,与其所处环境的气候、生物、地形、母质和其他因子关系密切。本文依据McBratney等[15]提出的土壤方程(The Scorpan Model, TSM)为环境因子选择的基准面,结合土壤盐渍化相关文献,确定用于推理土壤盐度的环境因子。结合研究主题,地表温度(气候因子),坡度和地形湿度指数(地形因子),植被指数(生物因子),及其他土壤盐度相关因子(土壤质地和土壤近红外光谱反射率)7个变量被选为挖掘空间土壤盐度信息的环境协同因子。
3.1.2 数据来源 搭载Terra和Auqa卫星的MODIS传感器,波谱值域范围450~2100 nm,拥有36个波段,MODIS数据对于深入了解陆地动态研究提供重要支持[16]。用于本文研究的MODIS产品包括,地表温度(land surface temperature, LST)、植被指数(enhanced vegetation index, EVI)和土壤光谱(near infrared radiometer, NIR)(https://lpdaac.usgs.gov/products/modis_products table),分辨率为1 km,获取时间为2012年7月26-8月11日。选择该时段数据的原因是:① 在查阅全年的MODIS EVI数据时发现,7月底8月初的产品质量较高,云覆盖率相对较低,这和新疆的气候特征有关;② 依据本地的植被物候特点,该时段处于植被生长期的末端,收割期的前端,全境内植被生长较好。此外,植被与土壤的关系是植物生态学研究的重要内容,研究人员常把二者作为一个系统予以研究。土壤空间变异导致了植被多样性,同时适用于干旱区。已有研究证明,植被信息作为遥感可获取的地表参数之一,其类型和生长状况能够间接反映土壤盐渍化信息[17]。
将DEM数据导入到3DMapper(www.terrainanalytics.com)软件,得到所需的环境因子:坡度。3DMapper软件采用局部曲面拟合法计算坡度[18]。地形湿度指数采用以下计算公式获得:
土壤质地数据来源于世界和谐数据库(harmonized world soil database),由中国科学院数据南京土壤研究所提供,分辨率为1 km,此数据质量可靠,可用于区域尺度陆地或气候模型[21]。
3.1.3 环境数据预处理 对环境数据的探索性分析,包括利用传统统计方法获得各层环境因子数据的统计特征值及数据分布直方图等,以及采用可视化的技术观察数据在多属性空间的分布,从而对数据结构及聚类趋势性具有一个初步的认知。在对环境数据进行探索性分析的基础上,对进行土壤推理的数据进行预处理。在本文中包括异常值处理和标准化处理。
3.2.1 相对同质区分割 研究区地跨不同气候带,地貌类型多样,地表特征复杂,为了最大化保证土壤盐分推理精度,降低计算量,减少多重因素干扰,依据地貌类型图[22],先将研究区划分为若干子区域。考虑到人类活动和土壤次生盐渍化主要发生于绿洲平原区,因此,将北疆低海拔和南疆中海拔洪积冲积平原设定为本项目的研究区。因地理环境差异,以天山为界,将新疆预先划分为南北疆两个研究子区。分区主要以新疆1:100万地貌数字地图为依据,该数据在考虑区划的一般性原则和应用性原则的基础上,除了遵循地带性与非地带性相结合、主导因素与综合分析相结合等一般性区域原则以外,还考虑到新疆地貌空间格局形成与演化历史,生成的数据以保持成因区域的完整性为基本出发点,高级单元分区以内动力成因为依据,次级单元分区以外营力为依据[22]。如此构建了包括6个一级地貌区、23个二级地貌亚区和195个三级地貌小区的新疆地貌区划新方案。考虑到研究所涉及的尺度和研究主题,选择的重点区域主要分布于干燥、流水作用和湖成的平原地区。该数据参考《中国地貌区划》和《新疆地貌》等地理图件,通过分析90 m分辨率的SRTM-DEM和30 m分辨率的TM遥感影像数据,为地貌特性的精确划分提供了保障。根据该数据集,天山以北的平原区主要分布于低海拔区(<1000 m),而天山以南呈环状分布的平原则以中海拔为主(1000~3500 m)。
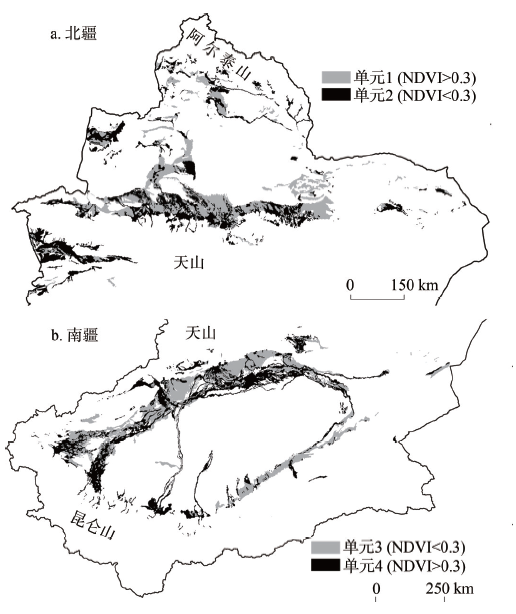
为了分析土壤空间变异性,同时限制不相关环境变量干扰,研究以NDVI为分割因子做进一步细分[23],将子区再次划分成若干陆表状况相对同质的区域,推理土壤盐分。植被指数NDVI可以用于地表覆被分类,通过设定阈值,可将研究区分成3类:裸地、部分植被覆盖和全植被覆盖区[23-25]。从以上引用文献分析得知,因大气校正,图像生成时间,图像获取方位角,卫星姿态以及传感器类型等差异,阈值大小不一,应根据研究区实际情况,通过实验对比分析,确定NDVI阈值,具体请查阅以上文献。控制地表状况,减少不确定性,保证少数因子影响土壤盐分变异性,借助新疆地区植被类型数据(http://westdc.westgis.ac.cn/)和中国第二次土壤普查数据(1:100万,源自中国科学院南京土壤研究所)经过多次实验对比分析,NDVI<0.3的区域可划分为裸地或者植被稀疏覆盖区(图2),为绿洲荒漠过渡带禾草,杂草盐生草甸,灌木,落叶灌木和多汁盐生矮半灌木荒漠植被区,而NDVI>0.3的区域多为农业种植区,具有非常相似的地形植被条件。
图2 基于NDVI阈值分割的新疆中低海拔平原相对同质化分区示意
Fig. 2 Stratifying the study area into different landform-vegetation units with NDVI value located in low altitude alluvial plain, Xinjiang
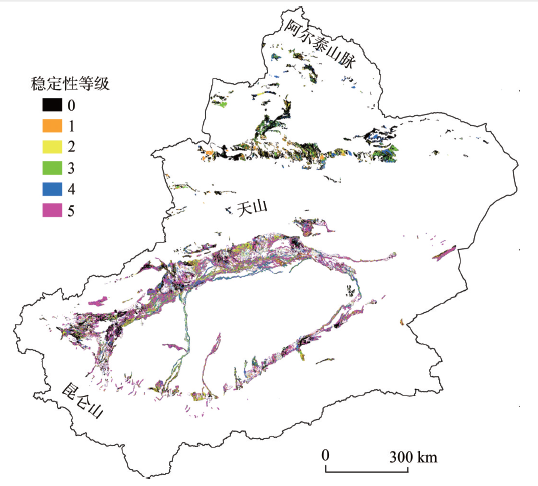
3.2.2 典型样点获取 本文中的典型样点设计方案主要参考杨琳等[26]的研究,即代表性等级的采样设计方法(Integrative Hierarchical Stepwise Sampling Strategy, IHSS),也称为目的性采样。目的性采样是根据研究目的、通过调查者的先验知识来布设少量具有“代表性”或“平均状态”的样点的采样方案。例如,在早期土壤调查制图中,采样点往往是由具有多年野外经验的土壤普查专家设计的。这种采样方法适用于对调查对象具有丰富先验知识的区域。由于所选择的样点具有“代表性”,因此通过目的性采样选择相对少量的样点就可以了解研究区的整体信息,进而可大大减少野外调查的工作量。该典型样点设计方案基于模糊逻辑的非监督分类方法―模糊c均值聚类算法(fuzzy c-means clustering, FCM)对环境因子数据进行聚类分析,并得到环境因子组合的模糊隶属度图。研究综合考虑以下3个标准,即样点模糊隶属度,样点稳定性等级和样点重叠面积,筛选典型样点。① 样点模糊隶属度:设定一定的模糊隶属度阈值,得到每一环境因子组合类的典型部位,可认为这些典型部位为典型样点的待选位置。对于某一环境因子组合类,其模糊隶属度图中隶属度值高的区域,被认为是该类环境因子组合的典型位置,本文设定隶属度值>0.8的为典型区域[23]。② 样点稳定性等级(图3):在不同聚类数下,根据隶属度确定的环境因子组合的典型位置重叠度越高,其稳定性等级越高;反之,则稳定性等级越低。③ 样点重叠面积:将环境因子组合典型位置叠加,并在重叠部位布置样点,同一稳定性等级,可认为重叠部位的面积越大,越可能得到典型样点。重叠部位包含多个栅格像元,确定最终样点位置时还需考虑,该像元对应环境组合类的隶属度值,隶属度值越大,所得样点越典型。在本文中,少于50个像素的环境因子组合链不进行样点设计。在上述三重标准判定下,同时兼顾样点在研究区的整体分布、所处土壤环境及植被覆盖情况进行布点,使样点具备空间分布的广度,同时具有对不同地貌、植被类型等因素的代表性,至此,共获取23个典型样点。
图3 新疆中低海拔平原区环境组合类典型部位出现频率
Fig. 3 The frequenc figure of occurance of environmental combination typical position in low altitude alluvial plain, Xinjiang
野外采集时,获取典型样点所在位置1 km2内采集16个点的土样均匀混合后称重装盒,带回实验室进行土壤盐分含量的测量,同时记录每个样点的相关植被及气象数据,以便与其他样点进行比对分析。表1为典型样点及其土壤盐分含量。
表1 新疆平原区相对同质化单元代表性样点特征
Tab. 1 Characteristic of representative points of relative homegeneous units in Xinjiang plain
| 区域 | 代表性等级 | 典型点序号(组合链) | 平均隶属度 | 土壤盐分含量(g/kg) | 土壤类型 |
|---|---|---|---|---|---|
| 单元1 | 4 | 1(1) | 0.93 | 110.2 | 潜育盐土 |
| 4 | 2(2) | 0.96 | 1.4 | 砂性人为土 | |
| 4 | 3(3) | 0.89 | 0.7 | 潜育黑土 | |
| 3 | 4(4) | 0.87 | 1.5 | 堆积人为土 | |
| 2 | 5(5) | 0.89 | 1.3 | 灌淤人为土 | |
| 2 | 6(21) | 0.83 | 1.8 | 潜育冲积土 | |
| 单元2 | 2 | 1(7) | 0.88 | 31.7 | 潜育盐土 |
| 4 | 2(8) | 0.94 | 0.6 | 钙积潜育土 | |
| 4 | 3(11) | 0.88 | 1.2 | 潜育黑土 | |
| 3 | 4(13) | 0.91 | 98.2 | 潜育盐土 | |
| 2 | 5(17) | 0.82 | 40.7 | 松软盐土 | |
| 2 | 6(18) | 0.81 | 100.3 | 潜育盐土 | |
| 单元3 | 5 | 1(5) | 0.99 | 56.2 | 钠质盐土 |
| 5 | 2(6) | 0.99 | 179.7 | 潜育盐土 | |
| 4 | 3(7) | 0.98 | 97.4 | 石膏盐土 | |
| 3 | 4(8) | 0.81 | 36.5 | 松软盐土 | |
| 单元4 | 5 | 1(1) | 0.98 | 0.4 | 潜育人为土 |
| 3 | 2(3) | 0.99 | 2.9 | 潜育黑土 | |
| 4 | 3(4) | 0.99 | 8.8 | 盐积冲积土 | |
| 5 | 4(2) | 0.95 | 4.2 | 石灰性黑土 | |
| 5 | 5(9) | 0.93 | 0.1 | 钙积潜育土 | |
| 2 | 6(10) | 0.97 | 1.3 | 钙积冲积土 | |
| 3 | 7(11) | 0.92 | 14.7 | 石灰性冲积土 |
3.2.3 土壤相似度计算 利用来自南北疆4个研究子区的典型样点获取土壤—环境关系知识,并通过模糊隶属度曲线来定量化这种土壤与环境关系的知识[27-28],将环境因子数据和定量化的土壤—环境关系知识输入土壤—环境推理模型(SoLIM)[27],计算土壤相似度向量,对土壤的详细空间变化进行推测。
3.2.4 基于线性加权平均法进行土壤盐度推理 利用相似度向量数据可以得到空间连续的土壤属性。由模糊隶属度计算土壤属性基于以下假设:若某点土壤成土环境与某种土壤类型的成土环境相似,该点土壤性状与特定土壤类型性状相似。土壤相似值与土壤属性值并不成线性关系,但目前还无法将土壤相似度与土壤属性间的复杂关系表达为可量化的数学公式。因此,为了简便起见,采用Zhu[29]提出的线性加权方程推算土壤盐分:
式中:Vij为某点(i, j)的某土壤属性值;Vk为典型土壤k属性的典型值;Skij为像素(i, j)的土壤环境与典型土壤k环境之间的相似度;n为区域内典型样点总数。
3.2.5 验证 多元线性回归模型作为参考引入,对比分析研究中推荐的非线性模型(IHSS-SoLIM)在土壤盐分推理中的表现。建立多元线性回归方程之前,为了减少数据冗余,降低不必要的变量给模型预测精度带来的误差,按偏相关系数的大小次序将自变量逐个引入方程,对引入方程中的每个自变量偏相关系数进行统计检验,效果显著的自变量留在回归方程内,循此规则继续遴选下一个自变量。将最终选择的环境变量构建多元线性回归模型。
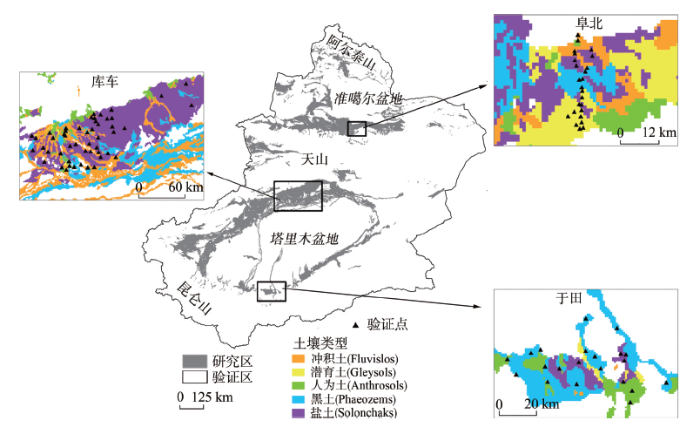
为了验证模型推理精度,选取3个典型绿洲进行实地采样,分别是天山北麓的三工河流域(阜康阜北地区),天山南麓渭干河流域(库车绿洲区)和昆仑山北麓克里雅河流域(于田绿洲)(图4)。同时考虑土壤类型和地表特征的空间变异性,依据分层采样规则,设计验证样点布局方式。三工河流域阜北地区覆盖山前洪积冲积平原,绿洲平原区和荒漠交错带,距离短,高程变化剧烈,土壤变异性较大。在此区域内采集的样点主要用于考察模型推理结果对于实际地表土壤空间变异的敏感度。库车绿洲区是南疆典型冲积平原,样点布局面积较大,选择此区域采集验证样本,用于考察模型是否能够刻画整个区域的盐渍化分布格局。上述两个绿洲位于新疆绿洲农业主产区,于田绿洲位于新疆最南端,气候与地理环境与上述地区有所差异。此外,上述研究区为新疆大学绿洲荒漠重点实验室长期观测的3个研究区,丰富的基础数据利于了解当地的自然环境和土壤—植被关系。验证点布局完成后,依据地理位置进行野外采样,同时,根据实际情况酌情调整。至此,3个地区共采集94个样本数据,阜北地区24个样点,库车地区49个样点,于田21个样点。按照对研究区的了解和地理地图的辅助判别,布点尽量覆盖不同盐分等级,土地利用形式,土壤类型和植被类型区,且样点布局相对均匀。为了减少遥感数据与地面样点之间的匹配误差,每个样点共采集16个样本进行混合,16个样点相对均匀覆盖于每个MODIS 1 km2像元,混合样品重量为500 g。
图4 新疆阜北、库车、于田地区验证样点空间分布示意
Fig. 4 Validation samples located at Fubei, Kuqa and Yutian in Xinjiang
为了定量评价土壤属性(土壤盐分)推理精度,研究中选择多种统计指数验证模型预测结果,包括相关系数R2、平方根误差(RMSE)、SD(标准差)、RPD(模拟值标准差与RMSE的比值)。其中,Y和
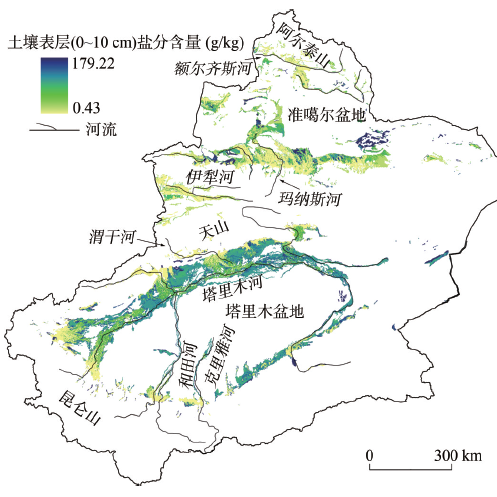
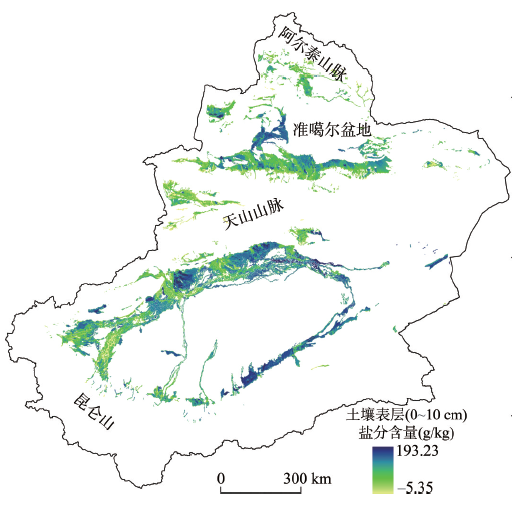
图5为新疆天山南北中低海拔平原区土壤盐分含量空间分布图。为了对比分析,研究利用94个样点逐步回归模型筛选得到的5个环境因子(表2)和目的性采样所获取的23个典型样点,构建多元线性回归模型,预测研究区表层土壤盐分含量。图6是利用多元线性回归模型生成的土壤盐分含量空间分布图。
图5 新疆天山南北中低海拔平原区土壤盐分含量(0~10 cm)预测
Fig. 5 Predicted soil salt content (0-10 cm) for the low and middle altitude alluvial plain located in southern and northern Tianshan Mountains, Xinjiang
表2 基于逐步回归分析确定最佳环境变量组合
Tab. 2 Selection of variables based on stepwise regression model
| 模型 | R | R2 | 调节的R2 | 标准误差评价 |
|---|---|---|---|---|
| 1 | 0.634a | 0.402 | 0.395 | 18.83 |
| 2 | 0.750b | 0.563 | 0.554 | 16.182 |
| 3 | 0.807c | 0.652 | 0.640 | 14.52 |
| 4 | 0.844d | 0.713 | 0.700 | 13.26 |
| 5 | 0.870e | 0.757 | 0.744 | 12.26 |
图6 基于多元线性回归模型推理的新疆中低海拔平原区土壤盐分含量(0~10 cm)预测
Fig. 6 Predicted soil salt content (0-10 cm) based on MLR for the low and middle altitude alluvial plain in Xinjiang
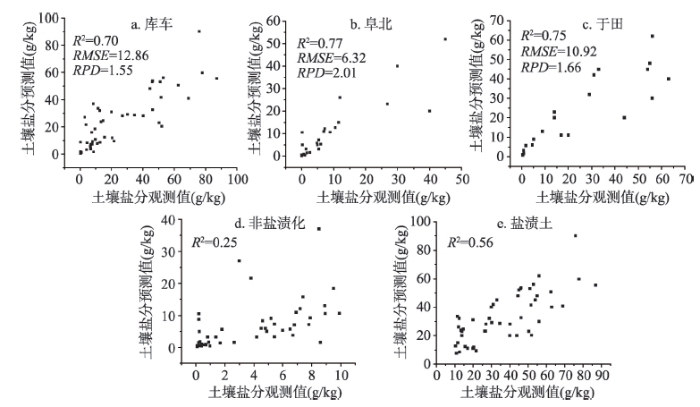
由图5得知,天山北麓和南麓绿洲内部农田区域(浅黄色)土壤盐分含量较低,蓝绿色区域(绿洲交错带、湖泊外围、河流两侧)土壤盐分含量较高。根据新疆土壤类型空间分布特征,文献及野外考察得知,推理所得的土壤盐分含量图符合预期。对比多元线性模型与IHSS-SoLIM推理结果,前者预测的土壤盐分含量的空间分布特征与SoLIM推理结果差异明显,前者预测的盐分含量上限大于后者,部分区域土壤盐分出现负值。3个地区的模型验证结果如图7所示。据3.2.5节中的评价标准,R2值在0.66~0.81之间,同时RPD在1.5~2之间,则表明模型可以用于研究区土壤属性预测。模型在阜北地区的表现好于库车和于田地区。3个验证区预测与实测数据的比较也说明,模型能够表达土壤盐分含量在区域上的空间变异性,也侧面验证,依据土壤方程选择的环境因子能够刻画土壤盐分在空间上的变化。除此之外,研究依据乔木等[31]研究中提出的土壤盐渍化分级标准(非盐渍化<10 g/kg;8 g/kg<轻度盐渍化<10 g/kg;10 g/kg<中度盐渍化<15 g/kg;15 g/kg<重度盐渍化<20 g/kg;极重度盐渍化>20 g/kg),将采样点分成两类,即非盐渍化和盐渍化样本,测试模型在上述两个区域的表现。从结果中看到(图7),非盐渍化地区的采样点R2为0.25,盐渍化地区的采样点R2为0.56,由此推测模型在盐渍化地区的预测能力好于非盐渍化地区。
图7 基于IHSS-SoLIM的验证区土壤盐分预测值和观测值的相关性分析
Fig. 7 Relationship between predicted and observed soil salt content in validation areas of Kuqa, Fubei and Yutian
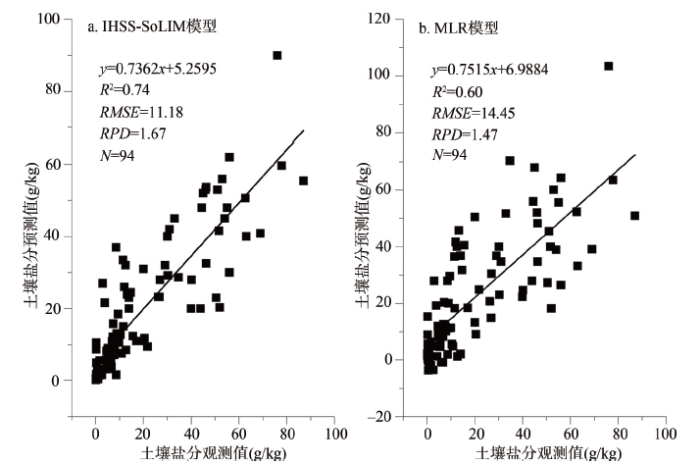
研究区内无同等尺度土壤盐分定量研究,只有少量研究以定性方式划分不同盐渍化地类的空间分布。Lobell等[17]在研究中利用皮尔森相关系数及118个野外采样点,分析多年平均EVI与土壤盐分之间的相关性,结果显示EVI数据可以解释研究区过半的土壤盐分空间变异性(R2 = 0.53)。Bouaziz等[32]利用MODIS的绿波段、红波段及红外波段建立的线性多元线性回归模型,预测研究区土壤盐分,通过112个实测样本验证,R2为0.41。尽管上述文献和本文相比,使用同样类型的数据和相同量级的样本,但因分属不同地理环境,使用的环境变量有所差异,可比性不足。因此,为了比较IHSS-SoLIM的推理能力,本文尝试建立MLR模型,予以佐证。图8显示,IHSS-SoLIM的推理结果(R2 = 0.74,RPD =1.67,N = 94)好于多元线性回归模型(R2 = 0.60,RPD = 1.47,N = 94),后者预测的土壤盐分中含有负数。
图8 基于IHSS-SoLIM和MLR的土壤盐分预测精度对比
Fig. 8 Comparison of predicted accurary of soil salt content by models on of IHSS-SoLIM and MLR
野外土壤盐分观测值与SoLIM模型预测值之间的拟合程度已在图8中显示,从图8中可以看出,二者在趋势上相似,部分样点出现偏差。为此,研究计算样点观测值与预测值之差,作进一步分析,结果显示,实测值较低的,预测值相对高估,而实测值高的,预测值相对低估。按照土壤盐分含量的分级标准,轻中度盐渍化区域样点的预测值高估,而重度以上的样点,预测值低估。
不同土壤的形成与发展,与其所处环境的气候、生物、地形、母质和其他等因子关系密切。根据表1的结果,最终入选的变量为近红外、沙土比例、地形湿度指数、地表温度和增强型植被指数。Melendez-Pastor等[33]和Bouaziz等[32]在其研究中指出,土壤光谱可用来探测土壤属性。在不考虑土壤水分的前提下,地表土壤盐分的增加,土壤反射率也随之增加[34]。干旱区地表土壤水分含量低,裸土面积较广,土壤表层盐分的多寡与可见光—近红外光谱反射率相关性密切[33]。Zhang等[35]以新疆渭干河(库车境内)绿洲为研究区,利用土壤光谱仪采集区内不同程度地表盐渍化土壤,发现近红外较其他波段而言,与土壤盐分含量相关性最大,此结论与Wang等[36]实地采样分析结果一致。Bouaziz等[32]利用MODIS前7个光谱波段与野外实测的土壤盐度进行相关性分析发现,近红外波段(NIR)相关性最高,R2为0.58。土壤质地相对于其他环境因子而言,与土壤盐分间的关系更为稳定。对于特定土壤类型,土壤质地可成为反映土壤盐度信息的主导因子[34]。土壤颗粒大小决定水分运移特征(如地下水所能到达的高度和土壤持水量),进而约束盐渍化土壤分布格局[37]。同时,土壤积盐量的多寡,与土壤质地和透水性有关。此外,Metternich等[38]在其研究中发现,雷达数据(探测地表粗糙度)可定性描述土壤盐渍化的空间分布状况;Ekwue等[39]指出,在一定程度上,土壤质地可以反映土壤盐度的空间变异性。
地形高低起伏和物质组成的不同,直接影响地表地下径流运动,进而影响土壤盐分运移。在诸多土壤盐渍化信息提取中,地形及其派生因子作为重要环境变量参与其中,诸如高程、坡度、坡向、沿剖面曲率沿等高线曲率、地形湿度指数、汇流面积和地貌部位等,可以通过数字高程模型(DEM)获取。土壤盐渍化研究中,坡度和地形湿度指数为常见地形变量[15]。在现有的土壤信息获取研究中,植被属性与地形要素的组合运用,可以有效挖掘土壤的空间变异性。McBratney等[40]综述最近60年数字土壤推理研究发现,80%的土壤信息获取研究都将地形属性作为主要预测因子,25%的研究将植被属性作为重要的预测因子。
新疆地处欧亚大陆中心,远离海洋,是中国最干旱的地区,也是世界著名的干旱地区之一。新疆高温,干燥及强烈的蒸散发,使得土壤中水流方向以上升态势为主导。自然条件下,土壤的淋溶作用和脱盐过程十分微弱,土壤中的可溶性盐分,借助毛管水上行积聚表层,现象普遍,形成大面积盐土。土壤盐分运移,季节变化特征明显。夏秋季,土壤返盐达到全年最高峰。Alav等[40]通过研究环境变量与地表特征相关性,发现陆表温度可以有效识别盐渍地与沙地的分布;Masoud等[41]在研究区内利用Landsat TM数据计算地表温度,并将之作为环境变量之一,研究土壤盐渍化的时变化;Wang等[42]在其研究中发现,盐渍地的地表反照率比研究区的平均反照率要高6%~12%,由于土壤发生次生盐渍化,使得耕地和草地和大气间的辐射能量平衡发生变化。同时,干旱区土壤水分和土壤盐分的关系密切,土壤水分含量也是影响地表温度的因素之一[43]。综上所述,温度影响水热进而影响着土壤盐分垂直及水平梯度变化,突显盐渍化土壤与非盐渍化地类地表的辐射差异。另外,植被光谱信息可以弥补单纯利用土壤信息进行盐分探测的不足[34]。可见光反射率的提高伴随近红外反射率的降低,暗示在某种环境压力下,叶绿素浓度降低细胞结构遭到破坏。盐渍化土壤中,植被生长受到盐分斜坡时,出现上述光谱反应[44]。由此,一些学者尝试利用植被指数反演土壤盐渍化信息,例如归一化植被指数NDVI,Lobell等[17]通过对比MODIS植被指数NDVI和EVI多年平均值与土壤盐度发现,EVI能够捕捉到研究区1/3到1/2的土壤盐分变异性,更适用于土壤盐度信息挖掘。
与MLR模型相比,IHSS-SoLIM模型充分利用土壤盐渍化相关变量,使得土壤盐度预测精度得以提高。后者能够处理土壤—环境之间的非线性关系,允许输入多个自相关变量,比MLR模型拥有更强的解析力[18]。
研究区气候环境跨度较大,地质环境复杂,致使平原绿洲土壤盐碱类型多样。研究中选用环境变量时,并无考虑具体环境的差异性,使用统一的数据应用于整个研究区。若能针对具体的环境筛选合适当下环境的协同变量或许可以提高推理精度。新疆平原区由若干个流域组成,可以选择典型的绿洲运用IHSS-SoLIM,将流域分成若干个子区域,每个区域选择一定数量的样点,筛选环境变量,深入挖掘方法的适用性。考虑土壤信息更新的时效性,所以并无深入探讨,可以在下一步研究中进行。
相比绿洲内部农田区域,IHSS-SoLIM在盐渍地具备更强的解析力。原因在于后者土壤空间变异性较前者更大,前者内部土壤相对同质。另外,卫星过境时,作物正逢生长期,植被覆盖度较高,遥感数据对于土壤信息变化的敏感度被削减。出现异常值的采样点位于农田外围轻度盐渍化覆盖区,地处过度带,无典型的样点信息,预测值与实际采样值偏离较远。对此,研究认为,引进地表水文或者地下水位两个环境变量,或许可以提高此处土壤盐度预测精度。由于多元线性回归模型自身模式上的原因[18],导致图8中土壤盐分含量出现负值。
采样时间和卫星过境未能同步。对于大尺度土壤属性研究,同步获取野外采样数据与遥感数据难度较大,光谱数据代表性减弱,部分降低土壤盐分预测精度。
本文基于IHSS-SoLIM模型,利用少量典型样点,借助关键环境变量推理新疆冲积平原土壤盐分含量,旨在为大尺度专题数据的更新提取提供新的途径。本文选取新疆天山的阜北地区、库车地区、于田地区作为验证区,经验证表明上述组合模型可以用于研究区土壤盐度信息的预测,模型结果能够表达土壤盐分含量在区域上的空间变异性,也侧面验证,依据土壤方程选择的环境因子能够刻画土壤盐分在空间上的变化。同时,因研究区域自然环境存在一定的差异性,后续研究工作将针对具体气候和地理环境进一步细化敏感变量,加入水文相关参数,提升土壤盐度的推理精度,同时也为丰富本地土壤盐度—环境变量知识库提供一定的理论基础。
致谢:感谢中国科学院地理科学与资源研究所朱阿兴研究员、杨琳副研究员和裴韬研究员在SoLIM方法、软件应用和典型样点设计中给予的大力支持,同时感谢中国科学院南京土壤研究所刘峰副研究员在同质区划分上提供的建议。
The authors have declared that no competing interests exist.
| [1] |
Digital soil mapping and modeling at continental scales: Finding solutions for global issues. https://doi.org/10.2136/sssaj2011.0025 URL [本文引用: 1] 摘要
ABSTRACT Profound shifts have occurred during the last three centuries in which human actions have become the main driver to global environmental change. In this new epoch, the Anthropocene, human-driven changes such as population growth, climate, and land use change are pushing the Earth system well outside of its normal operating range, causing severe and abrupt environmental change. In the Anthropocene, soil change and soil formation or degradation have also accelerated, jeopardizing soil quality and health. Thus, the need for up-to-date, high-quality, high-resolution, spatiotemporal, and continuous soil and environmental data that characterize the physicochemical, biological, and hydrologic conditions of ecosystems across continents has intensified. These needs are in sharp contrast to available digital soil data representing continental and global soil systems, which only provide coarse-scale (1:1,000,000 or coarser) vector polygon maps with highly aggregated soil classes represented in the form of crisp map units derived from historic observations, lacking site-specific pedogenic process knowledge, and only indirectly relating to pressing issues of the Anthropocene. Furthermore, most available global soil data are snapshots in time, lacking the information necessary to document the evolution of soil properties and processes. Recently, major advancements in digital soil mapping and modeling through geographic information technologies, incorporation of soil and remote sensing products, and advanced quantitative methods have produced domain-specific soil property prediction models constrained to specific geographic regions, which have culminated in the vision for a global pixel-based soil map. To respond to the challenges soil scientists face in the Anthropocene, we propose a space-time modeling framework called STEP-AWBH ("step-up"), explicitly incorporating anthropogenic forcings to optimize the soil pixel of the futurevv.
|
| [2] |
The present situation and hot issues in the salt-affected soil research. https://doi.org/10.11821/xb201209008 URL [本文引用: 1] 摘要
随着全球气候暖化问题的日益加剧,土壤盐渍化问题已经成为各国关心的全球性问题,全球约有7%的土地受到盐渍化的威胁,而且这个数字还在上升。我国是土壤盐渍化比较严重的国家,盐渍化土壤面积大,分布广,对区域农业发展构成了严重的威胁。本文对70年来我国土壤盐渍化研究的内容框架进行了梳理和概括,并结合国内外的相关研究成果对已有研究中存在的不足进行了评述;借助文献数据库和相关数据共享网络对近30年来国内外盐渍土研究的趋势和总体概况进行了总结,提出了新形势下土壤盐渍化研究的5个重点领域和方向,旨在为今后开展盐渍土研究提供新的思路。
土壤盐渍化研究现状及未来研究热点 .https://doi.org/10.11821/xb201209008 URL [本文引用: 1] 摘要
随着全球气候暖化问题的日益加剧,土壤盐渍化问题已经成为各国关心的全球性问题,全球约有7%的土地受到盐渍化的威胁,而且这个数字还在上升。我国是土壤盐渍化比较严重的国家,盐渍化土壤面积大,分布广,对区域农业发展构成了严重的威胁。本文对70年来我国土壤盐渍化研究的内容框架进行了梳理和概括,并结合国内外的相关研究成果对已有研究中存在的不足进行了评述;借助文献数据库和相关数据共享网络对近30年来国内外盐渍土研究的趋势和总体概况进行了总结,提出了新形势下土壤盐渍化研究的5个重点领域和方向,旨在为今后开展盐渍土研究提供新的思路。
|
| [3] |
Salinisation of land and water resources: Human causes, extent, management and case studies.
This book is organized in two parts. The first part provides a brief history of secondary salinization, followed by a description of the world's population, water and land resources, climate, and the extent of human-induced land degradation. Also included is a brief description of crop water requirements, irrigation methods, and processes of land and water resources salinization and their manag...
|
| [4] |
Yadav J S P, Massoud F I. Salt-affected soils and their management.
ABSTRACT The Bulletin forms a companion volume to Soils Bulletin no. 31 'Prognosis of salinity and alkalinity' published in 1976. It describes and discusses the problems of actual and potential salinity and sodicity and gives recommendations on how to overcome these. Two additional chapters are devoted respectively to "water quality" and "socio-economic considerations"
|
| [5] |
Updating conventional soil maps using knowledge on soil-environment relationships extracted from the maps. https://doi.org/10.11766/trxb200908190355 URL [本文引用: 1] 摘要
传统土壤图是流域管理、生态水文模型所需土壤空间分布信息的主要 数据源.然而,受传统制图技术和基础数据质量所限,传统土壤图的空间详细度和属性精确度并不高.随着地理信息技术的发展,如何利用可获取的高质量空间数据 和现代空间分析技术来更新传统土壤图显得十分必要.基于传统土壤图中的土壤多边形与通过模糊聚类所得环境因子组合之间存在着对应关系这一假设,本文提出了 一种从传统土壤图中提取土壤-环境关系知识并利用该知识更新传统土壤图的方法.该方法包括四个步骤:对环境数据进行模糊c均值聚类获取环境因子组合;利用 传统土壤图建立环境因子组合与土壤类型间的对应关系;提取土壤-环境关系知识;进行土壤推理制图.将该方法应用于加拿大New Brunswick省的Wakefield研究区,以更新该区现有的1:20 000的传统土壤图.应用结果表明:更新后的数字土壤图显示了更详细的空间分布信息;经野外独立验证点验证,所得土壤图(制图单元为土壤组合-排水等级) 精度高出原土壤图约20%.因此,该方法是一种有效的更新传统土壤图的方法,可增加土壤图的空间详细度、提高土壤图的属性精确度.
基于土壤—环境关系的更新传统土壤图研究 .https://doi.org/10.11766/trxb200908190355 URL [本文引用: 1] 摘要
传统土壤图是流域管理、生态水文模型所需土壤空间分布信息的主要 数据源.然而,受传统制图技术和基础数据质量所限,传统土壤图的空间详细度和属性精确度并不高.随着地理信息技术的发展,如何利用可获取的高质量空间数据 和现代空间分析技术来更新传统土壤图显得十分必要.基于传统土壤图中的土壤多边形与通过模糊聚类所得环境因子组合之间存在着对应关系这一假设,本文提出了 一种从传统土壤图中提取土壤-环境关系知识并利用该知识更新传统土壤图的方法.该方法包括四个步骤:对环境数据进行模糊c均值聚类获取环境因子组合;利用 传统土壤图建立环境因子组合与土壤类型间的对应关系;提取土壤-环境关系知识;进行土壤推理制图.将该方法应用于加拿大New Brunswick省的Wakefield研究区,以更新该区现有的1:20 000的传统土壤图.应用结果表明:更新后的数字土壤图显示了更详细的空间分布信息;经野外独立验证点验证,所得土壤图(制图单元为土壤组合-排水等级) 精度高出原土壤图约20%.因此,该方法是一种有效的更新传统土壤图的方法,可增加土壤图的空间详细度、提高土壤图的属性精确度.
|
| [6] |
Monitoring and evaluating spatial variability of soil salinity in dry and wet seasons in the Werigan-Kuqa oasis,China,using remotesensing and electromagnetic induction instruments .https://doi.org/10.1016/j.geoderma.2014.07.028 URL [本文引用: 1] 摘要
In arid and semi-arid regions, soil salinization is one of the most critical environmental problems due to its severe effects on agriculture productivity and long-term sustainable development. Monitoring, evaluating and predicting soil salinization are of utmost importance in those regions. The current study proposes an evaluating and predicting approach that is based on remote sensing (e.g., Landsat TM images) and near sensing technologies (e.g., electromagnetic induction device, EM38). We investigated seasonal and spatial changes of soil salinity in a Delta Oasis between the Werigan and Kuqa River in the northern rim of Tarim Basin, Xinjiang, China. Preliminary analysis suggests that apparent soil electrical conductivity obtained from EM38 is highly correlated with soil salinity, which is obtained from post-sampling laboratory tests. The study hence uses the apparent electrical conductivity as a surrogate for soil salinity to understand the spatial pattern of the latter. To understand soil salinity distribution pattern in the study region, we integrated spectral information derived from two Landsat TM images (acquired on April 15, 2011 for the dry season and September 22, 2011 for the wet season), and applied universal kriging, spectral index regression and regression riging approaches to obtain the pattern. Results suggest that regression riging with nested spherical model produces the closest fit of the observed soil apparent electrical conductivity. Since most previous studies often employ either one or the other approaches in soil salinity monitoring and evaluation, the study suggests that combining remote and near sensing technology provides a rapid and relatively accurate assessment of soil salinity in arid and semi-arid regions, which would be essential to manage and prevent further soil salinization and re-salinization.
|
| [7] |
Monitoring soil salinization in Keriya River Basin, northwestern China using passive reflective and active microwave remote sensing data. https://doi.org/10.3390/rs70708803 URL 摘要
ABSTRACT Soil salinization is one of the most widespread soil degradation processes on Earth, especially in arid and semi-arid areas. The salinized soil in arid to semi-arid Xinjiang Uyghur Autonomous Region in China accounts for 31% of the area of cultivated land, and thus it is pivotal for the sustainable agricultural development of the area to identify reliable and cost-effective methodologies to monitor the spatial and temporal variations in soil salinity. This objective was accomplished over the study area (Keriya River Basin, northwestern China) by adopting technologies that heavily rely on, and integrate information contained in, a readily available suite of remote sensing datasets. The following procedures were conducted: (1) a selective principle component analysis (S-PCA) fusion image was generated using Phased Array Type L-band SAR (PALSAR) backscattering coefficient OPEN ACCESS Remote Sens. 2015, 7 8804 and Landsat Enhanced Thematic Mapper Plus (ETM+) multispectral image of Keriya River Basin; and (2) a support vector machines (SVM) classification method was employed to classify land cover types with a focus on mapping salinized soils; (3) a cross-validation method was adopted to identify the optimum classification parameters, and obtain an optimal SVM classification model; (4) Radarsat-2 (C band) and PALSAR polarimetric images were used to analyze polarimetric backscattering behaviors in relation to the variation in soil salinization; (5) a decision tree (DT) scheme for multi-source optical and polarimetric SAR data integration was proposed to improve the estimation and monitoring accuracies of soil salinization; and (6) detailed field observations and ground truthing were used for validation of the adopted methodology, and quantity and allocation disagreement measures were applied to assess classification outcome. Results showed that the fusion of passive reflective and active microwave remote sensing data provided an effective tool in detecting soil salinization. Overall accuracy of the adopted SVM classifier with optimal parameters for fused image of ETM+ and PALSAR data was 91.25% with a Kappa coefficient of 0.89, which was further improved by the DT data integration and classification method yielding an accuracy of 93.01% with a Kappa coefficient of 0.92 and lower disagreement of quantity and allocation.
|
| [8] |
Remote sensing monitoring models of soil salinization based in NDVI-SI feature space. https://doi.org/10.3969/j.issn.1002-6819.2010.08.029 URL [本文引用: 1] 摘要
同时考虑植被和土壤信息,构建盐渍化遥感信息提取模型。选取具有长期研究基础的塔里木南缘于 田绿洲为研究靶区,综合分析归一化差值植被指数(NDVI)、盐分指数(SI)二者之间的关系,在此基础之上提出NDVI-SI特征空间概念,并构建土壤 盐渍化遥感监测指数模型(SDI),结果表明:土壤表层含盐量与SDI相关性较高,其R2=0.8596。非盐渍地、轻度盐渍地、中度盐渍地、重度盐渍地 的SDI平均值分别为0.399,0.763,0.974和1.201,差异较大;经差异性矩阵分析,亦表明SDI能够很好的区分研究区内不同盐渍化程度 地类的分布范围。SDI能反映盐渍化土壤地表盐量组合及其变化,具有明确的生物物理意义,并且指标简单、易于获取、有利于盐渍化定量分析与监测,对今后干 旱区盐渍地信息提取以及动态监测研究具有重要意义。
基于NDVI-SI特征空间的土壤盐渍化遥感模型 .https://doi.org/10.3969/j.issn.1002-6819.2010.08.029 URL [本文引用: 1] 摘要
同时考虑植被和土壤信息,构建盐渍化遥感信息提取模型。选取具有长期研究基础的塔里木南缘于 田绿洲为研究靶区,综合分析归一化差值植被指数(NDVI)、盐分指数(SI)二者之间的关系,在此基础之上提出NDVI-SI特征空间概念,并构建土壤 盐渍化遥感监测指数模型(SDI),结果表明:土壤表层含盐量与SDI相关性较高,其R2=0.8596。非盐渍地、轻度盐渍地、中度盐渍地、重度盐渍地 的SDI平均值分别为0.399,0.763,0.974和1.201,差异较大;经差异性矩阵分析,亦表明SDI能够很好的区分研究区内不同盐渍化程度 地类的分布范围。SDI能反映盐渍化土壤地表盐量组合及其变化,具有明确的生物物理意义,并且指标简单、易于获取、有利于盐渍化定量分析与监测,对今后干 旱区盐渍地信息提取以及动态监测研究具有重要意义。
|
| [9] |
Temporal and spatial changes of soil salinization and improved countermeasures of Tarim Basin Irrigation District in recent 25a.
依据科学和可操作性原则,建立研究区土壤盐渍化等级分类体系和解译标志.通过对三期塔里木灌区土壤盐渍化信息数据的对比研究,结果表明了该区土壤盐渍化是自然和人为因素共同作用的产物,人类活动促进了盐渍化的发展;塔里木灌区土壤盐渍化主要分布于盆地的北部和西部,危害重点地区是喀什、叶尔羌河流域等地.并由老灌区向新灌区、中重度向轻度转换,SO42-和Cl-离子重心内移.据此按该区土壤盐渍化特点和演变规律,本文提出了流域灌区土壤盐渍化改良治理战略,即:统一灌排体系、调整农业结构,采用节水、生化、工程等综合治理方法.
近25a来塔里木盆地灌区土壤盐渍化时空变化特点与改良治理对策 .
依据科学和可操作性原则,建立研究区土壤盐渍化等级分类体系和解译标志.通过对三期塔里木灌区土壤盐渍化信息数据的对比研究,结果表明了该区土壤盐渍化是自然和人为因素共同作用的产物,人类活动促进了盐渍化的发展;塔里木灌区土壤盐渍化主要分布于盆地的北部和西部,危害重点地区是喀什、叶尔羌河流域等地.并由老灌区向新灌区、中重度向轻度转换,SO42-和Cl-离子重心内移.据此按该区土壤盐渍化特点和演变规律,本文提出了流域灌区土壤盐渍化改良治理战略,即:统一灌排体系、调整农业结构,采用节水、生化、工程等综合治理方法.
|
| [10] |
Investigation and analysis on the salinization degree of cultivated land in Xinjiang based on 3S technology.
在资源环境遥感调查信息平台的支持下,以2004-2005年度中巴资源卫星影像数据为信息源,结合多层环境要素数据库、野外定点调查分析等数据,采用多要素综合分析的解译方法,通过人机交互式解译,综合判断并提取了新疆盐渍化耕地的空间分布数据,并在已有资源环境背景数据库、土地利用数据库的支持下进行了空间分析。盐渍化耕地的空间信息提取具有一定的复杂性,多要素综合分析的方法可以进行盐渍化耕地的宏观快速调查。分析结果表明:新疆灌区盐渍化耕地面积占新疆灌区耕地总面积的32.07%,近20年来盐渍化耕地所占耕地总面积的比例变化不大。盐渍化耕地大部分市县均有分布,南疆重于北疆。盐渍化耕地主要分布在洪积扇的中下部、河流中下游、地势平缓低洼等区域。新开垦的耕地中,土壤盐渍化现象普遍。
基于3S技术的新疆耕地盐渍化状况调查与分析 .
在资源环境遥感调查信息平台的支持下,以2004-2005年度中巴资源卫星影像数据为信息源,结合多层环境要素数据库、野外定点调查分析等数据,采用多要素综合分析的解译方法,通过人机交互式解译,综合判断并提取了新疆盐渍化耕地的空间分布数据,并在已有资源环境背景数据库、土地利用数据库的支持下进行了空间分析。盐渍化耕地的空间信息提取具有一定的复杂性,多要素综合分析的方法可以进行盐渍化耕地的宏观快速调查。分析结果表明:新疆灌区盐渍化耕地面积占新疆灌区耕地总面积的32.07%,近20年来盐渍化耕地所占耕地总面积的比例变化不大。盐渍化耕地大部分市县均有分布,南疆重于北疆。盐渍化耕地主要分布在洪积扇的中下部、河流中下游、地势平缓低洼等区域。新开垦的耕地中,土壤盐渍化现象普遍。
|
| [11] |
Construction of membership functions for predictive soil mapping under fuzzy logic. https://doi.org/10.1016/j.geoderma.2009.05.024 URL [本文引用: 1] 摘要
Fuzzy membership function is an effective tool to represent relationship between soil and environment for predictive soil mapping. Usually construction of a fuzzy membership function requires knowledge on soil-landscape relationships obtained from local soil experts or from extensive field samples. For areas with no soil survey experts and no extensive soil field observations, a purposive sampling approach could provide the descriptive knowledge on the relationships. However, quantifying this descriptive knowledge in the form of fuzzy membership functions for predictive soil mapping is a challenge. This paper presents a method to construct fuzzy membership functions using descriptive knowledge. Construction of fuzzy membership functions is accomplished based on two types of knowledge: 1) knowledge on typical environmental conditions of each soil type and 2) knowledge on how each soil type corresponds to changes in environmental conditions. These two types of knowledge can be extracted from catenary sequences of soil types and the associated environment information collected at a few field samples through purposive sampling. The proposed method was tested in a watershed located in Heshan farm of Nenjiang County in Heilongjiang Province of China. A set of membership functions were constructed to represent the descriptive knowledge on soil-landscape relationships, which were derived from 22 field samples collected through a purposive sampling approach. A soil subgroup map and an A-horizon soil organic matter content map for the area were generated using these membership functions. Forty five field validation points were collected independently to evaluate the two soil maps. The soil subgroup map achieved 76% of accuracy. The A-horizon soil organic matter content map based on the derived fuzzy membership functions was compared with that derived from a multiple linear regression model. The comparison showed that the soil organic content map based on fuzzy membership functions performed better than the soil map based on the linear regression model. The proposed method could also be used to construction membership functions from descriptive knowledge obtained from other sources.
|
| [12] |
Carbon stock and its responses to climate change in https://doi.org/10.1111/gcb.12846 URL PMID: 25626071 [本文引用: 1] 摘要
Central Asia has a land area of 5.6 10(6) km(2) and contains 80-90% of the world's temperate deserts. Yet it is one of the least characterized areas in the estimation of the global carbon (C) stock/balance. This study assessed the sizes and spatiotemporal patterns of C pools in Central Asia using both inventory (based on 353 biomass and 284 soil samples) and process-based modeling approaches. The results showed that the C stock in Central Asia was 31.34-34.16 Pg in the top 1-m soil with another 10.42-11.43 Pg stored in deep soil (1-3 m) of the temperate deserts. They amounted to 18-24% of the global C stock in deserts and dry shrublands. The C stock was comparable to that of the neighboring regions in Eurasia or major drylands around the world (e.g. Australia). However, 90% of Central Asia C pool was stored in soil, and the fraction was much higher than in other regions. Compared to hot deserts of the world, the temperate deserts in Central Asia had relatively high soil organic carbon density. The C stock in Central Asia is under threat from dramatic climate change. During a decadal drought between 1998 and 2008, which was possibly related to protracted La Ni a episodes, the dryland lost approximately 0.46 Pg C from 1979 to 2011. The largest C losses were found in northern Kazakhstan, where annual precipitation declined at a rate of 90 mm decade(-1) . The regional C dynamics were mainly determined by changes in the vegetation C pool, and the SOC pool was stable due to the balance between reduced plant-derived C influx and inhibited respiration.
|
| [13] |
The oasis expansion and eco-environment change over the last 50 years in Manas River Valley, Xinjiang. https://doi.org/10.1007/s11430-004-5348-1 URL [本文引用: 1] 摘要
Ecology; Farms; Land use; Modernization; Remote sensing; Surface topography; Sustainable development
|
| [14] |
由中国科学院新疆生态与地理研究所和新疆维吾尔自治区水利厅农牧水利处联合编著的《新疆灌区土壤盐渍化及改良治理模式》一书由新疆科学技术出版社出版。
由中国科学院新疆生态与地理研究所和新疆维吾尔自治区水利厅农牧水利处联合编著的《新疆灌区土壤盐渍化及改良治理模式》一书由新疆科学技术出版社出版。
|
| [15] |
On digital soil mapping. https://doi.org/10.1016/S0016-7061(03)00223-4 URL [本文引用: 2] 摘要
Finally, possible applications, problems and improvements are discussed.
|
| [16] |
Land changes monitoring using MODIS time-series imagery in peat lands areas, Muaro Jambi, Jambi Province, Indonesia. https://doi.org/10.1016/j.proenv.2016.03.095 URL [本文引用: 1] 摘要
Function of peat land as the global climate regulator has been threatened by human activities through deforestation and forest degradation, including the peat lands in the Berbak National Park, Muaro Jambi. This area is covered by 110,000 hectares of peat lands. This study aimed to monitor the land changes using MODIS time-series datasets from 2001 to 2013. The study used the Normalized Difference Water Index (NDWI), which describes vegetation water content associated with rainfall. The results show that NDWI is quite sensitive to represent the changes in peat land, including seasonal changes. Most of the land changes was detected in August-October by the method. In many cases, it was necessarily coincident with the low rainfall and hotspot occurrences. Moreover, the land changes in peat land areas represent the temporal complexity affected by extreme climate variability, when it related with a high number of fires.
|
| [17] |
Regional-scale assessment of soil salinity in the Red River Valley using multi-year MODIS EVI and NDVI. |
| [18] |
Construction of membership functions for predictive soil mapping under fuzzy logic. https://doi.org/10.1016/j.geoderma.2009.05.024 URL [本文引用: 3] 摘要
Fuzzy membership function is an effective tool to represent relationship between soil and environment for predictive soil mapping. Usually construction of a fuzzy membership function requires knowledge on soil-landscape relationships obtained from local soil experts or from extensive field samples. For areas with no soil survey experts and no extensive soil field observations, a purposive sampling approach could provide the descriptive knowledge on the relationships. However, quantifying this descriptive knowledge in the form of fuzzy membership functions for predictive soil mapping is a challenge. This paper presents a method to construct fuzzy membership functions using descriptive knowledge. Construction of fuzzy membership functions is accomplished based on two types of knowledge: 1) knowledge on typical environmental conditions of each soil type and 2) knowledge on how each soil type corresponds to changes in environmental conditions. These two types of knowledge can be extracted from catenary sequences of soil types and the associated environment information collected at a few field samples through purposive sampling. The proposed method was tested in a watershed located in Heshan farm of Nenjiang County in Heilongjiang Province of China. A set of membership functions were constructed to represent the descriptive knowledge on soil-landscape relationships, which were derived from 22 field samples collected through a purposive sampling approach. A soil subgroup map and an A-horizon soil organic matter content map for the area were generated using these membership functions. Forty five field validation points were collected independently to evaluate the two soil maps. The soil subgroup map achieved 76% of accuracy. The A-horizon soil organic matter content map based on the derived fuzzy membership functions was compared with that derived from a multiple linear regression model. The comparison showed that the soil organic content map based on fuzzy membership functions performed better than the soil map based on the linear regression model. The proposed method could also be used to construction membership functions from descriptive knowledge obtained from other sources.
|
| [19] |
The effects of DEM resolution and neighborhood size on digital soil survey. https://doi.org/10.1016/j.geoderma.2006.07.002 URL [本文引用: 1] 摘要
Terrain characteristics, such as slope gradient, slope aspect, profile curvature, contour curvature computed from digital elevation model (DEM), are among the key inputs to digital soil surveys based on geographic information systems (GIS). These terrain attributes are computed over a neighborhood (spatial extent). The objective of this research was to investigate the combined effect of DEM resolution and neighborhood size on digital soil surveys using the Soil-Landscape Inference Model (SoLIM) approach. The effect of neighborhood size and DEM resolution on digital soil survey was examined through computing the required terrain attributes using different neighborhood sizes (from 3 to 54 m) for 3, 6, 9, 12, 18, and 27 m resolution DEM. These attributes were then compiled and used to digitally map soils using the SoLIM approach. Field work completed on a hillslope in Dane County, WI in the summer of 2003 was used to validate each of the SoLIM derived soil surveys for accuracy. The results of the soil survey validations suggest that there is a range of neighborhood sizes that produces the most accurate results for a given resolution DEM. This range of neighborhood sizes, however, varies from landscape to landscape. When the soils on a gently rolling landscape were mapped, the neighborhood sizes that produced the most accurate results ranged from about 33-48 m. When soils on short, steep backslope positions were mapped, the neighborhood size values that produced the most accurate results range from about 24-36 m. This paper also shows that it is not always the highest resolution DEM that produces the highest accuracy. Knowing which DEM resolution and neighborhood size combinations produce the most accurate digital soil surveys for a particular landscape will be extremely useful to users of GIS-based soil-mapping applications.
|
| [20] |
The treatment of flat areas and depressions in automated drainage analysis of raster digital elevation models. https://doi.org/10.1002/(SICI)1099-1085(199805)12:63.0.CO;2-R URL [本文引用: 1] 摘要
Methods developed to process raster digital elevation models (DEM) automatically in order to delineate and measure the properties of drainage networks and drainage basins are being recognized as potentially valuable tools for the topographic parameterization of hydrological models. All of these methods ultimately rely on some form of overland flow simulation to define drainage courses and catchment areas and, therefore, have difficulty dealing with closed depressions and flat areas on digital land surface models. Some fundamental assumptions about the nature of these problem topographic features in DEM are implicit in the various techniques developed to deal with them in automated drainage analysis. The principal assumptions are: (1) that closed depressions and flat areas are spurious features that arise from data errors and limitations of DEM resolution; (2) that flow directions across flat areas are determined solely by adjacent cells of lower elevation; and (3) that closed depressions are caused exclusively by the underestimation of DEM elevations. It is argued that while the first of these assumptions is reasonable, given the quality of DEMs generally available for hydrological analysis, the others are not. Rather it seems more likely that depressions are caused by both under-and overestimation errors and that flow directions across flat areas are determined by the distribution of both higher and lower elevations surrounding flat areas. Two new algorithms are introduced that are based on more reasonable assumptions about the nature of flat areas and depressions, and produce more realistic results in application. These algorithms allow breaching of depression outlets and consider the distribution of both higher and lower elevations in assigning flow directions on flat areas. The results of applying these algorithms to some real and hypothetical landscapes are presented.
|
| [21] |
A soil particle-size distribution dataset for regional land and climate modelling in China. https://doi.org/10.1016/j.geoderma.2011.01.013 URL [本文引用: 1] 摘要
Abstract We developed a multi-layer soil particle-size distribution dataset (sand, silt and clay content), based on USDA (United States Department of Agriculture) standard for regional land and climate modelling in China. The 1:1,000,000 scale soil map of China and 8595 soil profiles from the Second National Soil Survey served as the starting point for this work. We reclassified the inconsistent soil profiles into the proper soil type of the map as much as possible because the soil classification names of the map units and profiles were not quite the same. The sand, silt and clay maps were derived using the polygon linkage method, which linked soil profiles and map polygons considering the distance between them, the sample sizes of the profiles, and soil classification information. For comparison, a soil type linkage was also generated by linking the map units and soil profiles with the same soil type. The quality of the derived soil fractions was reliable. Overall, the map polygon linkage offered better results than the soil type linkage or the Harmonized World Soil Database. The dataset, with a 1-km resolution, can be applied to land and climate modelling at a regional scale.Research Highlights78 The polygon linkage method was developed to derive soil PSD map. 78 A representative value was given for each soil polygon instead of map unit. 78 Distance, profile ample sizes and soil classification were considered. 78 Soil polygon linkage offered better results than type linkage or HWSD.
|
| [22] |
The spatial distribution patterns of digital geomorphology in Xinjiang. https://doi.org/10.11821/yj2009050002 URL [本文引用: 2] 摘要
以高分辨率遥感影像为本底数据的最新新疆地貌数据,能提高定量化地貌格局分析结果的准确性、客观性和科学性。本文利用地学统计和GIS空间分析方法,基于最新新疆地貌数据,定量化分析了地貌的分布特征、空间格局。结果表明:(1)大地貌单元中,平原地貌约占新疆总面积的1/3;(2)地势分级,中海拔地貌占绝对优势,约占全疆总面积1/2;(3)形态类型中,丘陵地貌在地势起伏中占主导地位,面积最大,主要分布在两大沙漠中,以沙丘形式分布;(4)基本地貌类型,中海拔丘陵最多,占总面积的21.417%;(5)成因类型中,流水、风成和干燥作用占主导地位;(6)受不同形成条件和控制范围的影响,新疆成因类型的分布特征随着海拔和起伏的变化而变化;(7)总体上,新疆地貌的空间格局呈现出两大特征:水平环形特征和垂直地带性特征。
新疆地貌空间分布格局分析 .https://doi.org/10.11821/yj2009050002 URL [本文引用: 2] 摘要
以高分辨率遥感影像为本底数据的最新新疆地貌数据,能提高定量化地貌格局分析结果的准确性、客观性和科学性。本文利用地学统计和GIS空间分析方法,基于最新新疆地貌数据,定量化分析了地貌的分布特征、空间格局。结果表明:(1)大地貌单元中,平原地貌约占新疆总面积的1/3;(2)地势分级,中海拔地貌占绝对优势,约占全疆总面积1/2;(3)形态类型中,丘陵地貌在地势起伏中占主导地位,面积最大,主要分布在两大沙漠中,以沙丘形式分布;(4)基本地貌类型,中海拔丘陵最多,占总面积的21.417%;(5)成因类型中,流水、风成和干燥作用占主导地位;(6)受不同形成条件和控制范围的影响,新疆成因类型的分布特征随着海拔和起伏的变化而变化;(7)总体上,新疆地貌的空间格局呈现出两大特征:水平环形特征和垂直地带性特征。
|
| [23] |
Soil texture mapping over low relief areas using land surface feedback dynamic patterns extracted from MODIS. |
| [24] |
Toward remote sensing methods for land cover dynamic monitoring: Application to Morocco. https://doi.org/10.1080/014311600210876 URL 摘要
Abstract An extensive remotely sensed dataset recently available to the scientific community, The Global Land 1-km AVHRR Project, has been used to examine the possibilities of multi-temporal imagery for mapping and monitoring changes in the biophysical characteristics of land cover. Our goal was to investigate the regional response of the soil-vegetation system to climate in arid zones. We addressed this problemby applying theoretical models to obtain parameters such as Land Surface Temperature (LST) and Normalized Difference Vegetation Index (NDVI) from satellite data and by analysing the spatial-temporal dynamics of these parameters. Morocco was selected as the area of study due to its high environmental diversity. This area is also clearly affected by the risk of the advance of the desert. Using The Global Land 1-km AVHRR Project dataset, two methodologies are proposed for the monitoring of land cover dynamics in different areas of interest defined using as mapping criteria the Annual Average of NDVI (AANDVI): (1) The Method of the Area of the Triangle (MAT), based on a form described by the annual evolution of LST and NDVI in each area; (2) the Method of the Slope, which analyses the slope of the line defined by the months of the maximum NDVI and the minimum LST.
|
| [25] |
Evaluating NDVI-based emissivities of MODIS bands 31 and 32 using emissivities derived by Day/Night LST algorithm. https://doi.org/10.1016/j.rse.2006.08.005 URL [本文引用: 1] 摘要
Surface emissivity estimation is a significant factor for the land surface temperature estimation from remotely sensed data. For fully vegetated surfaces, the emissivity estimation is performed in a simple manner since the emissivity is relatively uniform. However, for arid land with sparse vegetation, the estimation is more complicated since the emissivity of the exposed soil and rock is highly variable. In this study, mean and difference emissivity for bands 31 and 32 of MODIS sensor have been derived based on NDVI values. First, the NDVI thresholds have been determined to separate bare soil, partially vegetated soil and fully vegetated land. Then regression relations have been derived to estimate mean and difference emissivity of the bare soil samples and partially vegetated surfaces. A constant emissivity is also used for fully vegetated area. Along with the correlations, standard deviations of the regression relations have been examined for a set of representative soil types. Standard deviations smaller than 0.003 in mean emissivity and smaller than 0.004 in difference emissivity are resulted in regression linear relations. Evaluation of the NDVI derived regression relations has been performed using the results of MODIS Day/Night Land Surface Temperature (LST) algorithm on a pair of MODIS images. Using around 45,500 pixels with different soil and land cover types, emissivity of each pixel in bands 31 and 32 have been estimated. The calculated emissivities have been compared with emissivities calculated by MODIS Day/Night LST algorithm. Biases and standard deviations of NDVI-based relations show relatively high agreement for mean and difference emissivity relations with Day/ Night method results. It may be concluded that the proposed algorithm can be used as a rather simple alternative to complex emissivity estimation algorithms.
|
| [26] |
A soil sampling method based on representativeness grade of sampling points.
采样设计是获取土壤空间分布信息的关键环节,直接影响到土壤制图的精度。目前常用的采样设计方法大多存在着设计样本量大、采样效率不高的问题。当可投入资源难以完成一次性大量采样时,采样往往需要多次、分批进行。然而现有分批采样方法多考虑各批采样点在地理空间的互补性,可能造成样本点在属性空间的重叠,影响采样资源的高效利用。鉴于此,本研究通过对与土壤在空间分布具有协同变化的环境因子进行聚类分析,寻找可代表土壤性状空间分布的不同等级类型的代表性样点,建立一套基于代表性等级的采样设计方法。将该采样方法应用于位于黑龙江省嫩江县鹤山农场的研究区,利用所采集的不同代表性等级的样点进行数字土壤制图并进行验证,探讨采样方案与数字土壤制图精度的关系,以评价本文所提出的采样方法。结果表明,通过代表性等级最高的少量样点可获取研究区的大部分主要土壤类型(中国土壤系统分类的亚类级别),且制图精度较高;随着代表性等级较低样点的加入,土壤图精度提高;但当样点增加到一定数量时,土壤图的精度变化不大。因此,与样点数相比,样点的代表性高低对制图精度的影响更大。该方法所提出的代表性等级可以为样点采集顺序提供参考,有助于设计高效的逐步采样方案。
一种基于样点代表性等级的土壤采样设计方法 .
采样设计是获取土壤空间分布信息的关键环节,直接影响到土壤制图的精度。目前常用的采样设计方法大多存在着设计样本量大、采样效率不高的问题。当可投入资源难以完成一次性大量采样时,采样往往需要多次、分批进行。然而现有分批采样方法多考虑各批采样点在地理空间的互补性,可能造成样本点在属性空间的重叠,影响采样资源的高效利用。鉴于此,本研究通过对与土壤在空间分布具有协同变化的环境因子进行聚类分析,寻找可代表土壤性状空间分布的不同等级类型的代表性样点,建立一套基于代表性等级的采样设计方法。将该采样方法应用于位于黑龙江省嫩江县鹤山农场的研究区,利用所采集的不同代表性等级的样点进行数字土壤制图并进行验证,探讨采样方案与数字土壤制图精度的关系,以评价本文所提出的采样方法。结果表明,通过代表性等级最高的少量样点可获取研究区的大部分主要土壤类型(中国土壤系统分类的亚类级别),且制图精度较高;随着代表性等级较低样点的加入,土壤图精度提高;但当样点增加到一定数量时,土壤图的精度变化不大。因此,与样点数相比,样点的代表性高低对制图精度的影响更大。该方法所提出的代表性等级可以为样点采集顺序提供参考,有助于设计高效的逐步采样方案。
|
| [27] |
Soil mapping using GIS, expert knowledge, and fuzzy logic. |
| [28] |
Extraction of knowledge about soil-environment relationship for soil mapping using fuzzy c-means (FCM) clustering. https://doi.org/10.3321/j.issn:0564-3929.2007.05.003 URL [本文引用: 1] 摘要
在没有土壤普查专家及土壤图的地区,获取土壤环境间关系的知识是基于知识进行预测性土壤制图中的关键问题。本文建立了一套应用模糊c均值聚类(Fuzzyc-means,FCM)获取土壤环境间关系知识的方法:得到对土壤形成发展具有重要作用的环境因子,建立环境因子数据库;对环境因子进行模糊聚类,得到环境因子组合隶属度分布图;根据隶属度值确定野外采样点;将环境因子组合与土壤类型对应,进而提取土壤-环境关系知识。为检验该方法的有效性,应用所得知识进行土壤制图,通过独立采样点对土壤图进行精度评价。本文在黑龙江鹤山农场一个研究区的应用结果表明,该方法仅需要少量的野外采样即可获得有效的土壤-环境关系知识,为预测性土壤制图提供必需的依据,同时也显著提高了野外采样的效率。
应用模糊c均值聚类获取土壤制图所需土壤-环境关系知识的方法研究 .https://doi.org/10.3321/j.issn:0564-3929.2007.05.003 URL [本文引用: 1] 摘要
在没有土壤普查专家及土壤图的地区,获取土壤环境间关系的知识是基于知识进行预测性土壤制图中的关键问题。本文建立了一套应用模糊c均值聚类(Fuzzyc-means,FCM)获取土壤环境间关系知识的方法:得到对土壤形成发展具有重要作用的环境因子,建立环境因子数据库;对环境因子进行模糊聚类,得到环境因子组合隶属度分布图;根据隶属度值确定野外采样点;将环境因子组合与土壤类型对应,进而提取土壤-环境关系知识。为检验该方法的有效性,应用所得知识进行土壤制图,通过独立采样点对土壤图进行精度评价。本文在黑龙江鹤山农场一个研究区的应用结果表明,该方法仅需要少量的野外采样即可获得有效的土壤-环境关系知识,为预测性土壤制图提供必需的依据,同时也显著提高了野外采样的效率。
|
| [29] |
A similarity model for representing soil spatial information. https://doi.org/10.1016/S0016-7061(97)00023-2 URL [本文引用: 1] 摘要
A fuzzy logic based model (called a similarity model) was developed to represent soil spatial information so that soil landscape is perceived as a continuum in both the parameter space and the geographic space. The similarity model consists of two components: the similarity representation component and a raster representation scheme. The similarity representation component uses a set of prescribed soil taxonomic categories as the central concepts of the fuzzy soil classes and represents a soil at a given location as a set of similarity values to these central concepts. The collection of these similarity values forms an n-element vector called a soil similarity vector. With the use of a raster representation scheme, soil spatial information over an area can be represented as an array of soil similarity vectors. This similarity model has two main advantages for representing spatial soil information over conventional polygon-based soil maps. Firstly, the details of soil spatial information can be represented at the resolution of a raster data model rather than at the minimal mapping sizes as in conventional polygon-based soil maps. secondly, under the similarity representation, the deviation of a soil at a given location from typical soil classes can be preserved and its properties can then take values intermediate to the typical values of the prescribed soil types. A case study conducted in the Lubrecht Experiment Forest of western Montana demonstrated that soil spatial information represented under the similarity model has a higher resolution at both the attribute level and the spatial level than that in the conventional soil map of the area.
|
| [30] |
Quantitative analysis of salt-affected soil reflectance spectra: A comparison of two adaptive methods (PLSR and ANN). https://doi.org/10.1016/j.rse.2007.02.005 URL [本文引用: 1] 摘要
The results of this study show that both methods have a great potential for estimating and mapping soil salinity. Performance indexes from both methods suggest large similarity between the two approaches with PLSR advantages. This indicates that the relation between soil salinity and soil reflectance can be approximated by a linear function.
|
| [31] |
Causes and spatial-temporal changes of soil salinization in Weigan River Basin, Xinjiang. https://doi.org/10.11820/dlkxjz.2012.07.009 URL [本文引用: 1] 摘要
以1985年渭干河流域土壤普查数据、1998年Landsat TM影像和2008年CBERS影像为数据源,通过人机交互解译方式获取3个时期土壤盐渍化分布状况,然后采用GIS空间分析方法对23年来土壤盐渍化时空变化特征进行分析。结果表明:①1985-2008年,总趋势是随着流域灌区和耕地面积的扩大,盐渍化耕地也随之增加,土壤盐渍化耕地面积由13.32×10⁴hm2增至13.78×10⁴hm2。②流域土壤盐渍化现象普遍,主要分布在绿洲的下部边缘地带,河流中下游、地势平缓低洼等区域,盐渍化耕地在绿洲内部呈条形状分布,在绿洲外围呈片状分布。③河道、渠系和水库渗漏、耕作制度不合理、土地不平整和气候变化等多种因素导致渭干河流域土壤盐渍化扩大,但在局部地区由于生态恢复和改良利用措施,使得土壤盐渍化面积也有缩减。
新疆渭干河流域土壤盐渍化时空变化及成因分析 .https://doi.org/10.11820/dlkxjz.2012.07.009 URL [本文引用: 1] 摘要
以1985年渭干河流域土壤普查数据、1998年Landsat TM影像和2008年CBERS影像为数据源,通过人机交互解译方式获取3个时期土壤盐渍化分布状况,然后采用GIS空间分析方法对23年来土壤盐渍化时空变化特征进行分析。结果表明:①1985-2008年,总趋势是随着流域灌区和耕地面积的扩大,盐渍化耕地也随之增加,土壤盐渍化耕地面积由13.32×10⁴hm2增至13.78×10⁴hm2。②流域土壤盐渍化现象普遍,主要分布在绿洲的下部边缘地带,河流中下游、地势平缓低洼等区域,盐渍化耕地在绿洲内部呈条形状分布,在绿洲外围呈片状分布。③河道、渠系和水库渗漏、耕作制度不合理、土地不平整和气候变化等多种因素导致渭干河流域土壤盐渍化扩大,但在局部地区由于生态恢复和改良利用措施,使得土壤盐渍化面积也有缩减。
|
| [32] |
Improved remote sensing detection of soil salinity from a semi-arid climate in Northeast Brazil. https://doi.org/10.1016/j.crte.2011.09.003 URL [本文引用: 3] 摘要
Remote sensing techniques are being increasingly applied to investigate soil characteristics. Here we propose an approach that allows the detection of salt-affected soils in arid and semi-arid environments. We test the procedure in Northeast Brazil through a combination of remote sensing and geochemical ground-based measurements. Spectral indices were used to characterize soil salinization features and patterns. The Linear Spectral Unmixing technique (LSU) is applied in this study to improve the prediction of soil salinity. Eighteen indices were extracted from the MODIS Terra data. A moderate correlation was found between electrical conductivity and the spectral indices. An improvement occurs in most of the correlations after applying the LSU method. To generate a predicted salinity map, a multiple linear regression, based on the best correlated indices is conducted. The standard error of the estimate is about 12.1cm.
|
| [33] |
Identifying optimal spectral bands to assess soil properties with VNIR radiometry in semi-arid soils. https://doi.org/10.1016/j.geoderma.2008.08.004 URL [本文引用: 2] 摘要
Mediterranean soils are critically endangered by natural and human induced degradation processes. Rapid and cost effective techniques for in situ diagnosis of soil properties are highly valuable for soil assessment and management studies. The combined use of remote sensing techniques and Geographic Information Systems (GIS) has introduced a new era for soil resources assessment and monitoring. This work deals with soils in SE Spain and explores the use of spectral derivative analysis to predict several soil properties using field based visible-near infrared (VNIR) spectroradiometry. Robust regression models were obtained for electric conductivity (E.C.), carbonates, soil organic matter (SOM) and sand content with the first and/or second derivative approximation. Future research stages will include evaluating the technique presented in this paper for other semi-arid soils and scaling-up field based regression model predictions for soil properties to the resolution of satellite remote sensors.
|
| [34] |
Remote sensing of soil salinity: Potentials and constraints. https://doi.org/10.1016/S0034-4257(02)00188-8 URL [本文引用: 3] 摘要
ABSTRACT Soil salinity caused by natural or human-induced processes is a major environmental hazard. The global extent of primary salt-affected soils is about 955 M ha, while secondary salinization affects some 77 M ha, with 58% of these in irrigated areas. Nearly 20% of all irrigated land is salt-affected, and this proportion tends to increase in spite of considerable efforts dedicated to land reclamation. This requires careful monitoring of the soil salinity status and variation to curb degradation trends, and secure sustainable land use and management. Multitemporal optical and microwave remote sensing can significantly contribute to detecting temporal changes of salt-related surface features. Airborne geophysics and ground-based electromagnetic induction meters, combined with ground data, have shown potential for mapping depth of salinity occurrence. This paper reviews various sensors (e.g. aerial photographs, satellite- and airborne multispectral sensors, microwave sensors, video imagery, airborne geophysics, hyperspectral sensors, and electromagnetic induction meters) and approaches used for remote identification and mapping of salt-affected areas. Constraints on the use of remote sensing data for mapping salt-affected areas are shown related to the spectral behaviour of salt types, spatial distribution of salts on the terrain surface, temporal changes on salinity, interference of vegetation, and spectral confusions with other terrain surfaces.As raw remote sensing data need substantial transformation for proper feature recognition and mapping, techniques such as spectral unmixing, maximum likelihood classification, fuzzy classification, band ratioing, principal components analysis, and correlation equations are discussed. Lastly, the paper presents modelling of temporal and spatial changes of salinity using combined approaches that incorporate different data fusion and data integration techniques.
|
| [35] |
Spectral reflectance properties of major objects in desert oasis: A case study of the Weigan-Kuqa river delta oasis in Xinjiang, China. https://doi.org/10.1007/s10661-011-2326-x URL PMID: 21922179 [本文引用: 1] 摘要
Abstract Aiming at the remote sensing application has been increasingly relying on ground object spectral characteristics. In order to further research the spectral reflectance characteristics in arid area, this study was performed in the typical delta oasis of Weigan and Kuqa rivers located north of Tarim Basin. Data were collected from geo-targets at multiple sites in various field conditions. The spectra data were collected for different soil types including saline-alkaline soil, silt sandy soil, cotton field, and others; vegetations of Alhagi sparsifolia, Phragmites australis, Tamarix, Halostachys caspica, etc., and water bodies. Next, the data were processed to remove high-frequency noise, and the spectral curves were smoothed with the moving average method. The derivative spectrum was generated after eliminating environmental background noise so that to distinguish the original overlap spectra. After continuum removal of the undesirable absorbance, the spectrum curves were able to highlight features for both optical absorbance and reflectance. The spectrum information of each ground object is essential for fully utilizing the multispectrum data generated by remote sensing, which will need a representative spectral library. In this study using ENVI 4.5 software, a preliminary spectral library of surface features was constructed using the data surveyed in the study area. This library can support remote sensing activities such as feature investigation, vegetation classification, and environmental monitoring in the delta oasis region. Future plan will focus on sharing and standardizing the criteria of professional spectral library and to expand and promote the utilization of the spectral databases.
|
| [36] |
Detecting soil salinity with arid fraction integrated index and salinity index in feature space using Landsat TM imagery. https://doi.org/10.1007/s40333-013-0183-x URL [本文引用: 1] 摘要
Modeling soil salinity in an arid salt-affected ecosystem is a difficult task when using remote sensing data because of the complicated soil context(vegetation cover,moisture,surface roughness,and organic matter)and the weak spectral features of salinized soil.Therefore,an index such as the salinity index(SI)that only uses soil spectra may not detect soil salinity effectively and quantitatively.The use of vegetation reflectance as an indirect indicator can avoid limitations associated with the direct use of soil reflectance.The normalized difference vegetation index(NDVI),as the most common vegetation index,was found to be responsive to salinity but may not be available for retrieving sparse vegetation due to its sensitivity to background soil in arid areas.Therefore,the arid fraction integrated index(AFII)was created as supported by the spectral mixture analysis(SMA),which is more appropriate for analyzing variations in vegetation cover(particularly halophytes)than NDVI in the study area.Using soil and vegetation separately for detecting salinity perhaps is not feasible.Then,we developed a new and operational model,the soil salinity detecting model(SDM)that combines AFII and SI to quantitatively estimate the salt content in the surface soil.SDMs,including SDM1 and SDM2,were constructed through analyzing the spatial characteristics of soils with different salinization degree by integrating AFII and SI using a scatterplot.The SDMs were then compared to the combined spectral response index(COSRI)from field measurements with respect to the soil salt content.The results indicate that the SDM values are highly correlated with soil salinity,in contrast to the performance of COSRI.Strong exponential relationships were observed between soil salinity and SDMs(R20.86,RMSE6.86)compared to COSRI(R2=0.71,RMSE=16.21).These results suggest that the feature space related to biophysical properties combined with AFII and SI can effectively provide information on soil salinity.
|
| [37] |
Soil-landscape modelling to quantify spatial variability of soil texture. Physics and Chemistry of the Earth, Part B: Hydrology, https://doi.org/10.1016/S1464-1909(01)85012-7 URL [本文引用: 1] 摘要
Soil-landscape models were developed to predict the spatial distribution of soil texture at the surface horizon across a catchment in southeastern Nigeria. A discretised thin-plate spline technique, in conjunction with a connected drainage-enforcement algorithm supplemented with the incorporation of ridge and stream-line data, was used to ensure proper hydrogeomorphic properties of the output Digital Elevation Model (DEM). Terrain attributes were derived from the resulting DEM. Stepwise multiple-linear regression was performed on the normalised terrain attributes and on the principal components constructed from the normalised terrain attributes to avoid multi-collinearity. The derived soil-landscape models were used to predict clay, silt, sand, ironstone and thickness of the surface horizon from the original terrain attributes for the entire study area (R=0.41 to 0.75). The models were further validated using statistical criteria. Only for the soil variable clay did the soil-landscape model improve after stratification according to geological formation (Rincreased from 0.47 to 0.76). Cell-based algorithms were used to map the soil-landscape models spatially. The resulting spatial patterns correctly showed a significant relationship with the terrain attributes. This relationship is useful when studying patterns of sediment movement.
|
| [38] |
Fuzzy classification of JERS-1 SAR data: An evaluation of its performance for soil salinity mapping. https://doi.org/10.1016/S0304-3800(98)00095-7 URL [本文引用: 1] 摘要
ABSTRACT Remote sensing of surface features has been used intensively to identify and map salt-affected areas. Salt-tolerant vegetation is among the indicators used to separate saline-alkaline areas from non-affected ones. However, this type of vegetation causes spectral confusion and erroneous labelling between salinity and alkalinity classes when working with optical sensors such as Landstat TM or Spot. Accordingly, this paper evaluates the capabilities of the microwave range to map saline and alkaline areas. Fuzzy sets are used to model the information classes, and a fuzzy overlay model is implemented to classify the JERS-1 radar satellite image. The study shows that fuzzy classification of JERS-1 SAR data provides reliable detection (overall accuracy equal to 81%) of areas degraded by salinity-alkalinity processes. The main problems appear to be due to the interaction between soil roughness and radar backscattering, which determined erroneous allocation of alkaline and saline-alkaline areas to non-affected areas.
|
| [39] |
Electrical conductivity of some soils in Trinidad as affected by density, water and peat content. https://doi.org/10.1016/j.biosystemseng.2010.11.002 Magsci [本文引用: 1] 摘要
The apparent bulk electrical conductivity (sigma(a)) of eleven soils from Trinidad tropic region was measured in the field and the laboratory with a portable Field Scout soil water content/electrical conductivity probe. The effect on sigma(a) of compacting three of the soils (a sandy loam, clay loam and clay) to three or four bulk densities (1.1, 1.3 and 1.5 and 1.7 t m(-3)), each with four levels of peat (0, 4%, 8%, and 12% by mass) at four gravimetric water contents (5, 12, 19 and 26%) was further investigated in the laboratory. The sigma(a) measured in the field ranged from 0.09 to 0.75 dS m(-1) and was within 0.05 dS m(-1) of the corresponding laboratory-measured values for the individual soils. Electrical conductivity of the laboratory-compacted soils, which ranged from 0 to 0.66 dS m(-1), increased with increasing bulk density, water and peat contents. The clay soil exhibited greater values of sigma(a) than the clay loam or sandy loam soils, at given values of bulk density, water and peat contents. Good agreement was found between the field and laboratory measurements of sigma(a) as well as electrical conductivity of the saturated water extracts from individual soils. Apparent bulk electrical conductivity was significantly affected by the interaction between soil type and water content, and between peat content and water content. A multiple linear regression equation was developed from experimental data to determine the relative importance of the experimental parameters on sigma(a). (C) 2010 IAgrE. Published by Elsevier Ltd. All rights reserved.
|
| [40] |
Study of Yardang Lut Desert based on image processing. Academic Research,
Lut Desert as one of the most important and rare features has attracted much attension from the view point of its high surface temperature. Due to harsh climatic conditions of Lut Desert, not much information about air and surface temperature in Yardang is available. To study the surface temperature in Lut Desert, a good underestanding of Desert conditions can be usefull. Therefore in this study, it was attempted to study air and surface temprature in the three features of marl, grey sand as well as normal sand in "8 time intervals from 6.0 AM to 8.0 PM for a duration of 15 days. Obtained results have revealed the differences in surface temperatures during the day. The obtained results also showed the importance of thermal sensor selection in view point of. satellite overpass time. From the obtained results it was also concluded that the thermal radiation increases from west to east and from north west to south east. The peaks and valleys of the thermal band curve indicate the ,ridges mid furrows, sand dunes and shaddows of ridges. Further research is necessary for more detailed information. The results show that there are differences between the recorded temperatures from 6.0 AM to 8.0 AM and from 4.0 PM to 8.0 PM. Therefore it may be concluded that for thermal image interpretation, the time of satellite overpass is very important to be considered. Further researches are necessary for preparing thermal map based upon field studies in which thermal properties of materials are put into consideration.
|
| [41] |
Arid land salinization detected by remotely-sensed landcover changes: A case study in the Siwa region, NW Egypt. https://doi.org/10.1016/j.jaridenv.2005.10.011 URL [本文引用: 1] 摘要
Abstract Siwa region, located in the north Western Desert of Egypt, has been recently subjected to severe soil salinity problems. Monitoring and analysis of the recent landcover dynamics through the integration of remote sensing and GIS could provide base information for documenting salinity change trends and for anticipating further degradation where the absence of long-term salinity records is an obstacle. Three Landsat TM/ETM+ satellite images taken over a span of 16 years (1987鈥2003) coupled with a 30-m DEM and field observations served as the basic sources of data. Standard image enhancements, classifications, and change detection techniques were applied to determine changes between the available images. Changes were analysed in conjunction with the land surface characteristics, such as slope, radiometric thermal temperature, vegetation indices, and tasselled cap transformations. Such analyses enabled the characterization of alterations in vegetation cover and provided evidence for locating possible future changes due to soil salinity. The results confirmed an acceleration in the rate of soil salinization and vegetation death after the year 2000. Further, this was found to be related to the relative climate warming and the improper drainage systems set up after the year 2000 in addition to the absence of an effective water resource management plan. Recommendations and measures that may prevent or ameliorate the exacerbation of these problems are proposed.
|
| [42] |
Satellite-based monitoring of decadal soil salinization and climate effects in a semi-arid region of China. https://doi.org/10.1007/s00376-012-1150-8 Magsci [本文引用: 1] 摘要
Soil salinization is a common phenomenon that affects both the environment and the socio-economy in arid and semi-arid regions; it is also an important aspect of land cover change. In this study, we integrated multi-sensor remote sensing data with a field survey to analyze processes of soil salinization in a semi-arid area in China from 1979 to 2009. Generally, the area of salt-affected soils increased by 0.28% per year with remarkable acceleration from 1999 to 2009 (0.42% increase per year). In contrast, the area of surface water bodies showed a decreasing trend (-0.08% per year) in the same period. Decreases in precipitation and increases in aridity due to annual (especially summer) warming provided a favorable condition for soil salinization. The relatively flat terrain favored waterlogging at the surface, and continuous drought facilitated upward movement of soil water and accumulation of surface saline and calcium. Meanwhile, land-use practices also played a crucial role in accelerating soil salinization. The conversion to cropland from natural vegetation greatly increased the demand for groundwater irrigation and aggravated the process of soil salinization. Furthermore, there are potential feedbacks of soil salinization to regional climate. The salinization of soils can limit the efficiency of plant water use as well as photosynthesis; therefore, it reduces the amount of carbon sequestrated by terrestrial ecosystem. Soil salinization also reduces the absorbed solar radiation by increasing land surface albedo. Such conversions of land cover significantly change the energy and water balance between land and atmosphere.
|
| [43] |
A simple interpretation of the surface temperature/vegetation index space for assessment of surface moisture status. https://doi.org/10.1016/S0034-4257(01)00274-7 URL [本文引用: 1] 摘要
ABSTRACT A simplified land surface dryness index (Temperature鈥揤egetation Dryness Index, TVDI) based on an empirical parameterisation of the relationship between surface temperature (Ts) and vegetation index (NDVI) is suggested. The index is related to soil moisture and, in comparison to existing interpretations of the Ts/NDVI space, the index is conceptually and computationally straightforward. It is based on satellite derived information only, and the potential for operational application of the index is therefore large. The spatial pattern and temporal evolution in TVDI has been analysed using 37 NOAA-AVHRR images from 1990 covering part of the Ferlo region of northern, semiarid Senegal in West Africa. The spatial pattern in TVDI has been compared with simulations of soil moisture from a distributed hydrological model based on the MIKE SHE code. The spatial variation in TVDI reflects the variation in moisture on a finer scale than can be derived from the hydrological model in this case.
|
| [44] |
Hyperspectral reflectance response of freshwater macrophytes to salinity in a brackish subtropical marsh. https://doi.org/10.2134/jeq2005.0327 URL PMID: 17412913 [本文引用: 1] 摘要
Abstract Coastal freshwater wetlands are threatened by increased salinity due to relative sea level rise and reduced freshwater inputs. Remote radiometric measurement of freshwater marsh canopies to detect small shifts in water column salinity would be useful for assessing salinity encroachment. We measured leaf hyperspectral (300-1100 nm) reflectance of freshwater macrophytes (cattail, Typha latifolia and sea oxeye, Borrichia frutescens) in a field study in a subtropical brackish (2.5-4.5 parts per thousand salinity, per thousand) marsh to determine salinity effects on visible and near-infrared spectral band reflectance and to identify reflectance indices sensitive to small (1 per thousand) changes in wetland salinity. For sea oxeye, floating-position water band index [fWBI = R(900)/minimum(R(930) - R(980)), where R(lambda) = reflectance at band lambda], normalized difference vegetation index [NDVI = (R(774) - R(681))/(R(774) + R(681))], and a proposed wetland salinity reflectance ratio (WSRR = R(990)/R(933)) were sensitive to salinity with R2 of 40, 35, and 65%, respectively (p < 0.01). For cattail, NDVI and photochemical reflectance index [PRI = (R(531) - R(570))/(R(570) + R(531))] were sensitive to salinity with R2 of 29 and 33%, respectively (p <or= 0.01). Higher salinity significantly reduced mean reflectance of sea oxeye in 328- to 527-nm and 600- to 700-nm wavebands (p < 0.05), which corresponded to chlorophyll bands. Reflectance of cattail was not significantly affected by the highest salinity, although the spectral band most affected was 670 nm (p < 0.10), which is a chlorophyll a band. Our findings indicate that hyperspectral radiometry can detect the response of emergent freshwater plants to changes in wetland salinity, which would help with monitoring salinity effects on coastal wetlands.
|

/
| 〈 |
|
〉 |
