王振波 , 方创琳, 许光
WANG Zhenbo, FANG Chuanglin, XU Guang
通讯作者:
收稿日期: 2015-04-16
修回日期: 2015-05-16
网络出版日期: 2015-11-20
版权声明: 2015 《地理学报》编辑部 本文是开放获取期刊文献,在以下情况下可以自由使用:学术研究、学术交流、科研教学等,但不允许用于商业目的.
基金资助:
作者简介:
作者简介:王振波(1980-), 男, 山东禹城人, 博士, 助理研究员, 中国地理学会会员(S110007159A), 主要研究方向为城市化与生态环境效应。E-mail:wangzb@igsnrr.ac.cn
展开
摘要
大气霾污染因其对人体健康、生态环境和气候变化的影响而成为全球关注的严重环境问题,PM2.5是中国霾污染频繁的主要原因。过去对国家尺度上PM2.5时空分布的认识主要基于卫星观测,因其反演方法的局限性,卫星资料难以真实反映近地面PM2.5浓度的时空变化规律。本文基于中国2014年190个城市中的945个监测站的PM2.5浓度观测数据,采用空间数据统计模型,揭示了中国PM2.5的时空格局。结果显示,2014年中国城市PM2.5平均浓度61 μg/m3,具有显著的冬秋高、春夏低的“U”型逐月变化规律和周期性U-脉冲型逐日变化规律;中国城市PM2.5浓度呈现显著的空间分异与集聚规律,以及两次南北进退的空间循环周期;胡焕庸线和长江是中国PM2.5浓度高值区和低值区的东西和南北分界线,胡焕庸线以东和长江以北的环渤海城市群、中原城市群、长三角城市群、长江中游城市群和哈长城市群等地区是2014年PM2.5的高污染城市聚集地,京津冀城市群是全年污染核心区;以珠三角为核心的东南沿海地区是稳定的空气质量优良区。
关键词:
Abstract
Haze pollution in China has become a severe environmental problem for people’s daily life as well as their health, among which PM2.5 makes significant contribution to poor air quality. Satellite observations played a leading role in the recognition in the spatio-temporal variation of PM2.5 nationally. However, based on the information and data obtained by satellites, the inversion method has limitations to truly reflect the spatio-temporal variation of PM2.5 concentrations near ground level. Based on the observed PM2.5 concentration data from 945 newly set-up air monitoring sites in 2014, our research reveals the spatio-temporal variations of PM2.5 concentrations in China by using spatial statistical model. The results show that (1) in 2014, the average PM2.5 concentration in China was 61 μg/m3. It had a periodical U-impulse type daily variation as well as a U-shaped monthly variation with a higher level in autumn and winter while a lower one in spring and summer. (2) Concentration of PM2.5 in urban China shows a significant spatial differentiation and clustering pattern with spatial-periodic occurrences in north and south China. (3) The Hu-line (Hu Population Line) and Yangtze River are respectively the east-west and north-south boundaries which separate the high-value zone and the low-value zone of PM2.5 concentrations in China. In 2014, the highly polluted cities by PM2.5 were mainly distributed in the urban agglomerations (Central Henan, Harbin-Changchun, the Bohai Rim Region, the Yangtze River Delta, and the Middle Yangtze River), east of the Hu-line and north of the Yangtze River. The Beijing-Tianjin-Hebei urban agglomeration was the most severely polluted region all the year round. The southeast coastal region centered on the Pearl River Delta had good air quality in a stable manner.
Keywords:
2013年初,中国遭遇有观测记录以来最严重的雾霾天气,罕见的连续高强度大气污染席卷了整个中东部[1],污染最严重的京津冀地区日均细颗粒物PM2.5(Particulate matter with aerodynamic diameter ≤ 2.5 μm)浓度高达500 μg/m3 [2],引发社会的广泛关注。PM2.5浓度的增加不仅降低大气能见度[3]、影响人体健康[4],还通过改变辐射平衡影响气候变化[5]。同时,PM2.5浓度受到排放源强度、地形条件和气象因素的影响,具有显著的时空变异性[6]。因此,了解国家尺度上PM2.5浓度的变化规律不仅有利于认知大气污染的现状,评估其对人体健康和生态环境的影响,还可以为开展针对性的控制措施提供科学参考。
中国PM2.5的研究主要集中在观测条件较好的珠三角[7]、长三角[8]和京津冀地区[9],中国家尺度的研究主要基于卫星观测,如光学厚度(aerosol optical thickness, AOT)[10]。基于AOT数据可以借助线性回归模型揭示PM2.5浓度的空间异质特征[11],但却难以揭示某个区域在不同时间尺度(季节、月、日)变化规律,也难以反映近地面PM2.5浓度的空间分布格局[12]。因此,近地面PM2.5的观测数据更具科学性和准确性。
为了应对霾污染频繁发生的现状,国家环境保护部出台了新的《环境空气质量标准》(GB3095-2012)[13],并根据不同地区的空气污染特征、经济发展水平和环境管理要求逐步推进实施,于2016年在全国实施新标准。重点地区已经在2013年1月1日起按新标准监测和评价空气质量,同时向公众提供空气质量信息服务。2013年全国共在74座城市共建612个PM2.5浓度监测点,2014年1月1日起,中国已有190个城市向社会实时发布共建945个监测点,遍布中国东南沿海和中部、东北地区。国家空气质量监测条件与范围不断增大,为研究PM2.5浓度的时空特征奠定了基础。本文全面收集了2014年全国945个自动空气质量监测子站的PM2.5观测资料,通过多种手段对数据时空分布进行定量分析,以期获得更具代表性的中国PM2.5时空分布规律,为大气污染治理提供科学依据。
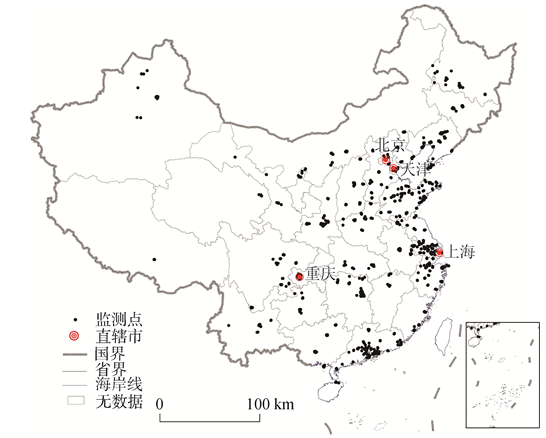
本文的研究区域为中国大陆,PM2.5浓度数据来源于中国环境监测总站的城市空气质量实时发布平台监测数据,样本为2014年中国190个城市的945个监测点PM2.5浓度监测值(图1)。监测点采用Thermo Fisher 1405F观测PM2.5,原理是以恒定的流速将环境空气中的PM2.5进行切割,用滤膜动态测量系统(FDMS)配合微量震荡天平法(TEOM)测量PM2.5的质量浓度[14]。
图1 2014年中国空气质量监测站的空间分布
Fig. 1 Spatial distribution of air quality monitoring sites in China in 2014
根据GB3095-2012针对大气污染物浓度数据有效性的要求,对PM2.5数据进行了质量控制。① 剔除原始数据中小时PM2.5浓度≤ 0的值和缺失的值;② 在计算日均值时,若监测点当天缺测数据超过4小时,则当天数据无效,进行剔除;③ 计算月均值时,若监测点每月缺测天数少于27日,则当月数据无效,进行剔除;④ 计算年均值时,若监测点全年缺测数据少于324日,则监测点全年数据无效,进行剔除;最后,对于小时PM2.5浓度> 900 μg/m3的少数异常也进行了剔除。
因每个城市的监测站点数量不一,本文取城市内部所有站点PM2.5监测浓度24 h平均值代表该城市的PM2.5的污染程度,最终得到2014年全国190个监测城市PM2.5浓度监测有效天数为354天(其中3月29、30、31日,5月25、26日,7月14日,9月27、28、29日,12月27、28日数据缺失或无效,剔除之)。按照GB3095-2012的术语定义,本文中“日平均值”指一个自然日24小时平均浓度的算术平均值,“月平均值”指一个日历月内各日平均浓度的算术平均值,“季平均值”指一个日历季内各日平均浓度的算数平均值,“年平均值”指一个日历年内各日平均浓度的算数平均值[15];春季为3-5月(有效天数为87天),夏季为6-8月(91天),秋季为9-11月(88天),冬季为1、2和12月(88天)。
PM2.5浓度作为一种描述大气状态的标量,在受当地人类活动影响的同时,还受到大气活动混合扩散的影响,类似气温等状态量,存在着显著的空间关联性,即相近地区的PM2.5浓度值在统计上会更加接近。受经济和人力等条件限制,中国环境监测点分布尚不均匀,其中近70%的监测点集中在环渤海、长三角和珠三角三大经济发达区域。通过插值即可了解区域内的完整空间分布。有研究指出,区域层面插值的精度比遥感反演要更加准确[15]。区域尺度要素常用的插值方法有反距离插值(Inverse Distance Weighted, IDW)、克里金插值(Ordinary Kriging Method, OKM),前者估测像元的精度受其到已知点距离的影响较大,对插值点的分散性和均匀性要求较高,非均衡插值点的插值结果波动性较大,连续性较差;后者在生成输出表面的最佳估算方法之前,应对插值点属性的空间行为进行全面计算,得出的结果连续性较好[16]。本文从全国190个监测点中随机抽取13个点作为验证点,采用交叉验证法(cross-validation)对插值的效果进行验证。结果显示,OKM精度均在85%以上,优于IDW,这与潘竟虎等在对全国主要城市的11-12月PM2.5空间分布特征研究中的结论一致[17],说明OKM插值能较科学地反映中国PM2.5的空间分布格局,故选之。
根据地理学第一定律,地理事物或属性在空间分布上互为相关,存在集聚(Clustering)、随机(Random)、规则(Regularity)分布,并且相关性随距离增大而减少[18],该现象称为空间自相关[19-20]。大气活动所具有的空间关联性特征导致相近地区的PM2.5浓度值在统计上会更加接近[21]。空间自相关统计量能够刻画变量在同一个分布区内的观测数据之间潜在的相互依赖性或联系的紧密性[22],常用于分析地理和大气要素空间集聚和变化趋势,为探索要素的时空集聚与演变规律提供依据[23]。在PM2.5研究领域,该模型已经成功用于分析全国重点城市[17]和珠三角[24]等区域的PM2.5空间格局,并得出PM2.5具有显著的空间自相关特性。可见,空间自相关可以解释PM2.5的多尺度时空演变规律,并有效提取其热点区域。
常用全局空间自相关分析和局部空间自相关进行分析。全局Moran指数I的计算公式如下:
式中:
标准化统计量Z检验的计算公式为:
其中:
在0.05的显著水平下,Z(I)>1.96,表示PM2.5浓度空间单元之间存在着正的空间自相关,即相似的高值或低值存在空间聚集;-1.96<Z(I)<1.96,表示PM2.5浓度空间相关性不明显;若Z(I)<-1.96,表示PM2.5空间单元分布存在负相关,属性值趋于分散分布。
局部空间自相关用以确定PM2.5空间聚集的具体位置。局部Moran指数的计算公式为
式中:xi是i的属性;
局部Moran指数检验的标准化统计量为Z(I)。
在0.05的显著水平下,若Z>1.96且该单元与其邻近单元PM2.5浓度均高于平均值,称之为“热区”(hot spot);若Z>1.96且该单元与其邻近单元在该年度的火灾发生率都低于平均值,则为“冷区”(cold spot)。若Z < -1.96则表示存在空间负相关,即高PM2.5浓度单元被低PM2.5浓度单元所环绕的“高—低关联”(High-Low),以及低PM2.5浓度单元被高PM2.5浓度单元环绕的“低—高关联”(Low-High)。当Z = 0时,观测值呈独立的随机分布。一般来讲,Z大于1.96就是显著,大于2.58为极其显著。
利用ArcGIS10.2平台的空间分析模型对PM2.5浓度数据进行空间自相关性验证。从Moran's I来看,2014年12个月的平均Z(I)值为19.86,且均大于2.58,表明中国城市PM2.5全局浓度存在显著的正空间自相关(高高集聚或低低集聚)。Spatial Autocorrelation Model结果中,Gi_Bin字段用于识别统计显著性的热点和冷点。置信区间+3到-3中的要素反映置信度为99%的统计显著性,置信区间+2到-2中的要素反映置信度为95%的统计显著性,置信区间+1到-1中的要素反映置信度为90%的统计显著性;而置信区间0中要素的聚类则没有统计学意义(表1)。
表1 2014年中国主要城市PM2.5浓度空间自相关指数
Tab. 1 Spatial autocorrelation index of PM2.5 concentrations in the major cities of China in 2014
| 月份 | 1 | 2 | 3 | 4 | 5 | 6 | 7 | 8 | 9 | 10 | 11 | 12 |
|---|---|---|---|---|---|---|---|---|---|---|---|---|
| Moran's I | 0.16 | 0.30 | 0.24 | 0.09 | 0.05 | 0.20 | 0.31 | 0.26 | 0.16 | 0.16 | 0.26 | 0.16 |
| Z(I) | 15.94 | 29.85 | 24.03 | 10.78 | 5.59 | 20.66 | 31.10 | 26.11 | 16.18 | 16.16 | 25.94 | 15.92 |
| HH城市数 | 119 | 110 | 123 | 36 | 15 | 126 | 120 | 123 | 70 | 63 | 121 | 124 |
2014年中国190个监测城市PM2.5年均浓度为61 μg/m3,年均浓度最高的10座城市为邢台、保定、石家庄、邯郸、衡水、德州、菏泽、唐山、聊城、廊坊,前8位城市年均值大于100 μg/m3。根据中国最新的环境空气质量标准(GB 3095-2012),环境空气功能区分为二类,一类区为自然保护区、风景名胜区和其他需要特殊保护的区域,PM2.5浓度年均限值和日均限值分别为15 μg/m3和35 μg/m3;二类区为居住区、商业交通居民混合区、文化区、工业区和农村地区,年、日均限值分别为35 μg/m3和75 μg/m3。将全国城市按二类环境功能区统计,2014年仅三亚、海口、拉萨、鄂尔多斯、湛江等17个城市达到年均限值,长沙等139个城市年均浓度位于35~75 μg/m3之间,邢台等34个城市PM2.5年均值高于二类环境功能区的日均限值。
3.1.1 季节变化规律 污染物排放强度和大气扩散条件存在明显的季节变化,相应的,中国城市PM2.5呈现显著的冬高夏低、春秋居中的季节变化规律。中国北方地区冬季燃煤取暖导致全国PM2.5浓度最高,全国平均浓度为84 μg/m3,高值区遍及整个长江以北地区;夏季全国PM2.5平均浓度44 μg/m3;春秋PM2.5均值分别为59 μg/m3和58 μg/m3,其中受西北主导风向和西北地区干旱、植被稀疏等自然条件影响,中国春季PM2.5高值区主要集中在西北地区,如库尔勒春季均值高达134 μg/m3。
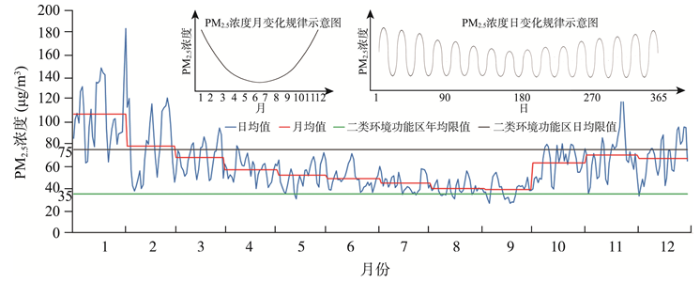
3.1.2 2014年PM2.5月度变化规律 中国城市的月均浓度呈现出“U”形起伏的变化规律。1-5月呈现下降趋势,6-9月基本平稳,略有降低,10-12月呈现上升趋势。其中1月PM2.5浓度最高,为108 μg/m3;二月平均浓度降低为93.82 μg/m3,均在75 μg/m3的标准线以上。9月PM2.5月均浓度最低,为33 μg/m3,在35 μg/m3的标准线以下。3月、10月、11月、12月平均浓度在60~70 μg/m3区间,4-8月平均浓度在39~52 μg/m3区间。所以,4-9月是中国全年空气质量优良时段(图2)。
图2 2014年中国主要城市PM2.5浓度时间变化规律图
Fig. 2 The distribution of the daily and monthly PM2.5 concentration change in the major cities of China in 2014
3.1.3 2014年PM2.5逐日变化规律 中国城市日均浓度变化呈现出周期性脉冲型起伏变化规律。春季和冬季波动周期较短,平均为7日一个周期;夏季和秋季波动周期较长,约为15日一个周期。全年PM2.5日均浓度整体呈现春冬高夏秋低的U形趋势(图2)。2014年日均最高值出现在1月(148 μg/m3),最低值出现在9月(27 μg/m3)。
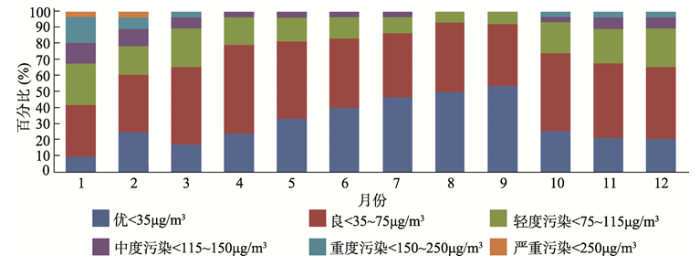
3.1.4 PM2.5超标情况统计 根据环境空气质量指数(AQI)技术规定(试行)(HJ633-2012)[25]定义的中国24 h污染等级划分标准,PM2.5浓度可划分为6个等级,即优(0~35 μg/m3),良(35~75 μg/m3),轻度污染(75~115 μg/m3),中度污染(115~150 μg/m3),重度污染(150~250 μg/m3),严重污染(250~500 μg/m3)。计算全国190个城市日均PM2.5浓度,得出每个城市各污染等级天数的频率。结果显示,2014年190个城市空气质量平均达标天数274天,总体呈现夏季最多、秋春次之,冬季最少的季节规律,夏季空气质量达标率86.84%,秋季和春季分别为76.65%和75.57%,冬季55.51%;从月度来看,6-8月空气达标率均高于80%,其中8月达标率90.32%,全年最高;4、5和10月均在60%~70%之间,2、3、11、12月在50%~60%之间,1月最低为41.94%。反之,污染天数则呈现春冬多,夏秋少的规律,1、2、3、11和12月的污染天数比例均超过30%,重度以上污染天气主要出现在春冬季节,严重污染天气集中在1月和2月(图3)。
图3 2014年中国城市逐月PM2.5污染等级天数比例
Fig. 3 Monthly statistics of the proportion of days covered by PM2.5 pollution in the major cities of China in 2014
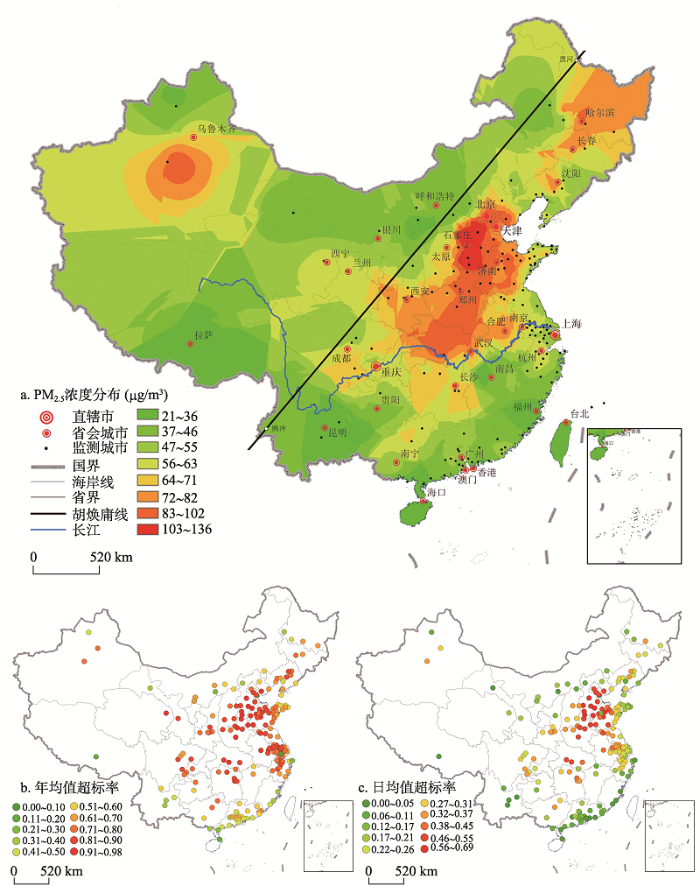
3.2.1 2014年PM2.5空间分异规律 从年均值来看,胡焕庸线和长江是中国PM2.5浓度高值区和低值区的东西和南北分界线。胡焕庸线以东和长江以北的环渤海城市群、中原城市群、长三角城市群、长江中游城市群和哈长城市群等地区是2014年PM2.5的高污染城市聚集地(图4a),年均值72 μg/m3以上的城市均在此范围内。长江以南地区和胡焕庸线以西地区(新疆中部除外)的城市PM2.5年均值均处于较低水平。
图4 2014年中国主要城市年均PM2.5浓度空间分布
Fig. 4 Spatial distribution of annual average PM2.5 concentrations in the major cities of China in 2014
按GB 3095-2012年均限值35 μg/m3统计,全年90%的城市PM2.5浓度超标(图4a),城市年均超标246天。44个城市超标天数大于300天,主要集中在京津冀、长三角、中原、江淮和长江中游城市群地区,其中淄博、济南、德州、济宁、菏泽、聊城和邯郸的超标天数多于340天;105个城市超标200~300天,广泛分布于长三角、山东半岛、辽东半岛、成渝、哈长、晋中、关中—天水、天山北坡等城市群地区;41个城市超标200天以下,集中在东南沿海和云藏蒙地区(图4b),只有鄂尔多斯、海口、拉萨和三亚4个城市超标100天以内。
按PM2.5浓度全年日均值超标率统计,全国城市平均超标93天。其中京津冀和鲁西北地区的邢台、石家庄、保定等10个城市日均值超标天数大于200天;70个城市超标100~200天,分布在长三角、山东半岛、中原、辽东半岛、长江中游、成渝、哈长和晋中等城市群地区;110个城市超标100天以下,集中在东部沿海、东南沿海、云藏和蒙甘宁地区。其中延安、大庆、贵阳等47个城市小于50天;福州、湛江、泉州、海口、厦门、曲靖、玉溪、昆明、三亚和拉萨10个城市超标不足10天(图4c)。
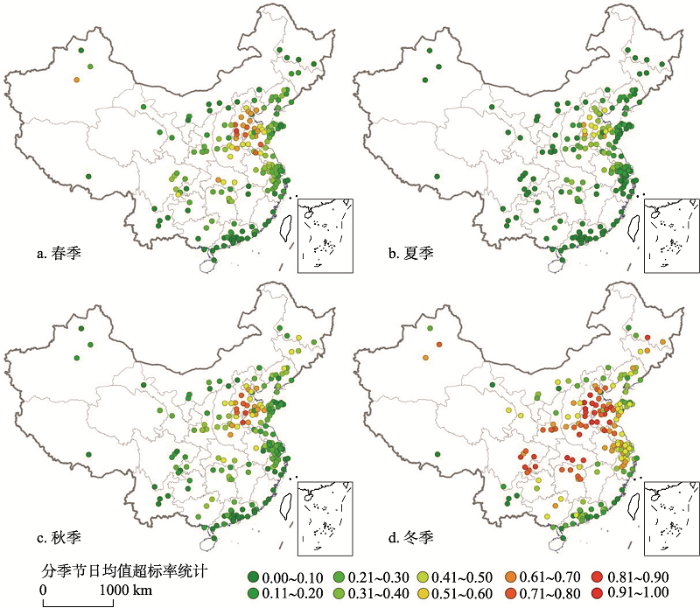
3.2.2 2014年PM2.5季节空间变化规律 按季节统计全国城市的PM2.5日均值超标率发现,2014年PM2.5污染范围呈现冬季最广,夏季最小,春秋居中的变化规律。冬季(88天)PM2.5日均值平均超标率为44.49%(39天)。超标率50%以上的81个高污染城市遍布整个华北和中原地区。超标30%~50%的61个城市集中在长三角、山东半岛、辽东半岛和桂贵地区;超标30%以下的49个城市分布在东南沿海和云藏蒙地区(图5d)。春季(87天)和秋季(88天)的平均超标率分别为24.43%(21天)和23.35%(20天),超标城市集中在华北平原地区,范围小于冬季。春季超标50%以上的21个城市分布在京津冀、鲁西北和新疆地区;超标30%~50%的46城市集中在中原地区、长三角北部和长江中游地区(图5a);秋季超标50%以上的19个城市较春季南移,集在中河北、中原地区和鲁西北地区,30%~50%的39个城市集中在京津、中原、长江中游、哈大等城市群地区(图5c);夏季(91天)平均超标率13.16%(12天),只有石家庄、邯郸和莱芜3个城市超标率大于50%,超标30%以上的27个城市集中在京津冀和长三角北部地区,东部沿海和秦岭—淮河以南的108个城市超标率均低于10%(图5b)。
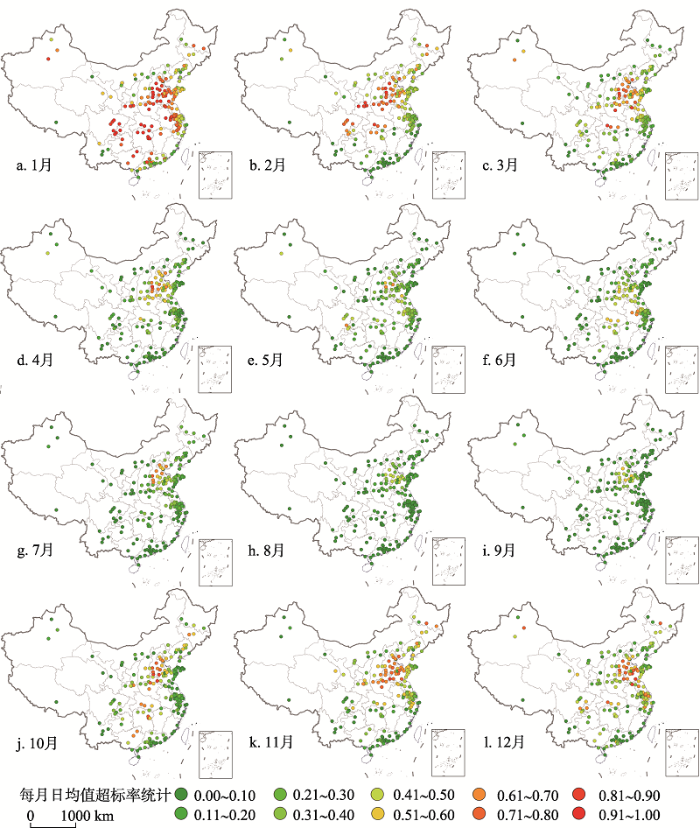
3.2.3 2014年PM2.5月度空间变化规律 从月度分析,1月份PM2.5污染浓度最高,空间范围最大,日均值平均超标率59.41%(18天),超标率50%以上的重污染城市遍布华北地区、中部地区和西南地区,其中成渝、京津冀和长江中游城市群是重度污染地区,长三角和辽东半岛城市群次之,东南沿海和云藏蒙地区空气质量较好(图6a)。2月(图6b)、3月(图6c)、11月(图6k)和12月(图6j)污染范围仅次1月,平均超标率30%~40%之间;其中2月重污染城市集中在京津冀、长三角、中原、长江中游、成渝、关中及天山北坡城市群,3月范围向华北和长江中游地区缩小;4月至9月(图6d~6i)期间,高污染城市分布范围从中部地区向京津冀地区持续缩小。10月(图6j)、11月和12月超标率回升,分别为26.96%、34.25%和33.74%,其中12月超标率较11月减少,且重度污染范围从京津冀地区显著南移,与11月APEC会议期间北京、天津、河北、山西、内蒙古、山东等6省区市同时采取的车辆限行、石油化工等污染企业关停等环境保护措施具有直接关系。反观之,城市经济月度运行稳定的情况下,城市PM2.5的出现显著的月度差异,验证了PM2.5与风速具有负相关关系的观点[26](图6)。
图5 2014年中国主要城市PM2.5浓度季节性空间分布
Fig. 5 Seasonal changes of air pollution in the major cities of China in 2014
图6 2014年中国主要城市PM2.5浓度月度空间分布
Fig. 6 Spatial distribution of monthly PM2.5 concentrations in the major cities of China in 2014
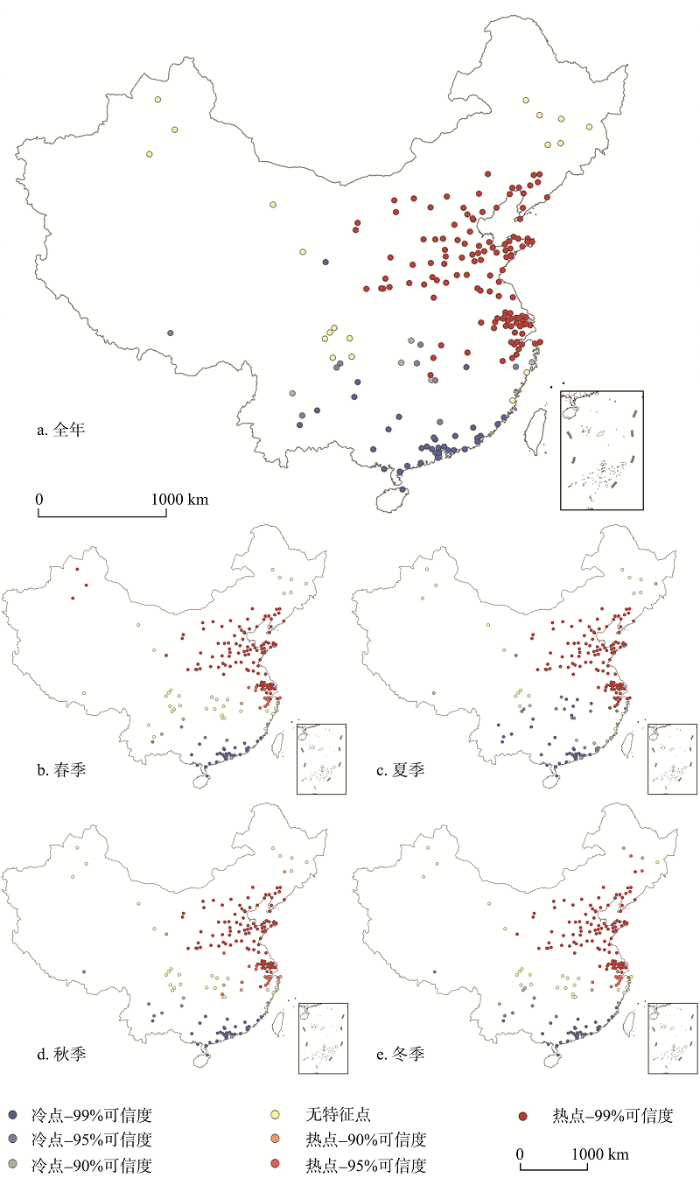
3.3.1 2014年PM2.5浓度的季节空间集聚规律 全年和春、夏、秋、冬PM2.5浓度的Z(I)指数分别为28.32、16.65、27.25、20.91和27.22,空间上具有相似的集聚特征。热点(Hot Spot)主要集中在东部沿海的环渤海地区、长三角地区、中部平原地区、关中—天水地区和内蒙古地区。另外春季新疆地区的三个监测城市出现PM2.5浓度高度集聚现象,这与春季该地区风沙多发的气候有关;冷点(Cold Spot)主要集中在东南沿海的珠三角城市群、云南和西藏地区;江淮、长江中游和成渝城市群,以及西北和东北地区分散的监测城市PM2.5空间自相关性不明显。图7表明PM2.5浓度在东部沿海的华北平原、长三角城市群和中部地区形成了较为稳定和持续的污染连片区,这些地区城市群高度发育,可见中国胡焕庸线以东和长江以北的华北和华东城市群地区是PM2.5浓度高集聚地区,而东南沿海的珠三角城市群、云南和西藏地区则是持续稳定的空气质量优良区。
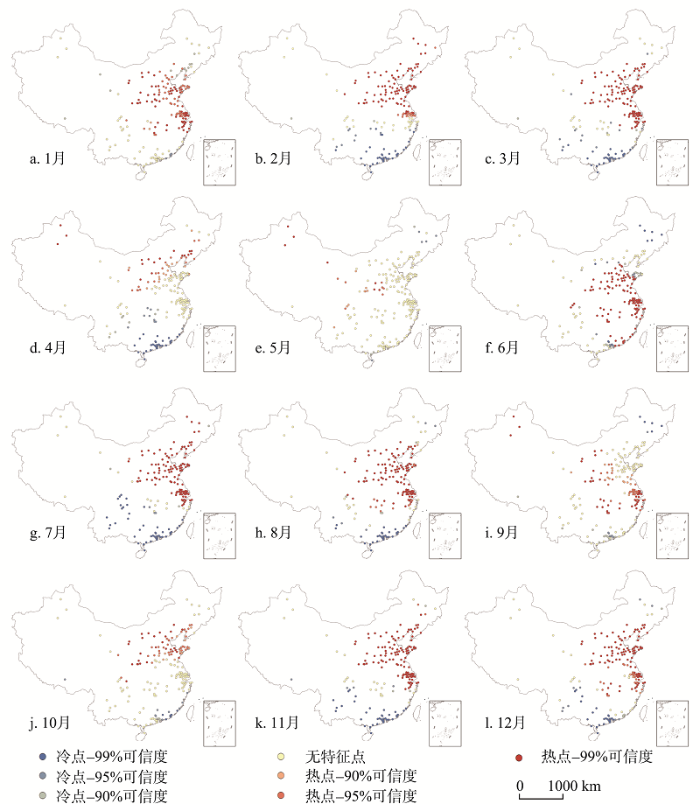
3.3.2 2014年PM2.5浓度的月度空间集聚与周期性循环规律 按月份来看,中国城市PM2.5浓度的空间局部相关性呈现周期性变化。1月(图8a)、2月(图8b)和3月(图8c),热点城市广泛分布于中国中部和东部沿海地区,其范围逐渐向长江以北退缩。其中1月全国以热点)和无特征点(No Significant Sopt)为主,而2、3月热点和冷点沿长江形成明显的分界线。这表明1月到3月期间,随着北方燃煤取暖逐渐停止,PM2.5污染范围逐渐从中国东南部地区向长江以北退缩,空气质量改善。4月(图8d)、5月(图8e)Z(I)指数相继缩小至全年最低,无特征点占据主导地位且由东部沿海向内陆地区扩散,表明随着春季的到来,北方地区风力增大,PM2.5污染范围向西部地区趋于消失。6(图8f)、7月(图8g)热点范围再次扩大,冷点范围在长江以南地区同时扩大,表明受季风气候影响,中国东部地区降雨量增大,对PM2.5的净化作用增强,各城市PM2.5浓度普遍下降,但在长三角及华北地区仍然有PM2.5高值集聚现象,这反映了这些地区产业与人口聚集对PM2.5浓度具有强有力的主导作用。8月(图8h)、9月(图8i)、10月(图8j)热点和冷点范围再次向西向北方向缩小,无特征点则从长三角和环渤海地区向内陆占据主导地位,表明PM2.5污染随之向内陆地区扩散,且于10月在华北平原地区趋于稳定。11月(图8h)、12月(图8i),随着北方燃煤取暖逐渐开展,高浓度PM2.5主导的热点范围再次遍布长江以北地区,同时优良空气质量主导的冷点范围在东南沿海地区趋于稳定。总体来看,12个月中PM2.5污染经历了由遍布中东部地区状态,逐渐向北方地区退缩,再由北方地区向遍布中东部地区的一个循环周期。全年只有4月5月和9月10月的高值集聚城市数量少,与季风明显相关性[26]。
图7 2014年中国主要城市PM2.5浓度年季空间集聚
Fig. 7 Spatial agglomeration of annual and seasonal PM2.5 concentrations in the cities of China in 2014
图8 2014年中国主要城市PM2.5浓度月度空间集聚
Fig. 8 Spatial agglomeration of monthly PM2.5 concentrations in the major cities of China in 2014
(1)中国城市PM2.5浓度具有显著的“U”形月均变化规律和周期性脉冲型逐日变化规律。2014年中国190个监测城市PM2.5年均浓度为61 μg/m3,全国城市平均达标天数为274天,年均值达标城市17个,达标天数夏季最多,秋春次之,冬季最少;其中6-8月空气达标率均在80%以上,4、5和10月在60%~70%之间,2、3、11、12月在50%~60%之间,1月最低为42%;污染天气春冬多,夏秋少,1、2、3、11和12月的污染天气比例均超过30%,严重污染天气集中在1月和2月。
(2)中国城市PM2.5浓度具有显著的空间分异规律,胡焕庸线和长江是中国PM2.5浓度高值区和低值区的东西和南北分界线。胡焕庸线以东和长江以北的环渤海城市群、中原城市群、长三角城市群、长江中游城市群和哈长城市群等地区是2014年PM2.5的高污染城市聚集地,此范围内的城市PM2.5年均值在72 μg/m3以上;长江以南以及胡焕庸线以西(新疆中部除外)地区城市处于较低水平。PM2.5污染具有季节性空间差异,污染范围冬季最广,夏季最小,春秋居中;PM2.5污染具有月度空间变化规律,1月污染范围最大,9月最小,其间污染范围从整个华北地区、中部地区和西南地区向京津冀地区集中,10月份再次扩大。
(3)中国城市PM2.5浓度具有显著的空间集聚规律,北方城市群是PM2.5核心集聚区。华北平原和长三角地区是全年主要的PM2.5集聚地区,东南沿海地区则是持续稳定的空气质量优良区。中国城市PM2.5浓度按月份呈现周期性变化。1-3月PM2.5集聚区覆盖中国中东部地区,污染范围开始从长江以来向长江以北退缩;4-5月PM2.5污染范围向西部地区趋于消失。6-7月范围再次向华北平原地区扩大,8-9月随之向内陆地区扩散,且于10月在华北平原地区趋于稳定,11-12月污染范围向北方地区继续扩大,形成一个完整周期。4-5月和9-10月的高值集聚范围缩小,与季风同期。
关于污染城市排名的讨论。2014年初,国家环保部针对PM2.5、PM10、NO2、CO、O3等多种污染物综合排名,发布2014年重点区域和74个城市空气质量状况显示,空气质量相对较差的前10位城市分别是保定、邢台、石家庄、唐山、邯郸、衡水、济南、廊坊、郑州和天津[27]。本文只针对PM2.5浓度进行城市排名,得出PM2.5年均值最高的10座城市分别为邢台、保定、石家庄、邯郸、衡水、德州、菏泽、唐山、聊城、廊坊。因研究对象不同,故排名结果有所差异。
关于中国PM2.5时空分布规律的讨论。2013年,徐虹等基于已发表文献中的PM2.5离子数据,探讨中国PM2.5的时空变化特征,得出中国PM2.5污染较为严重的结论。空间上看,西北地区历史统计平均值最高,其次是华北、西南和华东地区,华南地区最低;季节上看,PM2.5浓度整体冬季最高,春季最低,但各组分的季节变化特征各异[28]。该研究与本文关于中国PM2.5污染较为严重的结论一致,但本文采用的监测数据在准确性方面较文献数据更具说服力,在空间上得出了华北、华东地区PM2.5浓度最高,华南地区较低的结论,在季节上认为冬季全国PM2.5浓度最高,春秋次之,夏季最低。但前文对PM2.5各组分的时空规律特征研究为本文提供了思路借鉴。2014年,Gang Lin等运用MODIS反演数据探讨了2001-2010年全国PM2.5浓度时空演变规律,认为以京津冀为主的华北地区,以山东、安徽和江苏为主的华东地区,以及河南与四川是中国PM2.5的主要集聚区[29]。这一结论与本文得出的空间规律基本相似,但该数据无法揭示中国和城市逐月和逐日的时间规律。2014年,Jianlin Hu基于夏季的监测数据研究了华北平原地区和长三角地区的PM2.5时空规律,认为华北平原的污染程度高于长三角,并且PM2.5浓度在250 km范围内具有显著的时间关联性[26],这一结论与本文PM2.5浓度的空间格局特征与空间自相关集聚特征规律相吻合。整体来看,目前尚无基于监测数据的全国PM2.5时空规律研究,本文得出的时空变化规律可以在更广的空间范围与连续季节—月份序列方面弥补和佐证之前的研究结论。
关于东南沿海地区为稳定的空气质量优良区的讨论。京津冀、长三角和珠三角三大经济发达区域是中国PM2.5的重点监测与关注地区,诸多研究认为珠三角是中国PM2.5的重点污染地区[17]。随着国家对空气污染治理投入的不断加大,全国各地的空气质量均得以改善,但在2015年2月2日环保部公布的74个重点城市2014年空气质量状况中,仍有九成城市空气质量不达标。2014年,珠三角区域空气质量平均达标天数(298天)高于全国监测城市平均值(241天)23.65%,重污染天数比例也远低于全国平均水平。并且超标天数的污染物中以O3为首要污染物天数最多,而非PM2.5。另外,根据《中国空气质量在线监测分析平台》显示,2014年珠三角城市PM2.5年均值均位于30~53 μg/m3之间,低于全国平均水平61 μg/m3。而京津冀和长三角2014年PM2.5浓度分别为93 μg/m3和57 μg/m3。在2014年PM2.5达到全国二级标准的12个城市中,6个城市位于珠三角地区[30]。所以,在全国PM2.5污染整体较为严重的背景下,本文关于珠三角城市群属于环境质量较为稳定的空气质量优良区这一结论具有可信性。
另外,本文揭示的PM2.5逐月时空规律中,12月超标天数明显少于11月,且重度污染范围从京津冀地区显著南移,与11月APEC会议期间京津冀晋蒙鲁等6省区市同时采取的车辆限行、石油化工等污染企业关停等环境保护措施具有直接关系。这一结论印证了刘彦随等在《Nature》发文所得出的“区域联合防控与管制在控制污染物排放、改善大气环境质量中具有重大意义和作用”之结论[31]。综合考虑中国PM2.5的国内外研究成果,目前尚停留在对PM2.5的组分、来源和时空现象的分析阶段,基于长时间监测数据讨论PM2.5各组分的时空规律、影响因素,及其与快速城市化过程的交互耦合关系是未来研究的重要内容。
The authors have declared that no competing interests exist.
| [1] |
Size-resolved aerosol chemical analysis of extreme haze pollution events during early 2013 in urban Beijing, China. https://doi.org/10.1016/j.jhazmat.2014.07.023 URL PMID: 25106045 [本文引用: 1] 摘要
Using size-resolved filter sampling and chemical characterization, high concentrations of water-soluble ions, carbonaceous species and heavy metals were found in both fine (PM2.1) and coarse (PM2.1-9) particles in Beijing during haze events in early 2013. Even on clear days, average mass concentration of submicron particles (PM1.1) was several times higher than that previously measured in most of abroad urban areas. A high concentration of particulate matter on haze days weakens the incident solar radiation, which reduces the generation
|
| [2] |
Mechanism for the formation of the January 2013 heavy haze pollution episode over central and eastern China. https://doi.org/10.1007/s11430-013-4773-4 URL [本文引用: 1] 摘要
In January 2013, a long-lasting episode of severe haze occurred in central and eastern China, and it attracted attention from all sectors of society. The process and evolution of haze pollution episodes were observed by the 'Forming Mechanism and Control Strategies of Haze in China' group using an intensive aerosol and trace gases campaign that simultaneously obtained data at 11 ground-based observing sites in the CARE-China network. The characteristics and formation mechanism of haze pollution episodes were discussed. Five haze pollution episodes were identified in the Beijing-Tianjin-Hebei (Jing-Jin-Ji) area; the two most severe episodes occurred during 9-15 January and 25-31 January. During these two haze pollution episodes, the maximum hourly PM mass concentrations in Beijing were 680 and 530 脦录g m, respectively. The process and evolution of haze pollution episodes in other major cities in the Jing-Jin-Ji area, such as Shijiazhuang and Tianjin were almost the same as those observed in Beijing. The external cause of the severe haze episodes was the unusual atmospheric circulation, the depression of strong cold air activities and the very unfavorable dispersion due to geographical and meteorological conditions. However, the internal cause was the quick secondary transformation of primary gaseous pollutants to secondary aerosols, which contributed to the 'explosive growth' and 'sustained growth' of PM. Particularly, the abnormally high amount of nitric oxide (NO) in the haze episodes, produced by fossil fuel combustion and vehicle emissions, played a direct or indirect role in the quick secondary transformation of coal-burning sulphur dioxide (SO) to sulphate aerosols. Furthermore, gaseous pollutants were transformed into secondary aerosols through heterogeneous reactions on the surface of fine particles, which can change the particle's size and chemical composition. Consequently, the proportion of secondary inorganic ions, such as sulphate and nitrate, gradually increased, which enhances particle hygroscopicity and thereby accelerating formation of the haze pollution.
|
| [3] |
Ambient air pollution, climate change, and population health in China. https://doi.org/10.1016/j.envint.2011.03.003 URL PMID: 21440303 [本文引用: 1] 摘要
As the largest developing country, China has been changing rapidly over the last three decades and its economic expansion is largely driven by the use of fossil fuels, which leads to a dramatic increase in emissions of both ambient air pollutants and greenhouse gases (GHGs). China is now facing the worst air pollution problem in the world, and is also the largest emitter of carbon dioxide. A number of epidemiological studies on air pollution and population health have been conducted in China, using time-series, case-crossover, cross-sectional, cohort, panel or intervention designs. The increased health risks observed among Chinese population are somewhat lower in magnitude, per amount of pollution, than the risks found in developed countries. However, the importance of these increased health risks is greater than that in North America or Europe, because the levels of air pollution in China are very high in general and Chinese population accounts for more than one fourth of the world's totals. Meanwhile, evidence is mounting that climate change has already affected human health directly and indirectly in China, including mortality from extreme weather events; changes in air and water quality; and changes in the ecology of infectious diseases. If China acts to reduce the combustion of fossil fuels and the resultant air pollution, it will reap not only the health benefits associated with improvement of air quality but also the reduced GHG emissions. Consideration of the health impact of air pollution and climate change can help the Chinese government move forward towards sustainable development with appropriate urgency. Copyright 漏 2011 Elsevier Ltd. All rights reserved.
|
| [4] |
The socioeconomic drivers of China's primary PM2.5 emissions.
Primary PMemissions contributed significantly to poor air quality in China. We present an interdisciplinary study to measure the magnitudes of socioeconomic factors in driving primary PM emission changes in China between 1997-2010, by using a regional emission inventory as input into an environmentally extended input-output framework and applying structural decomposition analysis. Our results show that China's significant efficiency gains fully offset emissions growth triggered by economic growth and other drivers. Capital formation is the largest final demand category in contributing annual PM emissions, but the associated emission level is steadily declining. Exports is the only final demand category that drives emission growth between 1997-2010. The production of exports led to emissions of 638 thousand tonnes of PM, half of the EU27 annual total, and six times that of Germany. Embodied emissions in Chinese exports are largely driven by consumption in OECD countries.
|
| [5] |
Potential effects of haze pollution on agriculture in China. Journal of https://doi.org/10.11654/jaes.2014.11.30 URL [本文引用: 1] 摘要
随着国民经济的快速发展,以煤炭为主的能源消耗量大幅攀升,机动车保有量急剧增加,由此引发的大气污染已成为制约我国社会可持续发展的瓶颈,特别是近年来 频繁发生的区域性霾污染引起了公众和政府的广泛关注。当前,霾污染对能见度、空气质量和人体健康影响的报道较多,针对霾污染对农业环境影响的研究亟待开 展。霾是气溶胶(颗粒物)本身的物理特征和化学成分消光引起的大气能见度下降,主要是人类活动加剧引起的细颗粒物(PM2.5)污染。因此,认知 PM2.5的时空分布及其化学组成是评估霾污染影响的科学基础。环保部监测结果显示,我国大气PM2.5浓度呈现区域性污染特征,在京津冀、长三角、珠三 角和成渝等地区成片分布。从空间分布上,PM2.5污染的高值区
大气霾污染对农业生产的可能影响 .https://doi.org/10.11654/jaes.2014.11.30 URL [本文引用: 1] 摘要
随着国民经济的快速发展,以煤炭为主的能源消耗量大幅攀升,机动车保有量急剧增加,由此引发的大气污染已成为制约我国社会可持续发展的瓶颈,特别是近年来 频繁发生的区域性霾污染引起了公众和政府的广泛关注。当前,霾污染对能见度、空气质量和人体健康影响的报道较多,针对霾污染对农业环境影响的研究亟待开 展。霾是气溶胶(颗粒物)本身的物理特征和化学成分消光引起的大气能见度下降,主要是人类活动加剧引起的细颗粒物(PM2.5)污染。因此,认知 PM2.5的时空分布及其化学组成是评估霾污染影响的科学基础。环保部监测结果显示,我国大气PM2.5浓度呈现区域性污染特征,在京津冀、长三角、珠三 角和成渝等地区成片分布。从空间分布上,PM2.5污染的高值区
|
| [6] |
Spatial and temporal characteristics of particulate matter in Beijing, China using the Empirical Mode Decomposition method .https://doi.org/10.1016/j.scitotenv.2013.04.005 URL PMID: 23644281 [本文引用: 1] 摘要
Air pollution has become a serious problem in Beijing, China. Daily PM10 mass concentration measurements were collected at 27 stations in Beijing over a 5-year period from January 1, 2008 to October 31, 2012. We used a new clustering method (kernel K-means) and a new period and trend decomposition method (Empirical Mode Decomposition, EMD) to explore the spatial and temporal characteristics of the PM10 mass concentration in the City. The temporal period and trend of each cluster center were decomposed using the EMD method, which is an adaptive data analysis method that requires no prior information. The daily PM10 mass concentrations varied greatly from 5 渭g/m(3) to more than 600 渭g/m(3). All of the stations were partitioned into three clusters by the kernel K-means method, and which represent the low-, middle- and high-pollution stations, respectively. The first cluster contained nine stations, mainly located in the north suburban area. The second cluster, whose degree of pollution was much more serious than the first cluster, contained 13 stations distributed in urban and peri-urban areas. The pollution level in the southern part of Beijing was much more serious than in the northern part of the City. The third cluster contained five stations located outside the second-cluster stations. The total decreased amplitudes of the three clusters during the whole period were 19 渭g/m(3), 10 渭g/m(3) and 4 渭g/m(3), respectively. Although the global trend of the PM10 mass concentration decreased in general, it was not the same for each season and station. The trends in summer and winter declined, while in spring, it has been increasing in recent years. Five types of trends can be found for stations, including monotonic decreasing, rise fall, fall rise fall, fall rise and rise. The rising trend of the regional background air pollution monitoring station, Miyun-reservoir, indicates an increase in the City's background PM10 mass concentration. Copyright 漏 2013 Elsevier B.V. All rights reserved.
|
| [7] |
Seasonal variations of anhydrosugars in PM2.5 in the Pearl River Delta Region, China. Tellus Series B-Chemical and https://doi.org/10.3402/tellusb.v66.22577 URL [本文引用: 1] 摘要
ABSTRACT A B S T R A C T Anhydrosugars including levoglucosan and mannosan are the most effective organic tracers for biomass burning aerosol in the atmosphere. In this study, to investi
|
| [8] |
Air quality and emissions in theYangtze River Delta, China ,
No abstract available.
|
| [9] |
Characteristics of concentrations and chemical compositions for PM2.5 in the region of Beijing, Tianjin, and Hebei, China. https://doi.org/10.5194/acp-13-4631-2013 URL Magsci [本文引用: 1] 摘要
In order to study the temporal and spatial variations of PM2.5 and its chemical compositions in the region of Beijing, Tianjin, and Hebei (BTH), PM2.5 samples were collected at four urban sites in Beijing (BJ), Tianjin (TJ), Shijiazhuang (SJZ), and Chengde (CD), and also one site at Shangdianzi (SDZ) regional background station over four seasons from 2009 to 2010. The samples were weighted for mass concentrations and analyzed in the laboratory for chemical profiles of 19 elements (Al, As, Ba, Ca, Cd, Co, Cr, Cu, Fe, K, Mg, Mn, Ni, P, Pb, Sr, Ti, V, and Zn), eight water-soluble inorganic ions (Na+, NH4+, K+, Mg2+, Ca2+, Cl-, NO3-, and SO42-), and carbon fractions (OC and EC). The concentrations of PM2.5 and its major chemical species were season dependent and showed spatially similar characteristics in the plain area of BTH. The average annual concentrations of PM2.5 were 71.8-191.2 mu g m(-3) at the five sites, with more than 90% of sampling days exceeding 50 mu g m(-3) at BJ, TJ, and SJZ. PM2.5 pollution was most serious at SJZ, and the annual concentrations of PM2.5, secondary inorganic ions, OC, EC, and most crustal elements were all highest. Due to stronger photochemical oxidation, the sum of concentrations of secondary inorganic ions (NH4+, NO3-, and SO42-) was highest in the summer at SDZ, BJ, TJ, and CD. Analysis of electric charges of water-soluble inorganic ions indicated the existence of nitric acid or hydrochloric acid in PM2.5. For all five sites, the concentrations of OC, EC and also secondary organic carbon (SOC) in the spring and summer were lower than those in the autumn and winter. SOC had more percentages of increase than primary organic carbon (POC) during the winter. The sums of crustal elements (Al, Ca, Fe, Mg, Ti, Ba, and Sr) were higher in the spring and autumn owing to more days with blowing or floating dust. The concentrations of heavy metals were at higher levels in the BTH area by comparison with other studies. In Shijiazhuang and Chengde, the PM2.5 pollution was dominated by coal combustion. Motor vehicle exhausts and coal combustion emissions both played important roles in Tianjin PM2.5 pollution. However, motor vehicle exhausts had played a more important role in Beijing owing to the reduction of coal consumption and sharp increase of cars in recent years. At SDZ, regional transportation of air pollutants from southern urban areas was significant.
|
| [10] |
Estimating Regional Spatial and Temporal Variability of PM2.5 Concentrations Using Satellite Data, Meteorology, and Land Use Information. |
| [11] |
Intercomparison between satellite-derived aerosol optical thickness and PM2.5 mass: Implications for air quality studies .https://doi.org/10.1029/2003GL018174 URL [本文引用: 1] 摘要
[1] We explore the relationship between column aerosol optical thickness (AOT) derived from the Moderate Resolution Imaging SpectroRadiometer (MODIS) on the Terra/Aqua satellites and hourly fine particulate mass (PM 2.5 ) measured at the surface at seven locations in Jefferson county, Alabama for 2002. Results indicate that there is a good correlation between the satellite-derived AOT and PM 2.5 (linear correlation coefficient, R = 0.7) indicating that most of the aerosols are in the well-mixed lower boundary layer during the satellite overpass times. There is excellent agreement between the monthly mean PM 2.5 and MODIS AOT (R > 0.9), with maximum values during the summer months due to enhanced photolysis. The PM 2.5 has a distinct diurnal signature with maxima in the early morning (6:00 ∼ 8:00AM) due to increased traffic flow and restricted mixing depths during these hours. Using simple empirical linear relationships derived between the MODIS AOT and 24hr mean PM 2.5 we show that the MODIS AOT can be used quantitatively to estimate air quality categories as defined by the U.S. Environmental Protection Agency (EPA) with an accuracy of more than 90% in cloud-free conditions. We discuss the factors that affect the correlation between satellite-derived AOT and PM 2.5 mass, and emphasize that more research is needed before applying these methods and results over other areas.
|
| [12] |
Limitations of remotely-sensed aerosol as a spatial proxy for fine particulate matter. https://doi.org/10.1289/ehp.0800360 URL [本文引用: 1] 摘要
BACKGROUND: Recent research highlights the promise of remotely sensed aerosol optical depth (AOD) as a proxy for ground-level particulate matter with aerodynamic diameter 鈮 2.5 渭m (PM2.5.). Particular interest lies in estimating spatial heterogeneity using AOD, with important application to estimating pollution exposure for public health purposes. Given the correlations reported between AOD and PM2.5., it is tempting to interpret the spatial patterns in AOD as reflecting patterns in PM2.5.. OBJECTIVES: We evaluated the degree to which AOD can help predict long-term average PM2.5. concentrations for use in chronic health studies. METHODS: We calculated correlations of AOD and PM2.5. at various temporal aggregations in the eastern United States in 2004 and used statistical models to assess the relationship between AOD and PM2.5 and the potential for improving predictions of PM2.5. in a subregion, the mid-Atlantic. RESULTS: We found only limited spatial associations of AOD from three satellite retrievals with daily and yearly PM2.5.. The statistical modeling shows that monthly average AOD poorly reflects spatial patterns in PM2.5. because of systematic, spatially correlated discrepancies between AOD and PM2.5. Furthermore, when we included AOD as a predictor of monthly PM2.5. in a statistical prediction model, AOD provided little additional information in a model that already accounts for land use, emission sources, meteorology, and regional variability. CONCLUSIONS: These results suggest caution in using spatial variation in currently available AOD to stand in for spatial variation in ground-level PM2.5. in epidemiologic analyses and indicate that when PM2.5. monitoring is available, careful statistical modeling outperforms the use of AOD.
|
| [13] |
Ambient Air Quality Standards (on trial) .环境空气质量标准(试行) . |
| [14] |
Spatial-temporal characteristics of PM2.5 in Beijing in 2013. https://doi.org/10.13671/j.hjkxxb.2014.0915 URL [本文引用: 1] 摘要
对2013年北京市35个自动 空气质量监测子站的NO2数据进行分析,探讨NO2的时间分布特征、空间分布特征以及与PM2.5和大气氧化性的相关性关系.结果表明,NO2浓度由高到 低的季节依次是冬季、秋季、春季和夏季,平均浓度分别为66.6、58.3、54.7μg·m-3和45.8μg·m-3;NO2浓度由高到低的监测站依 次为交通站、城区站、郊区站和区域站,年均浓度分别为78.6、57.9、48.5μg·m-3和40.3μg·m-3.NO2月均浓度呈波浪型分布,在 1月份、3月份、5月份和10月份各出现一个峰值.整体来看,区域站NO2日变化曲线呈现单峰型分布,其他站点为双峰型分布.2013年NO2浓度呈现" 反周末效应",即周末大部分时段NO2浓度高于工作日.分地区来看,年均NO2浓度由高到低的依次是城六区、西南部、东南部、西北部和东北部.各站点 NO2浓度与PM2.5和OX浓度均为显著正相关,表明NO2可以通过增加前体物浓度和增强大气氧化性两方面造成PM2.5浓度升高.
2013年北京市PM2.5的时空分布 .https://doi.org/10.13671/j.hjkxxb.2014.0915 URL [本文引用: 1] 摘要
对2013年北京市35个自动 空气质量监测子站的NO2数据进行分析,探讨NO2的时间分布特征、空间分布特征以及与PM2.5和大气氧化性的相关性关系.结果表明,NO2浓度由高到 低的季节依次是冬季、秋季、春季和夏季,平均浓度分别为66.6、58.3、54.7μg·m-3和45.8μg·m-3;NO2浓度由高到低的监测站依 次为交通站、城区站、郊区站和区域站,年均浓度分别为78.6、57.9、48.5μg·m-3和40.3μg·m-3.NO2月均浓度呈波浪型分布,在 1月份、3月份、5月份和10月份各出现一个峰值.整体来看,区域站NO2日变化曲线呈现单峰型分布,其他站点为双峰型分布.2013年NO2浓度呈现" 反周末效应",即周末大部分时段NO2浓度高于工作日.分地区来看,年均NO2浓度由高到低的依次是城六区、西南部、东南部、西北部和东北部.各站点 NO2浓度与PM2.5和OX浓度均为显著正相关,表明NO2可以通过增加前体物浓度和增强大气氧化性两方面造成PM2.5浓度升高.
|
| [15] |
Comparison of geostatistical interpolation and remote sensing techniques for estimating long-term exposure to ambient PM2.5 concentrations across the continental United States .
pollution data center web sites, quality assessment was conducted by comparing arithmetic yearly Performance Comparison of Spatial and Space-Time Interpolation Techniques for Predictionof Air Pollutant CJ, Liu Y. Limitations of remotely sensed aerosol as a spatial proxy for
|
| [16] |
Population Exposure to PM2.5 in the Urban Area of Beijing. |
| [17] |
Spatial distribution characteristics of air pollutants in major cities in China during the period of wide range haze pollution.
<div style="line-height: 150%">以2013年11—12月的中国118个重点城市667个环境监测站点的大气污染物监测数据为基础,通过选取最优的空间插值方法获得全国大范围雾霾期间每5日的污染物浓度空间分布图,并运用核密度和趋势面分析研究其空间分布规律,采用全局自相关和局部自相关分析方法探讨大气污染物浓度分布的空间异质性。结果表明:大气污染物指数在不同时段的变化较大,NO<sub>2</sub>、PM<sub>10</sub>、PM<sub>2.5</sub>、SO<sub>2</sub> 5日平均浓度均表现为东部>西部以及北方>南方的态势;PM<sub>10</sub>和PM<sub>2.5</sub>是造成大范围雾霾天气的主要贡献者;各大气污染物浓度均呈现显著的空间正相关,空间分布聚集性明显;NO<sub>2</sub>浓度的热点集中在鲁中、冀南、珠三角等城市群,PM<sub>10</sub>浓度的热点集中在冀南、关中-天水、淮海等经济区,PM<sub>2.5</sub>浓度的热点集中在京津冀、长三角、华南沿海等区域,SO<sub>2</sub>浓度的热点则集中在冀中和鲁西北地区。</div><div style="line-height: 150%"> </div>
中国大范围雾霾期间主要城市空气污染物分布特征 .
<div style="line-height: 150%">以2013年11—12月的中国118个重点城市667个环境监测站点的大气污染物监测数据为基础,通过选取最优的空间插值方法获得全国大范围雾霾期间每5日的污染物浓度空间分布图,并运用核密度和趋势面分析研究其空间分布规律,采用全局自相关和局部自相关分析方法探讨大气污染物浓度分布的空间异质性。结果表明:大气污染物指数在不同时段的变化较大,NO<sub>2</sub>、PM<sub>10</sub>、PM<sub>2.5</sub>、SO<sub>2</sub> 5日平均浓度均表现为东部>西部以及北方>南方的态势;PM<sub>10</sub>和PM<sub>2.5</sub>是造成大范围雾霾天气的主要贡献者;各大气污染物浓度均呈现显著的空间正相关,空间分布聚集性明显;NO<sub>2</sub>浓度的热点集中在鲁中、冀南、珠三角等城市群,PM<sub>10</sub>浓度的热点集中在冀南、关中-天水、淮海等经济区,PM<sub>2.5</sub>浓度的热点集中在京津冀、长三角、华南沿海等区域,SO<sub>2</sub>浓度的热点则集中在冀中和鲁西北地区。</div><div style="line-height: 150%"> </div>
|
| [18] |
A computer movie simulat ing urban growth in the Detroit region. https://doi.org/10.2307/143141 URL [本文引用: 1] |
| [19] |
The interpretation of statistical maps. https://doi.org/10.2307/2980817 URL [本文引用: 1] |
| [20] |
The contiguity ratio and statistical mapping. https://doi.org/10.2307/2986645 URL [本文引用: 1] 摘要
Publication » The contiguity ratio and statistical mapping.
|
| [21] |
Applying land use regression model to estimate spatial variation of PM2.5 in Beijing, China. https://doi.org/10.1007/s11356-014-3893-5 URL PMID: 25487555 [本文引用: 1] 摘要
Fine particulate matter (PM2.5) is the major air pollutant in Beijing, posing serious threats to human health. Land use regression (LUR) has been widely used in predicting spatiotemporal variation of ambient air-pollutant concentrations, though restricted to the European and North American context. We aimed to estimate spatiotemporal variations of PM2.5 by building separate LUR models in Beijing. Hourly routine PM2.5 measurements were collected at 35 sites from 4th March 2013 to 5th March 2014. Seventy-seven predictor variables were generated in GIS, including street network, land cover, population density, catering services distribution, bus stop density, intersection density, and others. Eight LUR models were developed on annual, seasonal, peak/non-peak, and incremental concentration subsets. The annual mean concentration across all sites is 90.7 μg/m(3) (SD65=6513.7). PM2.5 shows more temporal variation than spatial variation, indicating the necessity of building different models to capture spatiotemporal trends. The adjusted R (2) of these models range between 0.43 and 0.65. Most LUR models are driven by significant pred
|
| [22] |
Spatial agglomeration and evolution of urban population in China.
<p>城市集聚增长日益显著以及城市间连接性的增强等是20 世纪90 年代以来中国城市发 展的显著特征。通过运用GIS 环境下的Moran's I 等技术方法, 探讨了1990-2005 年中国城市 人口的空间集聚特征及其演变规律, 结果表明: 尽管总体上城市人口的正空间集聚性不强, 但局部空间集聚特征明显, 存在较强的规律性, 主要表现为“T” 字型和沿主要铁路交通线 的发展态势, 而其演变过程体现了中国城市体系空间结构正处在不断优化之中; 三大地带城 市人口空间集聚的特征反差明显, 东部城市区域基本表现为一体化发展趋势, 而中西部城市 区域则趋向于极化发展或表现出较差的整体协调能力; 进一步来看, 城市人口空间集聚的不 平衡性, 不仅体现于区域之间也体现于区域内部的城市之间, 且其作用范围进一步扩大, 集 聚区位有所变化。总体来看, 这一典型转型时期里, 中国城市人口的空间集聚特征及其演变, 体现出了市场力量、经济发展状况、基础设施建设及国家空间开发政策等的积极作用。</p>
中国城市人口的空间集聚特征与规律分析 .
<p>城市集聚增长日益显著以及城市间连接性的增强等是20 世纪90 年代以来中国城市发 展的显著特征。通过运用GIS 环境下的Moran's I 等技术方法, 探讨了1990-2005 年中国城市 人口的空间集聚特征及其演变规律, 结果表明: 尽管总体上城市人口的正空间集聚性不强, 但局部空间集聚特征明显, 存在较强的规律性, 主要表现为“T” 字型和沿主要铁路交通线 的发展态势, 而其演变过程体现了中国城市体系空间结构正处在不断优化之中; 三大地带城 市人口空间集聚的特征反差明显, 东部城市区域基本表现为一体化发展趋势, 而中西部城市 区域则趋向于极化发展或表现出较差的整体协调能力; 进一步来看, 城市人口空间集聚的不 平衡性, 不仅体现于区域之间也体现于区域内部的城市之间, 且其作用范围进一步扩大, 集 聚区位有所变化。总体来看, 这一典型转型时期里, 中国城市人口的空间集聚特征及其演变, 体现出了市场力量、经济发展状况、基础设施建设及国家空间开发政策等的积极作用。</p>
|
| [23] |
Research on the application of spatial autocorrelation method in environmental pollution .空间自相关方法及其在环境污染领域的应用分析 . |
| [24] |
Spatial and temporal variations of PM2.5 in the Pearl River Delta. https://doi.org/10.13198/j.issn.1001-6929.2014.09.02 URL [本文引用: 1] 摘要
珠三角区域PM2.5污染严 重,以2012年9月─2013年8月62个大气监测站的PM2.5联网数据为基础,采用地统计学方法定性、定量分析了该区域ρ(PM2.5)的时空变异 特征.定性分析结果表明,基底效应在0.12~0.30之间,相应ρ(PM2.5)变异属于以结构性变异为主的Ⅰ、Ⅱ类,对应的空间自相关程度为强、较 强,说明珠三角区域的ρ(PM2.5)分布差异主要由区域结构所致.定量分析结果表明:1空间自相关距离受气象因素影响,随方向和时间在51~85 km之间变化,东西方向的影响距离(75~85 km)最大.2ρ(PM2.5)在南北方向的变异幅度指数(0.34~0.70)和变异速度指数〔0.14~0.38μgN(m3·km)〕在各方向中均 为最大;而东北─西南方向的2个指标则均为最小,其中变异幅度指数为0.25~0.42,变异速度指数在0.13~0.34μgN(m3·km)之间,即 南北方向的ρ(PM2.5)变化大于其他方向.3综合异质指数介于0.14~0.54之间,说明ρ(PM2.5)总体保持在中等异质水平.鉴于珠三角区域 ρ(PM2.5)的空间变异特征,在进行监测站布设时,矩形网格相较于方形网格更适合于对该区域地理空间进行划分,其中网格的长为东西方向平均空间自相关 距离(78 km)的2倍,宽为南北方向平均空间自相关距离(56 km)的2倍.
珠三角区域 PM2.5时空变异特征 .https://doi.org/10.13198/j.issn.1001-6929.2014.09.02 URL [本文引用: 1] 摘要
珠三角区域PM2.5污染严 重,以2012年9月─2013年8月62个大气监测站的PM2.5联网数据为基础,采用地统计学方法定性、定量分析了该区域ρ(PM2.5)的时空变异 特征.定性分析结果表明,基底效应在0.12~0.30之间,相应ρ(PM2.5)变异属于以结构性变异为主的Ⅰ、Ⅱ类,对应的空间自相关程度为强、较 强,说明珠三角区域的ρ(PM2.5)分布差异主要由区域结构所致.定量分析结果表明:1空间自相关距离受气象因素影响,随方向和时间在51~85 km之间变化,东西方向的影响距离(75~85 km)最大.2ρ(PM2.5)在南北方向的变异幅度指数(0.34~0.70)和变异速度指数〔0.14~0.38μgN(m3·km)〕在各方向中均 为最大;而东北─西南方向的2个指标则均为最小,其中变异幅度指数为0.25~0.42,变异速度指数在0.13~0.34μgN(m3·km)之间,即 南北方向的ρ(PM2.5)变化大于其他方向.3综合异质指数介于0.14~0.54之间,说明ρ(PM2.5)总体保持在中等异质水平.鉴于珠三角区域 ρ(PM2.5)的空间变异特征,在进行监测站布设时,矩形网格相较于方形网格更适合于对该区域地理空间进行划分,其中网格的长为东西方向平均空间自相关 距离(78 km)的2倍,宽为南北方向平均空间自相关距离(56 km)的2倍.
|
| [25] |
Technical Regulation on Ambient Air Quality Index (on trial) .
(HJ633-20122016-01-01实施)为贯彻《中华人民共和国环境保护法》、《中华人民共和国大气污染防治法》等法律,规范环境空气质量指数日报和实时报工作,制定本标准。本标准依据《环境空气质量标准》,规定了环境空气质量指数日报和实时报工作的要求和程序。本标准中的污染物浓度均为质量浓度。本标准与《环境空气质量标准》(GB 3095-2012)同步实施。
环境空气质量指数(AQ)技术规定(试行) .
(HJ633-20122016-01-01实施)为贯彻《中华人民共和国环境保护法》、《中华人民共和国大气污染防治法》等法律,规范环境空气质量指数日报和实时报工作,制定本标准。本标准依据《环境空气质量标准》,规定了环境空气质量指数日报和实时报工作的要求和程序。本标准中的污染物浓度均为质量浓度。本标准与《环境空气质量标准》(GB 3095-2012)同步实施。
|
| [26] |
Spatial and temporal variability of PM2.5 and PM10 over the North China Plain and the Yangtze River Delta, China. |
| [27] |
The air quality condition of key area and 74 cities in China in 2014 . . 2015-02-02.2014年重点区域和74个城市空气质量状况. . 2015-02-02.] |
| [28] |
Spatial and seasonal distribution characteristics of sulfate and nitrate in PM2.5 Chjna.
结合十几年来国内外相关研究进展,分析梳理了我国环境空气PM2.5中SO2-4、NO-3和NH+4的浓度及百分含量的时空变化特征,发现PM2.5中不同二次组分的浓度及含量均呈现不同的地区性差异,其中SO2-4污染在西北地区较严重,其次是在气候湿润的华南和西南地区;NO-3的污染在西北地区较严重,在西南地区污染较轻;NH+4污染在华东地区较严重,而在西南地区污染较轻.不同组分均呈现出不同的季节变化特征,SO2-4在夏季较高,春季较低;NO-3在夏季较低,秋冬季较高;NH+4在春季较低,冬季较高.此外,近年来我国PM2.5中NO-3呈明显的上升趋势,而SO2-4在不同地区呈现出不同的变化特征.硫酸盐和硝酸盐组分的这些时空变化特征均与污染前体物的排放情况以及适宜产生二次反应的环境状况有密切关系.其中SO2-4的生成与环境条件有较大关系,而NO-3的生成与前体物的排放关系较大.根据我国经济发展与主要排放源的变化趋势,预测未来我国PM2.5中SO2-4含量有下降的可能,而NO-3含量会不断升高.
中国PM2.5中水溶性硫酸盐和硝酸盐的时空变化特征 .
结合十几年来国内外相关研究进展,分析梳理了我国环境空气PM2.5中SO2-4、NO-3和NH+4的浓度及百分含量的时空变化特征,发现PM2.5中不同二次组分的浓度及含量均呈现不同的地区性差异,其中SO2-4污染在西北地区较严重,其次是在气候湿润的华南和西南地区;NO-3的污染在西北地区较严重,在西南地区污染较轻;NH+4污染在华东地区较严重,而在西南地区污染较轻.不同组分均呈现出不同的季节变化特征,SO2-4在夏季较高,春季较低;NO-3在夏季较低,秋冬季较高;NH+4在春季较低,冬季较高.此外,近年来我国PM2.5中NO-3呈明显的上升趋势,而SO2-4在不同地区呈现出不同的变化特征.硫酸盐和硝酸盐组分的这些时空变化特征均与污染前体物的排放情况以及适宜产生二次反应的环境状况有密切关系.其中SO2-4的生成与环境条件有较大关系,而NO-3的生成与前体物的排放关系较大.根据我国经济发展与主要排放源的变化趋势,预测未来我国PM2.5中SO2-4含量有下降的可能,而NO-3含量会不断升高.
|
| [29] |
Spatio-temporal variation of PM2.5 concentrations and their relationship with geographic and socioeconomic factors in China. |
| [30] |
Air Quality On-Line Monitoring and Analysing System of China . , 2015-08-02.中国空气质量在线监测分析平台 . ,2015-08-02.] |
| [31] |
Pollution: Build on success in China. https://doi.org/10.1038/517145d URL PMID: 25567275 [本文引用: 1] 摘要
Author information: (1)Beijing Normal University; and Institute of Geographic Sciences and Natural Resources Research, Chinese Academy of Sciences, Beijing, China.
|

/
| 〈 |
|
〉 |