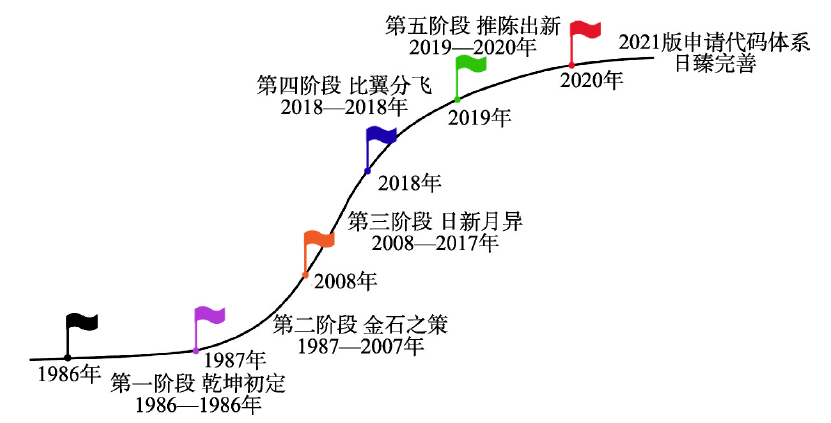
The adjustment and optimization of discipline application code is an important part and breakthrough point of the task of "science foundation discipline layout reform" of the National Natural Science Foundation of China (NSFC). This paper reviewed the historical evolution of the application code of geography discipline, systematically sorted out the problems existing in the current version of the application code for geography discipline, discussed the framework concept, principles and formation process of the new version (2021 Edition) application code system, and emphatically explained the historical evolution, scientific connotation and discipline orientation of the new application code. Compared with the previous versions, the new version of the application code system has the following four unique features: (1) The logic of the system is more reasonable; the first level code name has been changed from "Geography (D01)" to "Geographical Science (D01)". (2) The disciplines are more integrated by setting the second-level application code instead of the three-level application code, which can better reflect the interdisciplinary integration. (3) The fields are more comprehensive; according to the development trend of disciplines and the needs of economic and social development, codes of emerging disciplines and fields such as "disaster geography", "land science", and "geographic big data and spatial intelligence" have been added to the list. (4) More attention has been given to technology, namely, "geographic observation and simulation tools" are identified to encourage the development of key tools and instruments for the research of geographical issues.
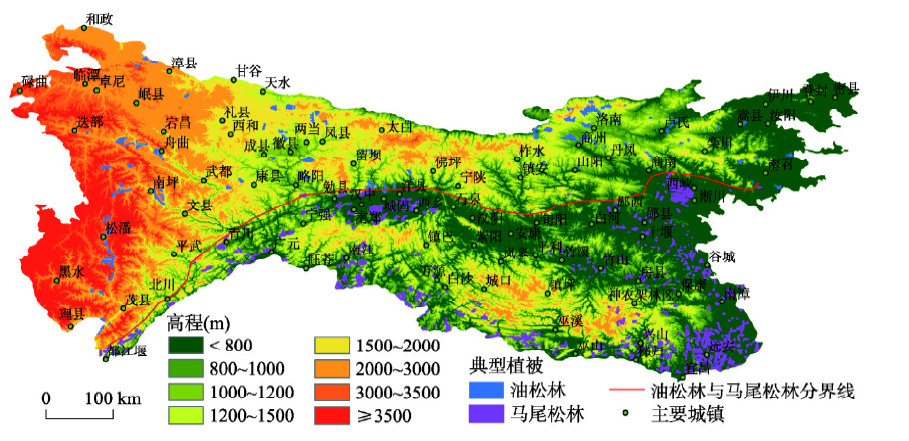
Qinling Mountains is not only the geographical boundary between North and South China, but also the boundary between subtropical and warm temperate zones. It plays an important role in the geo-ecological pattern of China. However, there is controversy about the specific location of this geographical boundary in academic community due to the complexity, transition and heterogeneity of the transitional zone, as well as the differences in the delimitation indicators and research purposes. To further reveal the characteristics of the North-South transitional zone and clarify the specific location of the geo-ecological boundary between North and South China, combined with SRTM topographic data, temperature and precipitation data, Pinus massoniana forest and Pinus tabulaeformis forest, which represent subtropical coniferous forests in South China and temperate coniferous forest in North China respectively, were chosen to analyze their spatial distributions in the Qinling-Daba Mountains and the climatic conditions at their boundary with the climatic indexes of annual precipitation, the coldest month (January) average temperature, the warmest month (July) average temperature and the annual average temperatures. The results show that: (1) Pinus massoniana and Pinus tabulaeformis forests and the climate indicators of their boundary can be used as one of the vegetation-climate indicators for the delimitation of subtropical and warm temperate zones. The boundary between the subtropical coniferous forest (Pinus massoniana forest) and temperate coniferous forest (Pinus tabulaeformis forest) in Qinling-Daba Mountains is located along the south slope of Funiu Mountain to the north edge of Hanzhong Basin (the south slope of Qinling Mountains) at an altitude of 1000-1200 m, where the climatic indictors are stable: the annual precipitation is about 750-1000 mm; the annual average temperature is about 12-14 ℃; the coldest monthly average temperature is 0-4 ℃; and the warmest monthly average temperature is about 22-26 ℃. (2) It could be more scientifically to delimitate the boundary of subtropical and warm temperate zones in China by comprehensively considering the vegetation-climate indicators. Additionally, the boundary between subtropical and warm temperate zones in Qinling-Daba Mountains should be a transitional zone consisting of the boundaries of coniferous forests, broad-leaved forests and shrubs between subtropical and warm temperate zones. The results provide a scientific basis for the selection of delimitation indicators of subtropical and warm temperate zones.
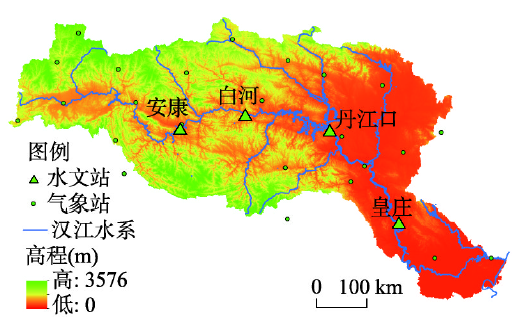
As a link between the atmosphere and the geosphere, the hydrological cycle is affected by both climate change and Land Use/Cover Change (LUCC). However, most existing research on runoff response focused mainly on the impact of the projected climate variation, neglecting the influence of future LUCC variability. Therefore, the objective of this study is to examine the co-impacts of both projected climate change and LUCC on runoff generation. Firstly, the future climate scenarios under BCC-CSM1.1 and BNU-ESM are both downscaled and corrected by the Daily Bias Correction (DBC) model. Secondly, the LUCC scenarios are predicted based on the Cellular Automaton-Markov (CA-Markov) model. Finally, the Soil and Water Assessment Tool (SWAT) model is used to simulate the hydrological process under different combinations of climate and LUCC scenarios, with the attempt to quantitatively evaluate the impacts of climate change and LUCC on runoff generation. In this study, the Hanjiang River basin is used as the case study area. The results show that: (1) compared with the base period (1966-2005), the annual rainfall, daily maximum and minimum air temperatures during 2021-2060 will have an increase of 4.0%, 1.8 ℃, 1.6 ℃ in RCP4.5 scenario, respectively, while 3.7%, 2.5 ℃, 2.3 ℃ in RCP8.5 scenario, respectively. (2) During 2010-2050, the area proportions of forest land and construction land in the study area will increase by 2.8% and 1.2%, respectively, while those of farmland and grassland will decrease by 1.5% and 2.5%, respectively. (3) Compared with the single climate change or LUCC scenario, the variation range of future runoff under both climate and LUCC is the largest, and the influence of climate change on future runoff is significantly greater than that of LUCC. This study is helpful to maintain the future water resources planning and management of the Hanjiang River basin under future climate and LUCC scenarios.
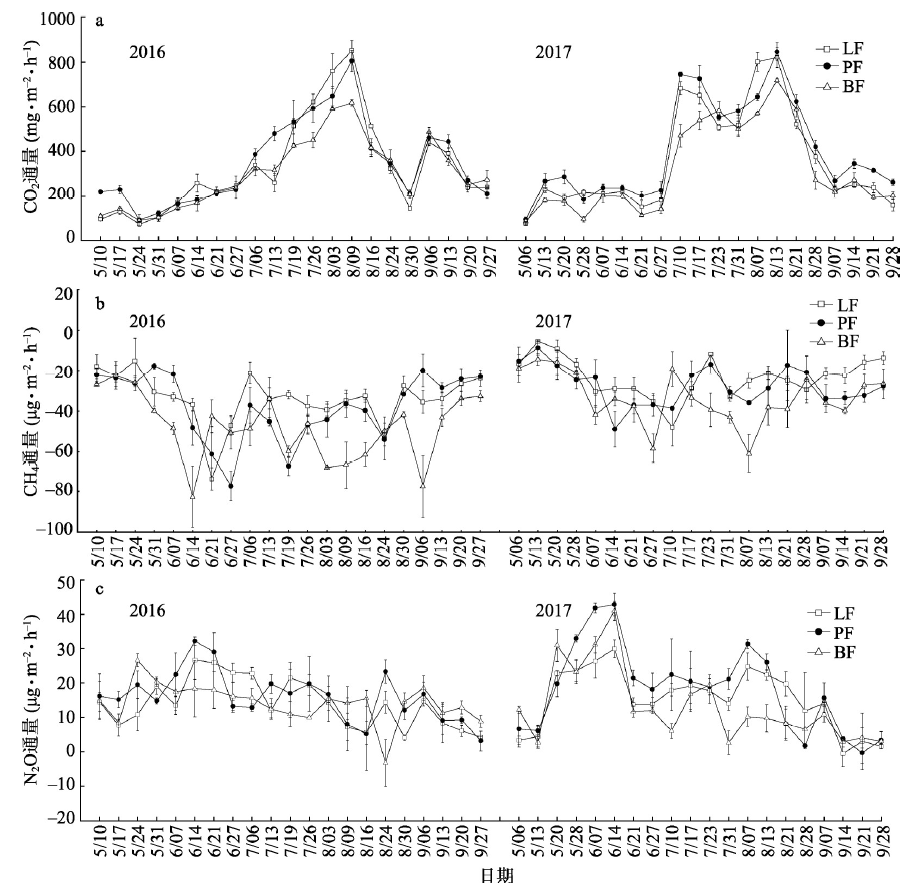
Greenhouse gases from permafrost have a significant impact on global climate change. The in situ static dark chamber and gas chromatography techniques were used to monitor the fluxes of carbon dioxide (CO2), methane (CH4), and nitrous dioxide (N2O) from the typical forest soils of Larix gmelini, Pinus sylvestris, and Betula platyphylla in the permafrost regions of the Greater Hinggan Mountains. The experiment was conducted during the growing season (May to September) of 2016 and 2017. The dynamic characteristics of greenhouse gas fluxes and the controlling factors were comparatively analyzed. The results showed that soil CO2, CH4, and N2O fluxes of the three forest types were 65.88-883.59 mg·m-2·h-1, -93.29--2.82 μg·m-2·h-1, and -5.31-45.22 μg·m-2·h-1, respectively. The soils from the three typical forests were all sources for CO2 and N2O, and sink for CH4 during the entire observation period. Soil CO2 and CH4 fluxes changed significantly among different forest types and between the two observation periods. The soil CO2 fluxes of the three forest types were mainly controlled by soil temperature and were found to have a significantly positive correlation with the soil temperature at 5, 10, and 15 cm (P < 0.01). The soil CH4 fluxes were affected by soil water content and soil temperature. The correlations were significant in the soils at 10 and 15 cm (P < 0.05). Moreover, the air temperature controlled and regulated soil N2O fluxes. The soil N2O fluxes in the Betula platyphylla forest showed a significantly negative correlation with the soil temperature at 15 cm (P < 0.05). The emission rate of soil CO2 and N2O accelerated with increasing temperature, while the absorption rate of CH4 decreased, enhancing the atmospheric greenhouse effect. The global warming potential of greenhouse gases was calculated based on the 100-year time scale, where the soil greenhouse gases of the three forest types exhibited a positive feedback on climate warming.
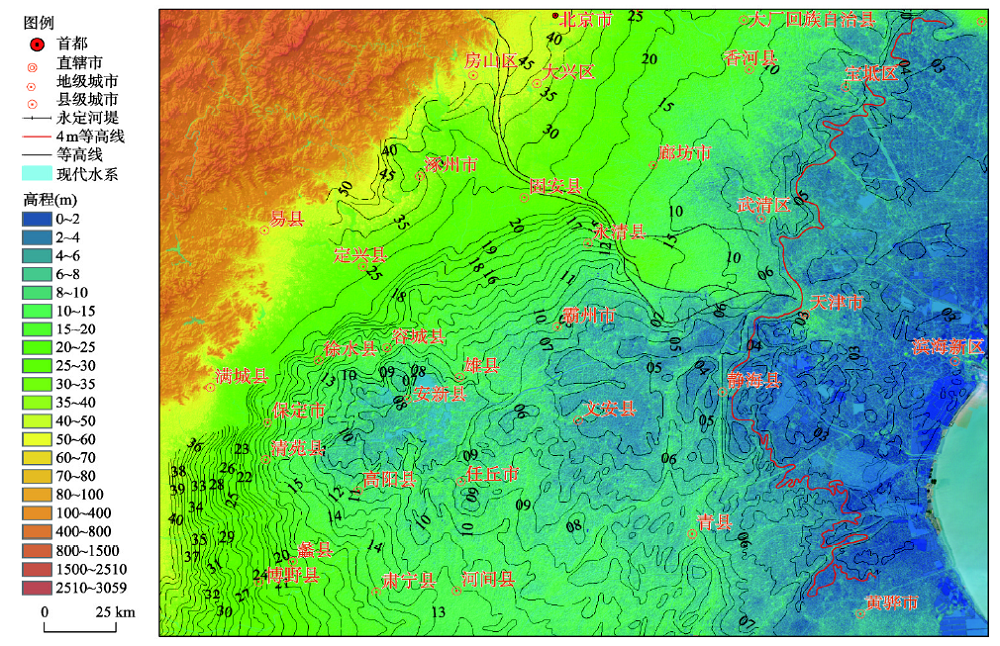
The Tang Po Lakes, consisting of a great number of small lakes and swamps, which had widely spread upon the Central Hebei Plain during the Northern Song Dynasty, was an awesome geographical landscape in North China in history. It has a significant meaning for understanding the regional environmental change in the North China Plain. The researchers employed an interdisciplinary procedure to unveil the spatial pattern and changing process of the Tang Po system in history. Based on GIS, this paper integrated the traditional historical geographic method, which mainly focused on the scrutiny of all sorts of historical records, with analysis of modern soil survey, archaeological survey, remote sensing images, and the references in the published research. In this way the spatial distribution of Tang Po Lakes on the Central Hebei Plain during the Northern Song Dynasty has been carefully examined and scientifically reconstructed for the first time. The paper showed that the Northern Song government constructed the Tang Po system at the end of the 10th century by fully taking advantage of local natural lakes and swamps originally located in the depression zone of the Central Hebei Plain which adjoined to its northern border, in order to prevent the invasion from the Liao Dynasty in north. In the mid-11th century, the Tang Po system reached its maximum extent, which spanned more than 260 kilometers from the eastern coast to the western mountain foot. The Tang Po system, which was composed of many small lakes, swamps, pits, diches, and even rice paddies, could be divided into nine sub-regions, and watered by the Tanghe River, the Shahe River, the Shenshui River, the Yishui River, the Hutuo River, and the Yuhe River. The whole Tang Po system was deliberately connected and maintained by the complex artificial facilities, such as dams, embankments, reservoirs, sluice gates, and channels. In the early 12th century the Northern Song Dynasty was in decline, the Tang Po system collapsed and was broken into three separate parts which had existed till the late Qing Dynasty. The Tang Po system of the Northern Song Dynasty has ever been the biggest man-made lake system in Chinese history, which had a magnificent impact on the regional water system and local environment of the Central Hebei Plain.
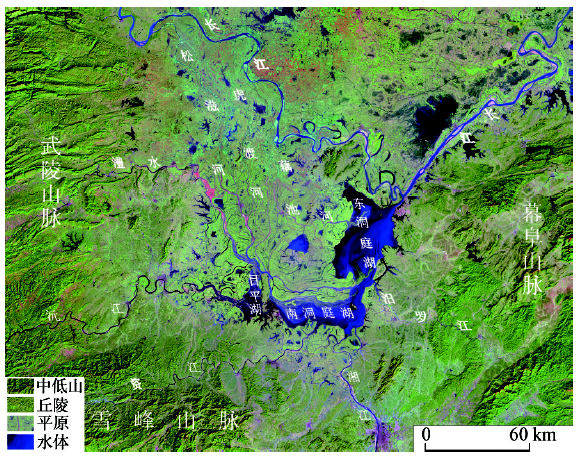
In order to analyze the spatio-temporal evolutions of Dongting Lake in modern times, this paper investigated the temporal changes of the riparian lake areas in Dongting Lake area since the late Qing Dynasty using various historical maps and remote sensing data since 1896 AD (the 22nd year during the Emperor Guangxu's reign in the Qing Dynasty). The remote sensing data interpretation, statistical analysis and historical comparison methods were used to test the accuracy of the remote sensing based lake areas with the observation data from the Ministry of Water Resources of China. The results showed that the overall error rate was only 0.62%, and after 1896, the riparian lake areas in Dongting Lake decreased from 5126.37 km2 to 2702.74 km2, with an annual atrophy rate of 48.19%. The 53 years before the founding of the People's Republic of China was a period of obvious lake shrinkage, with an annual average decrease of 15.66 km2. The 1950s was a period of rapid atrophy (134.33 km2 per year), and the 1960-1970s was a period of rapid shrinkage, with an annual rate of 21.66 km2. The riparian lake areas in Dongting Lake only reduced by 5.10 km2 since the 1980s. In terms of the areas for each lake, the East Dongting Lake was the lake with the largest shrinkage (922.60 km2) since 1935, followed by the Muping Lake (a decrease of 588.05 km2), and the South Dongting Lake (decrease of 448.37 km2). The change in areas of Qili Lake was relatively small in recent decades. The areas of Dongting Lake increased by 10.50 km2 during 1998-2002 due to the implementation of returning farmland to lake. In general, the evolution of riparian lakes in Dongting Lake area since the late Qing Dynasty was characterized by the closure and separation of Datong Lake, the replacement of the embankments for the South Dongting Lake, the local remains of the West Dongting Lake, the three-sided enclosure of East Dongting Lake and the limited operation of returning farmland to lake after the catastrophic flood in 1998. This study may provide data and technical support for the ecological restoration and environmental protection strategy of the Yangtze River Basin.
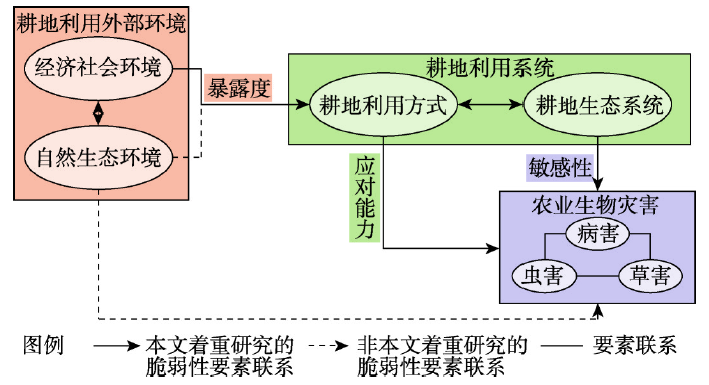
There is an urgent need to explore a novel field to enhance the comprehensive research of cultivated land use transition. Simultaneously, few studies on the coupling research of cultivated land use pattern and function transition have been done so far. Based on these considerations, we aim at presenting a novel field of cultivated land use transition research from the perspective of cultivated land use vulnerability to biological disasters (CLUVBD). First, this study integrates the motivations of profit-seeking and loss-avoiding and induced substitution in agricultural production from the perspective of agricultural biological disasters, thus establishing a theoretical framework of the transition in CLUVBD based on the socio-ecological interaction logic of "socio-economic environment - cultivated land use - feedback of biological disasters - disaster prevention and control". Then, CLUVBD transition was diagnosed and analyzed at the national, regional, and provincial levels between 1988 and 2017 using the logic growth model, single-factor simulation, and panel data regression model. Results show that CLUVBD transition is remarkable at both national and provincial levels. The value of CLUVBD at the national level firstly increased from 15.33% to 22.45% in 1988-2009 and then decreased from 22.40% to 19.49% in 2010-2017. The transition at the provincial level shows two typical pathways. Decrease of CLUVBD is mainly derived from the decline in exposure due to the narrowing of urban-rural income ratio and the increase in cultivated land area per capita of agricultural employee, followed by the increase of adaptive capacity due to the increase of retrieved grain loss ratio and the failure ratio of biological disaster prevention. Meanwhile, as CLUVBD value turns to decrease, the sensitivity increases, which is mainly due to the decline in crop diversity and the increase of fertilizer use intensity in cultivated land. The study demonstrates that CLUVBD is expected to become a novel field of comprehensive study on cultivated land use transition. In addition, the policy proposals on CLUVBD control are also discussed.
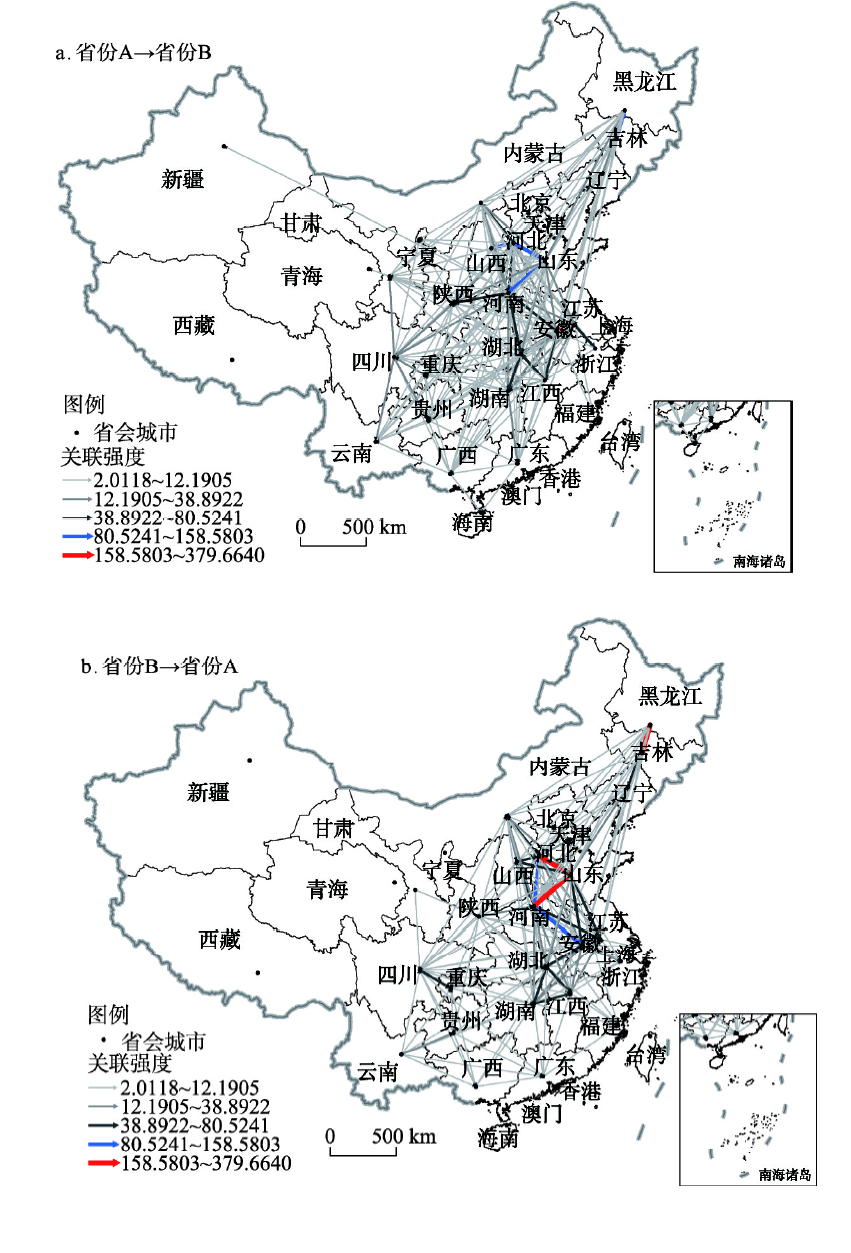
Based on the panel data of China's inter-provincial grain production from 1996 to 2018, the modified gravity model was used to accurately calculate the spatial correlation of grain production and build a spatial correlation matrix. Firstly, the structural characteristics of grain production spatial correlation network were investigated from three aspects: overall characteristics, individual characteristics and block model through the social network analysis method (SNA) and then, the quadratic assignment procedure (QAP) method was used to explore its formation mechanism. The study found that: (1) The level of inter-provincial spatial correlation of grain production increases in fluctuation, but there is still room for improvement. The network structure shows better stability and accessibility, and the spillover effect has multiple superposition. (2) The inter-provincial spatial correlation network of grain production presents a significant core-edge distribution pattern of major grain-producing areas, main-sales areas and grain balance areas, and the major grain-producing areas are at the core position in the network, and the grain main-sales areas and the balance areas are at the edge. (3) The spatial correlation network of grain production can be divided into four functional blocks, namely, net spillover block, main beneficial block, broker block and bidirectional spillover block, and the spillover effect between blocks are featured by obvious gradient transmission. (4) The combined effect of natural endowment conditions and socio-economic factors promote the formation of spatial correlation network of grain production. The geographical proximity, differences in economic development, rural labor scale, mechanical service scale and cultivated land resources, and the similarity of precipitation and sunshine hours have significant impacts on the formation of spatial correlation network of grain production. The conclusions are of great significance for us to grasp the spatial transmission mechanism, realize the cross-regional coordination and formulate differentiated grain policies in China.
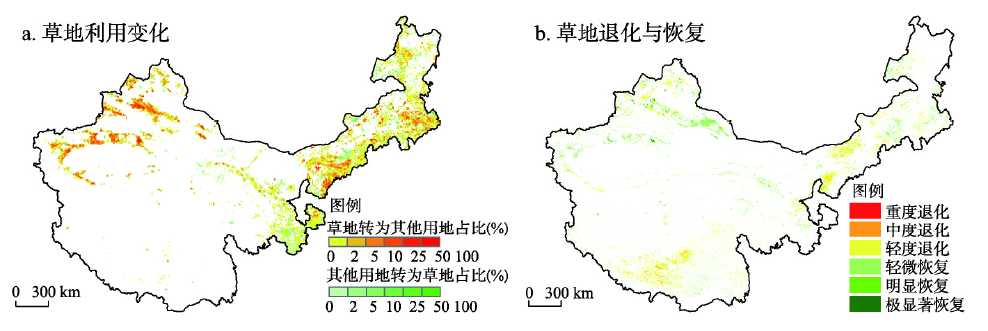
Being a key ecological security barrier and production base for grassland animal husbandry in China, the balance between grassland forage supply and livestock-carrying pressure in China's pasture regions directly affects grassland degradation and restoration, thereby impacting grassland ecosystem services. This paper analyzes the spatiotemporal variation in grassland vegetation coverage, forage supply, and the balance between grassland forage supply and livestock-carrying pressure in China's pasture regions from 2000 to 2015. We then discuss the spatial pattern of grassland ecological conservation under the impacts of grassland degradation and restoration, and livestock-carrying pressure. Over the last 16 years, the total grassland area in China's pasture regions decreased by 16,000 km2, with vegetation coverage degraded in 6.7% of grasslands but significantly restored in 5.4% of grasslands. The provisioning of forage by natural grassland mainly increased over time, with an annual growth rate of approximately 0.3 kg/hm2, but livestock-carrying pressure also increased continuously. The livestock-carrying pressure index (without any supplementary feeding) reached as high as 3.8. Apart from the potential livestock carrying capacity in northeastern Inner Mongolia and the central Tibetan Plateau, that in most parts of China's pasture regions is currently overburdened. Considering the actual supplementary feeding during the cold season, the livestock-carrying pressure index is about 3.1, with the livestock-carrying pressure mitigated in central and eastern Inner Mongolia. Assuming full supplemental feeding in the cold season, livestock-carrying pressure index will fall to 1.9, thus significantly alleviating pressure in Inner Mongolia and the Tibetan Plateau. Based on these data, we propose different conservation and development strategies to balance grassland ecological conservation and animal husbandry production in different regions, namely nature reserves, pastoral areas, semi-farming and semi-pastoral areas, and farming areas, according to prevailing patterns of grassland ecological protection.
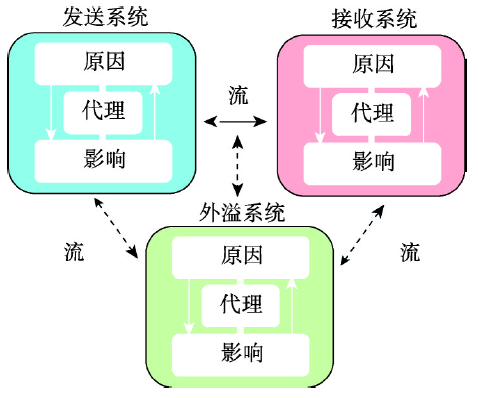
With increasing global integration, distant coupled human and natural systems have more interactions than ever before, which often lead to unexpected outcomes with profound implications for sustainability. The integrated framework of telecoupling (socioeconomic and environmental interactions over distances) has been proposed to address such cross-border and cross-scale challenges, helping better evaluate and understand telecouplings. We first provide an introduction to the telecoupling framework, including components, definitions, and functions, and then offer an overview of the growing number of telecoupling studies. Particularly, we use three Chinese cases to illustrate the methods, results, significance, and implications of applying the telecoupling framework. We also point out some research gaps and critical unsolved questions in the applications. The telecoupling framework provides a powerful tool to incorporate feedbacks, trade-offs, and synergies across multiple coupled human and natural systems, and helps improve the understanding of distant interactions and the effectiveness of policies for socioeconomic and environmental sustainability across local to global levels.
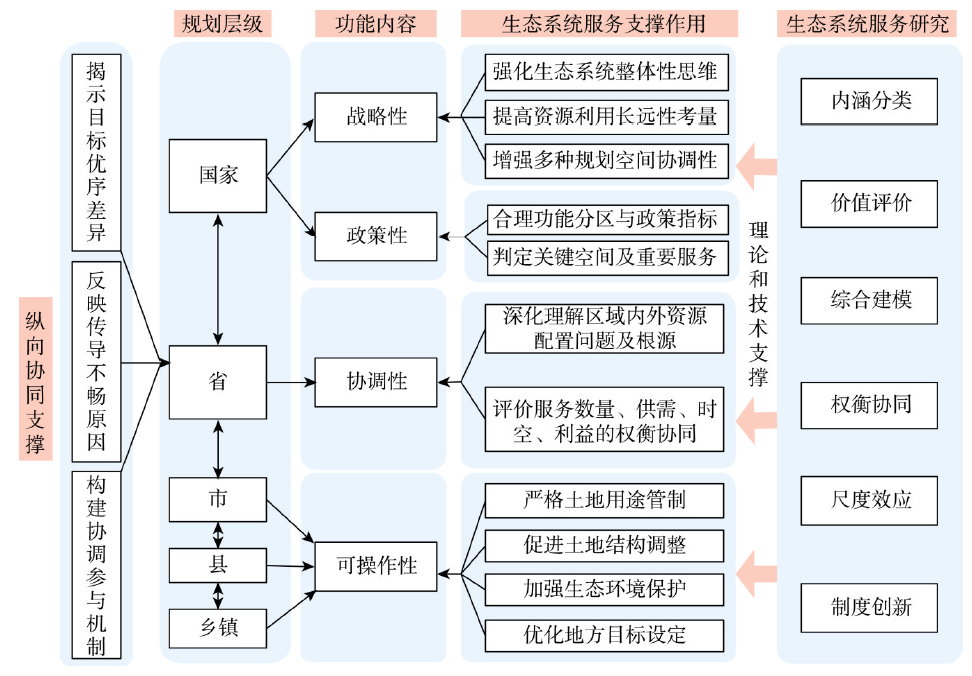
Spatial planning system reform is a critical strategy to promote ecosystem civilization construction in China. In view of the new spatial planning system, how to coordinate human activities and protect ecological pattern as well as natural resources are critical to the reformation, which urgently requires multi-disciplinary perspectives and knowledge. Ecosystem services bridge the ecosystem and the human well-being, serving as an important tool for land spatial optimization and decision making to better conform with the ecological civilization. In the light of construction demands from the spatial planning system, this research investigates how ecosystem services may provide relevant support from multiple dimensions through intensive literature and theoretical analyses. Firstly, this paper clarifies ecosystem services' connection with spatial planning in terms of values and goal. Not only are ecosystem services a carrier of spatial planning to shape the value of natural resources, but they are a government choice for spatial planning to promote public welfare as well. Secondly, an in-depth analysis of ecosystem services' support is performed with functions and contents, which vary across planning hierarchy, including the national, provisional, urban, county and village/town levels. To be more specific, insights are gained into ways that ecosystem services may facilitate the strategic and policy-oriented function, the coordinative function, and the operational function, respectively. From a scale-effect perspective, the vertical coordination across planning levels that could be facilitated by ecosystem services is also discussed. Finally, facing the needs of horizontal coordination emphasized by "multiple planning integration", ecosystem services may play important roles in three aspects: fostering common values among different sectors, coordinating multiple stakeholders' interests, and improving spatial planning technology. Results give theoretical supports and possible paths to direct spatial planning reforms, which may help to expand the application of ecosystem services in policy making.
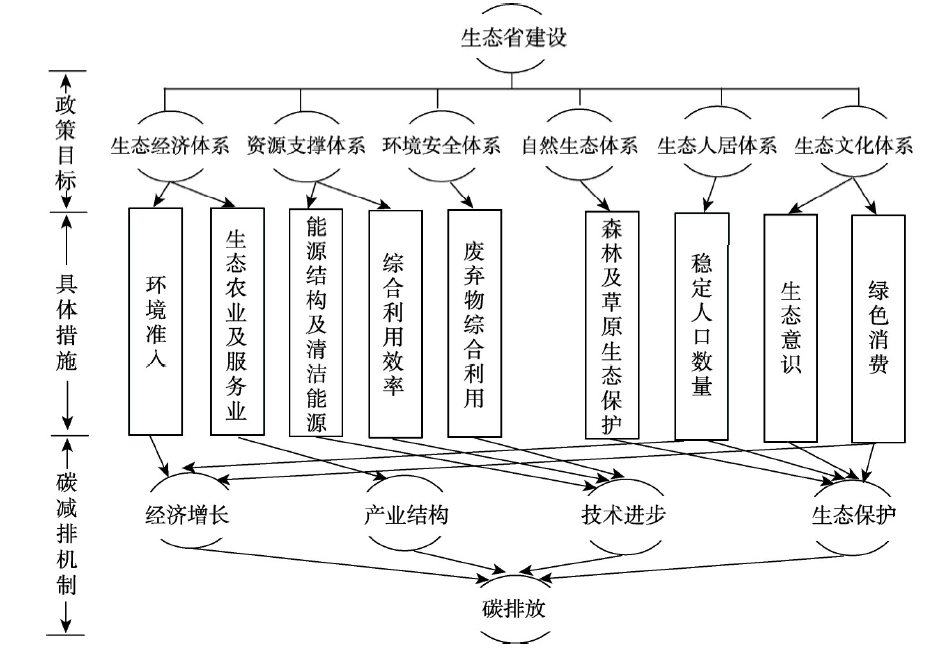
To explore the holistic governance of ecological environmental protection, China has started up a pilot project of "Ecological Province" construction since 1999. This is an important measure taken by the Chinese government to improve the ecological environment. Does this project affect carbon emissions? Answering this question can help us learn about the true effects of the "Ecological Province" construction project. Based on the provincial-level panel data from 2000 to 2015 in China, this paper focuses on exploring the effects using the methods of the quasi-natural experiment and counterfactual test. Moreover, this study tries to test the robustness of the effects using the methods of multi-stage DID model, propensity score matching-difference in difference model (PSM-DID model). The results show that: (1) "Ecological Province" construction project has a significant and robust effect on carbon emission reduction. (2) Its mechanism depends on several channels, including impeding the economic growth, protecting ecological environment and adjusting the industrial structure. (3) Nevertheless, there still exist some problems such as the regional disparity of implementing the project, the backward development of ecological industry and the lack of ecological innovation and technological progress. This study can provide a scientific basis for popularizing the experience of "Ecological Province" construction and promoting its effect on carbon emission reduction.
In view of the lack of comprehensive evaluation and analysis from the combination of natural and human multi-dimensional factors, the urban surface temperature patterns of Changsha in 2000, 2009 and 2016 are retrieved based on multi-source spatial data (Landsat 5, Landsat 8 satellite image data, POI spatial big data, digital elevation model, etc.), and 12 natural and human factors closely related to urban thermal environment are quickly obtained. The standard deviation ellipse method and spatial principal component analysis (PCA) method are used to analyze the effect of urban human residential thermal environment and the linkage of its influencing factors. The results show that: (1) During the 16 years from 2000 to 2016, the heat island area increased by 547 km2, and the maximum surface temperature difference reached 10.1 ℃. The spatial distribution of urban heat island was mainly concentrated in urban built-up areas, such as industrial and commercial areas and densely populated urban centers. The spatial distribution pattern of heat island is gradually decreasing from the urban center to the suburbs. There were many high-temperature centers, such as Wuyi square business circle, Xingsha economic and technological development zone in Changsha County, Wangcheng industrial zone, Yuelu industrial concentration zone, and Tianxin industrial zone. (2) From 2000 to 2016, the main axis of spatial development of heat island maintained in the northeast-southwest direction. From 2000 to 2009, the center of gravity of heat island shifted 2.7 km to the southwest, and the deflection angle was 54.9°; the center of gravity of heat island shifted to the northeast by 4.8 km, and the deflection angle was 60.9°. On the whole, the change of spatial pattern of thermal environment in Changsha was related to the change of urban construction intensity. (3) Through the principal component analysis method, it was concluded that the factors affecting the urban thermal environment pattern of Changsha were landscape pattern, urban construction intensity and landform. (4) The promotion effect of human factors on the formation of heat island effect was obviously greater than that of natural factors. Under the comprehensive effect, the temperature would rise by 0.293 units. There are many factors influencing the urban human settlements thermal environment. Multi-source data could help to reveal the spatial pattern and evolution law of urban thermal environment, deepen the understanding of the causes of urban heat island effect, and clarify the correlation and degree between human and natural factors, so as to provide scientific supports for the improvement of the quality of urban human settlements.
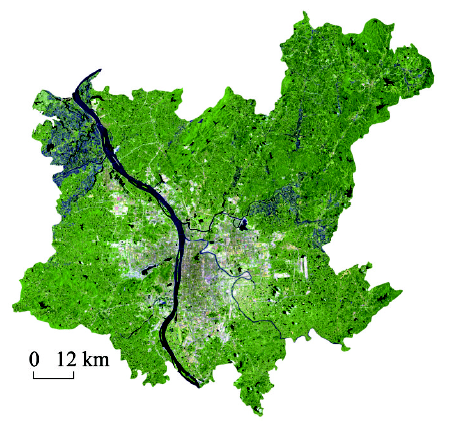
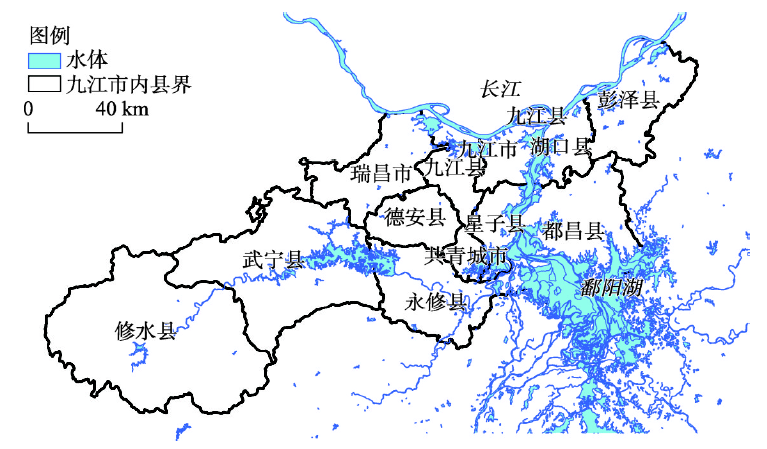
It is of vital importance to construct an ecological security network that considers both the ecological protection and the economic growth to ensure the sustainable development in waterfront cities. Based on the ecological and industrial data of Jiujiang city, we develop a comprehensive ecological security evaluation framework using the minimum cumulative resistance (MCR) model and the Duranton and Overman (DO) index. Specifically, the MCR is applied to examine the ecological landscape pattern while the DO index is introduced to analyze the degree of industrial agglomeration in continuous large areas and economic production zones. Subsequently, the eco-economic strategic nodes and green infrastructure belts are identified based on spatial conflicts between the ecological landscape patterns and economic production zones. The results demonstrate that: (1) Jiujiang city contains 29 important ecological sources with a total area of 7323 km2. The areas with high-value of ecological security resistance account for 39.69%, which are distributed in the contiguous areas in the central and eastern parts of the city. In contrast, the low-value areas are on the city's periphery where there were fewer connected transition areas, which exhibit a spatially polarized "center-periphery" ecological landscape pattern. (2) The economic production zone is close to water sources, which presents spatial patterns of small-scale agglomeration and large-scale dispersion. The average length and number of agglomeration intervals are decreasing in heavily polluted, lightly polluted, and moderately polluted industries. (3) By analyzing the ecological sources, the resistance surface as well as the economic production zone, we determined ecological corridors with a length of 685.57 km and 25 eco-economic strategic nodes. As such, 18 important green infrastructure belts with a total length of 424.53 km and 26 regular green infrastructure belts with a total length of 662.46 km are designed to increase connectivity and maintain ecological processes. All of these elements constitute a "honeycomb" pattern of the ecological security network in Jiujiang city. This study expands the agglomeration economy perspective of the traditional ecological security network construction framework, and explores the data fusion of different scales. The study could contribute to scientific references for environmental management and regional sustainable development.
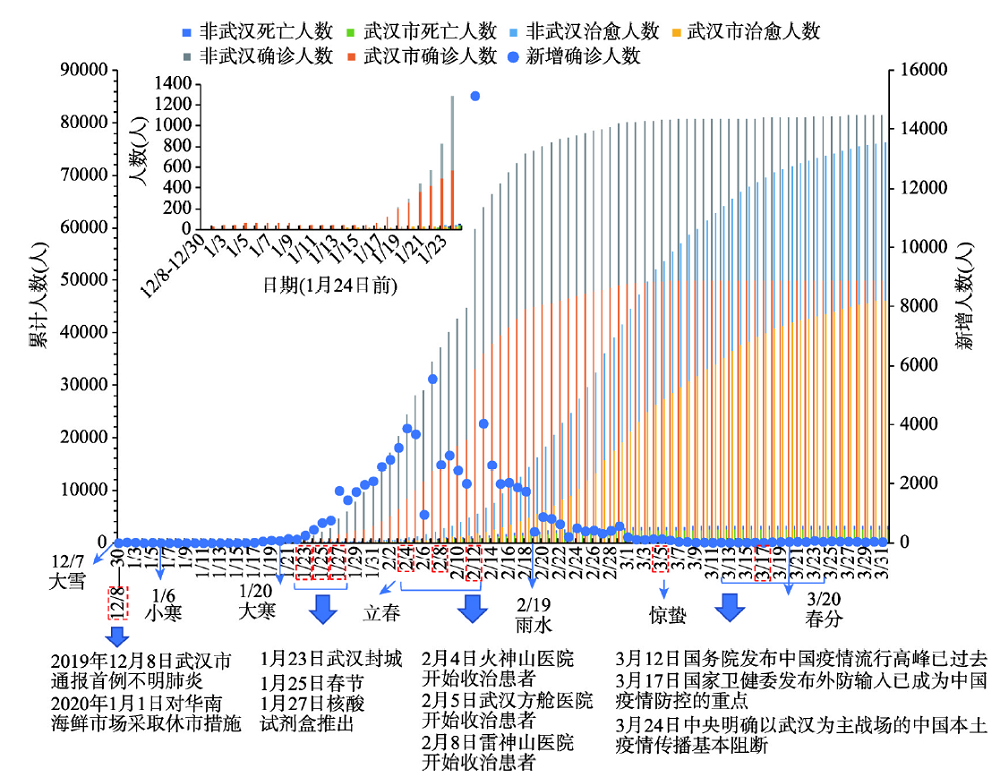
The sudden outbreak of the novel coronavirus disease (COVID-19), an unexpected emergency event in human society, is spreading globally and has severe impacts on human health and social development. Based on the confirmed COVID-19 cases' details manually extracted from the official reports and the relevant Point of Interest (POI) data, this paper aims to explore the sociodemographic characteristics of confirmed COVID-19 cases and examine the spatio-temporal evolution patterns on different spatial scales in China by using text analysis, spatial analysis and other methods. Furthermore, we provide targeted measures for prevention and control of this epidemic. The results indicate that: (1) In contrast to the twenty-four solar terms, the epidemic started at Heavy Snow, ran rampant in the Beginning of Spring, declined in the Awakening of Insects, and stagnated at the Vernal Equinox. It experienced four stages: the early period of Wuhan dominant outbreak, the middle period of cross-country diffusion, the later period of Wuhan dominant decline and the ending period of rare local epidemic transmission. (2) The spatial distribution presents a pattern of "one core, two arcs and multiple islands", mainly affected by the distance to Wuhan and the flow of population; the spatial evolution is manifested in the mode of "core outbreak - cluster occurrence - dispersion occurrence - point occurrence". The core aggregation area in each stage was located in Hubei province. Finally, by integrating the influencing factors and effective measures of the epidemic evolution in China, this paper proposes effective countermeasures for the spread of the current epidemic and the coordinated development of human resources in response to similar challenges in the future, which are manifested in instant response, coordinated cooperation, regular prevention and control, and strict prevention of importation, etc. Also, the directions of in-depth study in the future are pointed out.
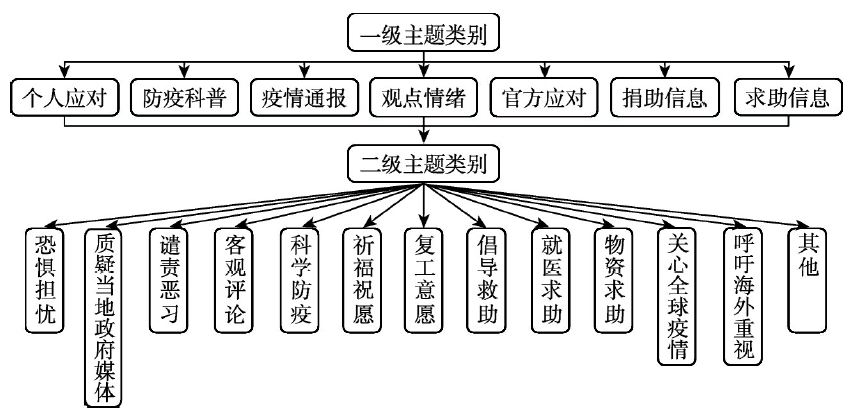
The COVID-19 epidemic is a global public health crisis. It is of practical significance to objectively understand the public's responses and regional differences in order to improve policy control and scientific governance during major public health threats. In this study, a topic extraction and classification model was constructed based on the Latent Dirichlet Allocation topic model and the Random Forest algorithm. Thirteen topics were identified about public opinion in the Chinese SINA microblog from January 9 to March 10, 2020. The regional distribution characteristics were explored in terms of the amount, space, time sequence, and content in major urban agglomerations including Hubei Province, Beijing-Tianjin-Hebei urban agglomeration, Yangtze River Delta, Pearl River Delta, Chengdu-Chongqing region, and some border ports of China. The results showed that the spatio-temporal distribution of public opinion is related to the severity of the epidemic, degree of population aggregation, and level of economic development. The response of Chinese people is rational and positive, and the spatial distribution within these regions is obviously different. Among the regional hotspots, Beijing-Tianjin-Hebei region is centred on Beijing; the Yangtze River Delta is centred on Shanghai, followed by Nanjing, Hangzhou and other hotspots; the Pearl River Delta is centred on Guangzhou and Shenzhen; and Hubei Province is centred on Wuhan. The time series of topics in each region are synchronously related, but there are differences in timing sequence and periodic fluctuation in response time and intensity. The imbalance of resource allocation caused by the sharp rise of relief information in the short term is prominent, and the differences in response policies of various urban agglomerations combined with regional characteristics are not obvious. We should continue to focus on public opinion on epidemic situations in key areas and accurately respond to local regions according to its actual conditions.
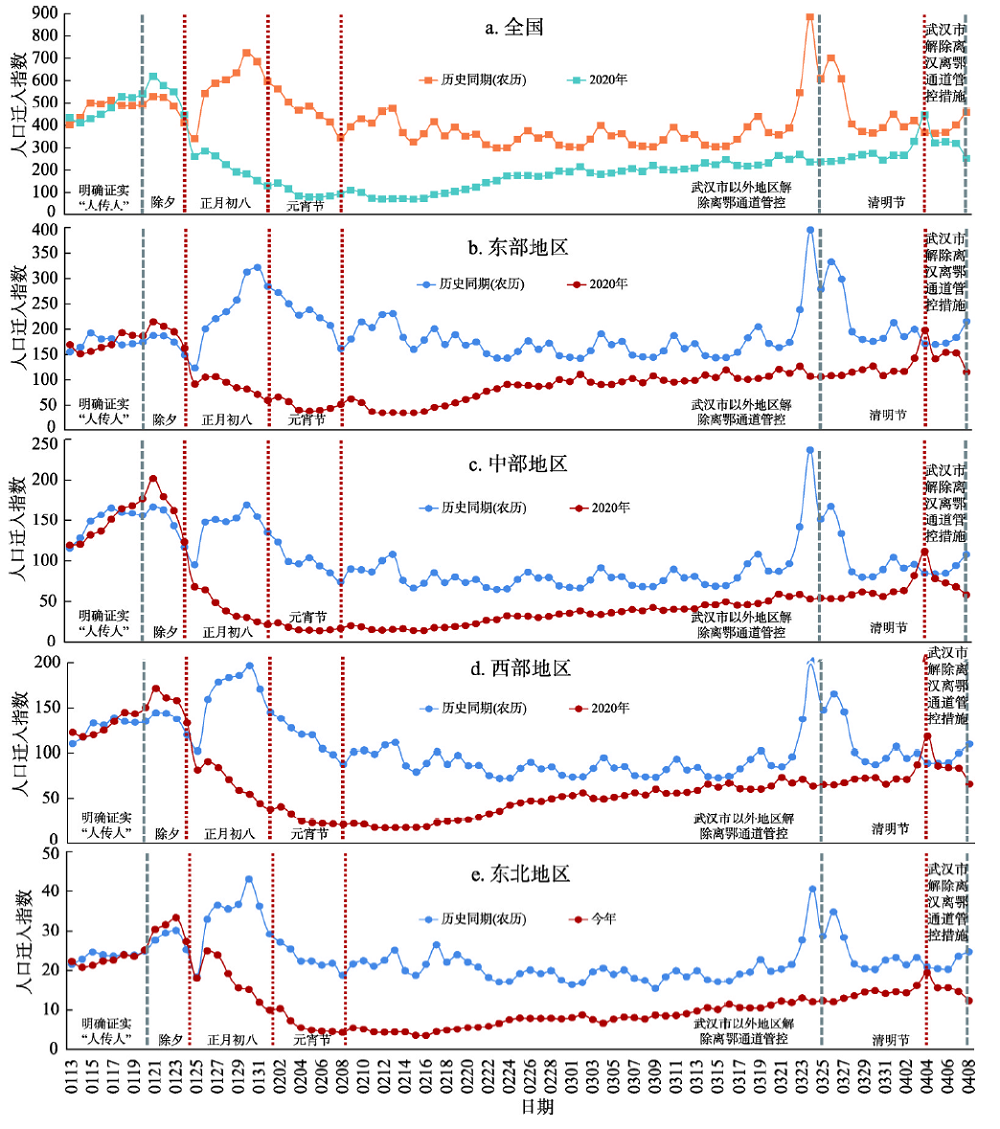
The COVID-19 epidemic in 2020 has a severe impact on China's national economic and social development. Evaluating the short-term impact of the COVID-19 epidemic and the recovery of China's economy and society, as well as revealing its spatiotemporal characteristics, can provide a strong support for the economic situation research and urban restoration of the normalized epidemic prevention and control stage. Based on Baidu migration big data from January 13 to April 8 in 2020 and that of the same period in history, this paper constructs the Relative Recovery Index (RRI) and Recovery Gap Index (RGI). Furthermore, it reveals the daily characteristics, stage characteristics, and spatiotemporal patterns of the short-term impact of the COVID-19 epidemic at multiple scales. The results are as follows: (1) The outbreak did not affect the travel rush before the Spring Festival. The process after the Spring Festival experienced a recovery stagnation period, a rapid recovery period, and a slow recovery period. The overall degree of recovery nationwide rose from less than 20% during the stagnation period to about 60% at the end of the rapid recovery period. The slow recovery period began on March 3, with a recovery index of over 70%. It will take a long time to fully recover to the historical level. (2) The intercity activities on weekends and in holidays were significantly weakened, especially in the central and northeastern regions. (3) The impact of the epidemic on each region is significantly different, in terms of the RRI, the western region > eastern region > central region > northeastern region. (4) The degree of recovery varies significantly between cities. From the Spring Festival to April 8th, the spatial pattern was high in the south and low in the north. According to the severity of the epidemic, Guangzhou, Shenzhen and Chongqing are in the cluster of High confirmed case-High recovery; Hebei, Tianjin, Heilongjiang, Henan, Anhui and Hunan are in the cluster of Low confirmed case-Low recovery. (5) With the effective control of the epidemic, the recovery gap has shifted from the large-scale insufficiency of labor force in the urban agglomerations such as Beijing-Tianjin-Hebei, the Yangtze River Delta, and the Pearl River Delta into the insufficiency in the central cities and some provincial capital cities. The results of this paper show that the use of spatiotemporal big data for real-time impact assessment of major public health emergencies have good application prospects.
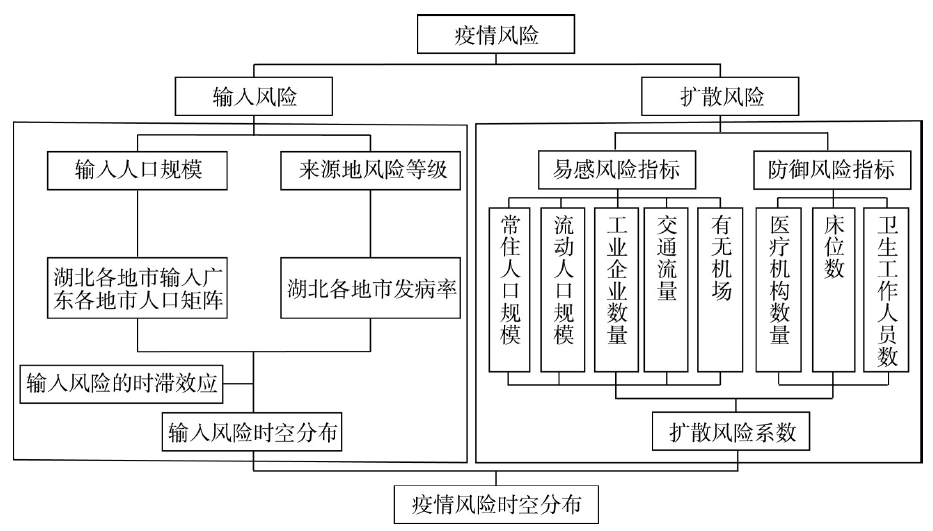
Population migration, especially population input from epidemic area, is a key source of the risk related to the COVID-19 epidemic. Taking Guangdong Province as an example, this paper utilizes big data on population migration and the geospatial analysis technique to develop a model to conduct spatiotemporal analysis of COVID-19 risk. The model considers the risk differences among the source cities of population migration as well as the heterogeneity in the socioeconomic characteristics of the destination cities. It further incorporates a time-lag process based on the time distribution of the onset of the imported cases. The model can predict the evolutional trend and spatial distribution of the COVID-19 risk for a certain time period in the future and support the future planning and targeted prevention measures. The research findings indicate that: (1) The COVID-19 epidemic in Guangdong reached a inflection point on January 29, 2020, and then it showed a gradual decline. (2) Based on the time-lag analysis of the onset of the imported cases, there is a time interval between the case importation and the illness onset, and the cases with an interval of 1-14 days account for a high proportion. (3) There are obvious spatial differences in the risk of epidemics, based on their imported risk, susceptibility risk, and risk resisting ability. (4) The connection and the scale of population migration as well as the transportation and location factors of the cities in Guangdong's prefecture-level cities and the source regions of the epidemic, all have significant impacts on the risk classification of the cities in the province. The first-tier cities such as Shenzhen and Guangzhou are the high-risk areas. The cities in the Pearl River Delta that are adjacent to Shenzhen and Guangzhou, including Dongguan, Foshan, Huizhou, Zhuhai and Zhongshan, are the medium-risk cities. The eastern, northern, and western parts of Guangdong, which are outside the metropolitan areas of the Pearl River Delta, are classed into low-risk areas. Therefore, the government should take targeted prevention and control measures in different regions based on local conditions and risk classification so as to ensure people's daily life and wellbeing to the greatest possible extent.