Physical geography is a basic discipline of natural science. Since its research object is the natural environment, it is closely related to human survival and development. China's natural environment is complex and diverse; therefore, according to national demand and regional development needs, physical geographers have also made remarkable achievements in applied foundation and application, making important contributions to the planning of national major economic construction and social development, protection of macro-ecosystem and resources and environment, and regional sustainable development. This paper summarizes the practice and application of physical geography in China in the last 70 years (1949-2019), differences between the natural environment and natural zoning, land use/cover change, natural disasters and risk prevention and control, the process of desertification and its administration, lower-yield field transformation of Huang-Huai-Hai Plain, engineering construction of permafrost areas, geochemical element abnormity and endemic disease prevention and control, positioning observation of natural geographical factors, geographical spatial heterogeneity identification, and geographical detector. Finally, it proposes the future application research directions of physical geography.
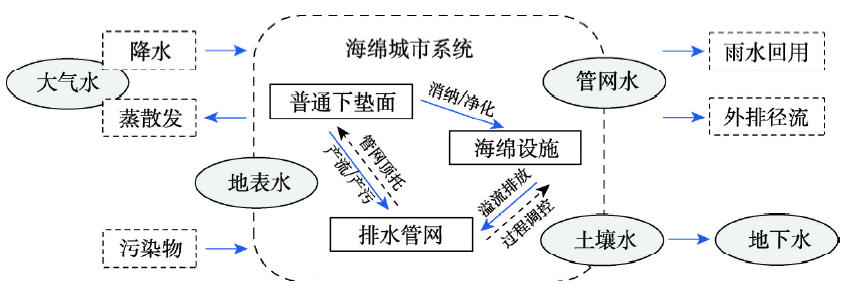
The essence of the sponge city construction is the reconstruction of the urban water system. The most fundamental and important issue in sponge city research is to clarify the hydrological processes involved in the sponge city system. This study defines the connotation of the sponge city system, analyzes the input and output items of the sponge city system, and discusses the hydrological processes involved in the sponge city system, that is, the transformation processes of the "Five-water" (atmospheric water, surface water, soil water, drainage water, and ground water) in the sponge city construction area. And then the research status and future research points of the sponge city system are systematically summarized from the following five aspects: precipitation and pollutant input, water quantity and quality conversion of sponge facilities, runoff monitoring and flow concentration parameters of drainage pipe network, runoff and pollutant discharge processes, and ecological benefit and groundwater recharge in the sponge city construction area. This study is helpful to the basic theoretical research and the engineering practice of the sponge city construction, as well as to the transformation of urbanization development in China.
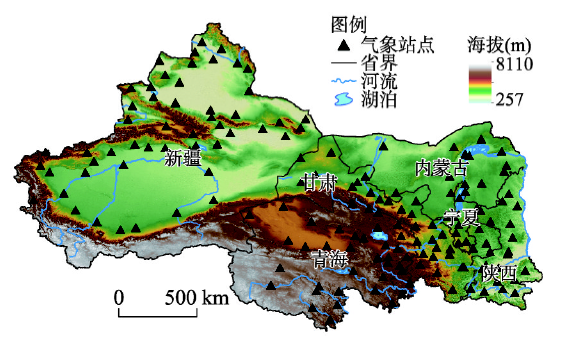
The mean global surface air temperature data indicate that there might be a global warming hiatus during 1998-2012. However, whether it existed around the world is still controversial, and the characteristics of the hiatus in Northwest China remain unclear. Based on the in-situ observation data of air temperature from 1960 to 2019, we analyzed the characteristic of hiatus in Northwest China through the cumulative anomaly curve, the Mann-Kendall test, Move-t test, the Yamamoto test and the linear trend estimation. The results showed that the statistically significant change-point of the annual mean air temperature in Northwest China was in 1986, 1996, and 2012, respectively. The air temperature suddenly rose in 1996, and then kept stable from 1998 to 2012. The annual mean air temperature showed an obvious cooling trend by -0.20 ℃ decade-1 in Northwest China from 1998 to 2012. Meanwhile, the annual mean air temperature in winter had the largest decrease rate and that of summer increased. The east of Northwest China displayed the most significant cooling during 1998-2012, and the Tibetan Plateau was still heating up at the same time. The air temperature of Northwest China rose substantially after 2012, especially in winter, and southern Xinjiang experienced the strongest warming during 2012-2019. Generally speaking, the warming hiatus was evident in Northwest China during 1998-2012 except the Tibetan Plateau. Therefore, more attention should be paid to the marked upward trend in air temperature after the hiatus in Northwest China due to the crucial environment.
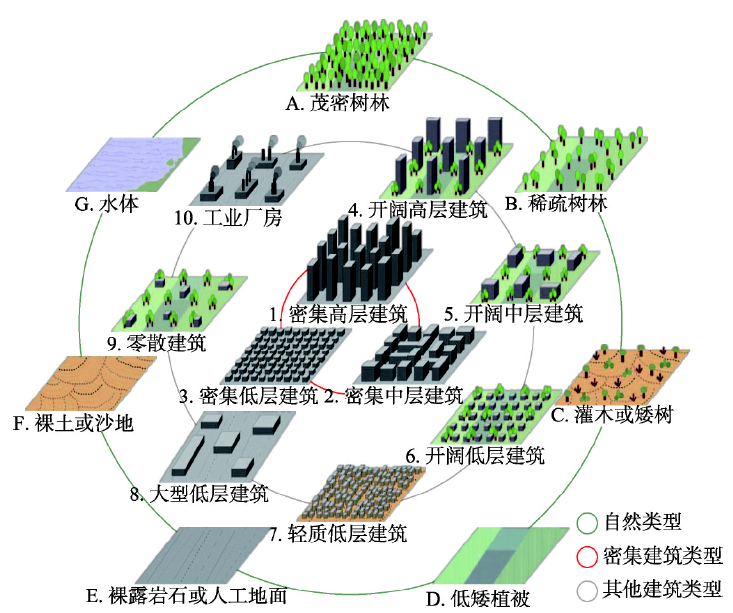
Since 2012, urban heat islands (UHIs) over various cities have been re-investigated under the local climate zones (LCZ) concept. However, a systematic overview of the recent progress in terms of the LCZ-based UHI studies remains lacking. This status quo has considerably restrained the UHI studies across global cities in a more standard manner. Here we comprehensively reviewed the preceding LCZ-based UHI studies with statistical- and meta-analysis. The literature review indicates that LCZ-based UHIs have been conducted over more than 130 cities globally, mostly located in the middle latitudes (35°N-55°N) within Asia and Europe. These investigations focus either on the canopy layer UHI (represented by surface air temperature, SAT) or on the surface layer UHI (denoted by land surface temperature, LST) or both. The overview was conducted mainly from three aspects including the "data acquisition", "spatiotemporal pattern", and "associated control". Our further findings show that: (1) On "data acquisition", satellite thermal remote sensing is the most important technique for retrieving LST, with the percentage of studies that employ this technique accounting for 86.5%. But for SAT, the main approaches include measurements by fixed stations (42.5%) and mobile vehicles (19.2%) as well as simulations by models (38.3%), among which the approach by model simulation has received more attention; (2) On "spatiotemporal pattern", the mean difference between the maximum and minimum temperatures among various LCZs for SAT (3.1 K) is significantly lower than that for LST (9.8 K), with relatively high magnitudes in summer and winter compared with the other seasons for these two types of temperatures.Prominent "intra-LCZ heat islands" were observed for both the canopy and surface UHIs; (3) On "associated controls", most studies are still qualitative on the analysis of the relationships between LCZ-based UHIs and their controls (e.g., surface structure and fabric, land cover type, and human activity). Other potential controls such as building typology and adjacency among LCZ types remain less considered. We finally provided several prospects for the LCZ-based UHI studies. We hope this overview would be helpful for improving the understanding of the current progress and upcoming prospects for the LCZ-based UHI studies.
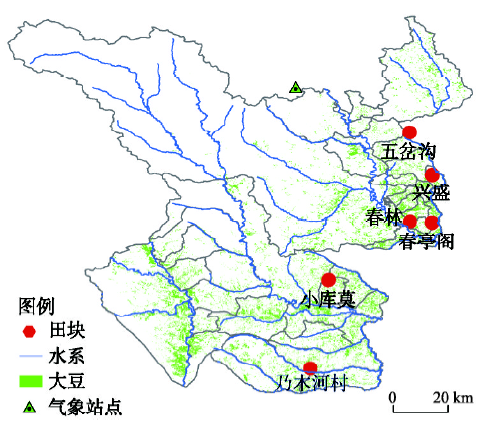
The frequent occurrence of chilling injury has serious impacts on national-level food security, and it mainly affects the grain yield in Northeast China. Timely and accurate measures are desirable to assess the large-scale impacts, which are the prerequisites for disaster reduction and production recovery. Therefore, we propose a novel method to efficiently assess the impact of chilling injury on soybean. Inner Mongolia is taken as a case study. The specific chilling injury events was diagnosed to occur in 1989, 1995, 2003, 2009, and 2018. The 512 combinations of cold and field management simulation scenarios were established based on the localized CROPGRO-Soybean model. Furthermore, we constructed 1600 cold vulnerability models including CDD (Cold Growth Days), simulated LAI (Leaf Area Index) and yields from the CROPGRO-Soybean model. Finally, we extracted the maximum wide dynamic vegetation index (WDRVI) and corresponding date of the critical windows of early and late growing seasons in the GEE (Google Earth Engine) platform, converted the WDRVI into actual LAI of soybean pixel, and calculated the pixel yield and losses according to the corresponding vulnerability models. The findings show that the localized CROPGRO-Soybean model can accurately simulate the growth and development processes of soybean under different cold scenarios. The soybean yields were reduced due to changes in cold stress during the whole growth period (a decrease of 1-3 ℃), which were greater than those from the local cooling treatments (the temperature of 0 ℃ for 5 consecutive days which are randomly generated during four growth periods). Moreover, simulated historical yield losses in 1989, 1995, 2003, and 2009 were 9.6%, 29.8%, 50.5%, and 15.7%, respectively, which were very close (all errors were within one standard deviation) to the actual losses (6.4%, 39.2%, 47.7%, and 13.2%, respectively). The above proposed method was applied to evaluate the yield loss of 2018 at a pixel scale. Specifically, sentinel-2A image was used for 10 m high-precision yield mapping, and the estimated losses well characterized the actual yield losses from 2018 cold event. The results highlighted that our proposed method can efficiently and accurately assess the chilling injury impact on soybean at different spatial scales. The novel method is also effective for efficient assessment of the impacts of different disasters on other crops.
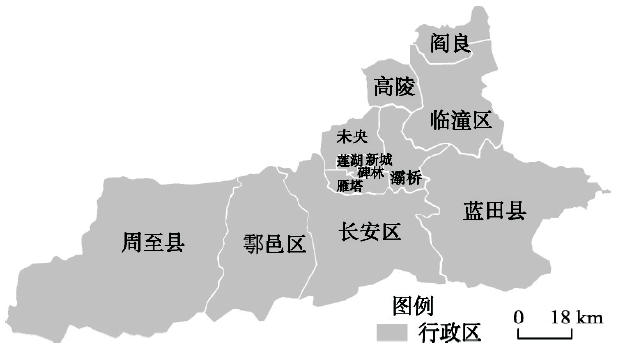
In order to study the characteristics of regional drought and flood and its impact on crop yield, this paper discusses the evolution law of drought and flood in each growth stage of crop and the impact of drought and flood in different growth stages on crop yield using the technology of information diffusion and chaotic time series analysis based on the comparison of SPEI and precipitation temperature homogenization index. With Xi'an as a typical region and corn as the research object, we analyzed the meteorological data and corn yield data from 1951 to 2015. The results show that: firstly, the trend of drought and flood in each growth stage of corn in Xi'an with time shows the form of wave crest and wavetrough alternately and a certain periodicity. Each growth stage of corn shows a trend of relative abundant water after 2008. Secondly, most of the growth stages of corn are in normal state, and the frequency is about 45%. The frequency maximum of severe drought is 4.62%, which occurred in emergence-jointing, and the frequency maximum of above moderate wetness is 15.39%, which occurred in the jointing-tasselling phase. Thirdly, the largest Lyapunov exponents of all growth phases are greater than 0. Time series of drought and flood indicate chaotic feature to a certain extent. Finally, the jointing-tasselling stage is compared with other growth stages, and the correlation between yield and drought and flood is obvious, which reflects the sensitivity of this stage to water to some extent. This research is of guiding implications to disaster prevention and yield reduction of corn in Xi'an city.
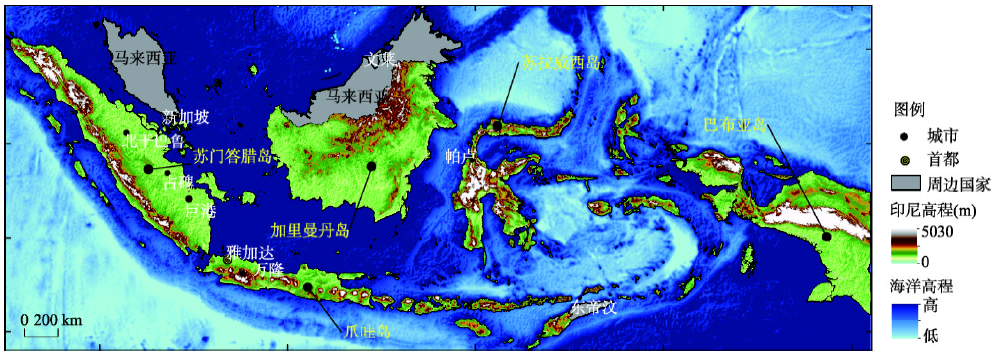
The occurrence and development of global active fires under the background of global warming is an important research content. Based on the Moderate Resolution Imaging Spectroradiometer (MODIS) C6 active fire point vector data (2001-2018) of Indonesia provided by the Fire Information Resource Management System (FIRMS) of the USA, the occurrence probability, intensity and response to the El Niño of Indonesian active fires were quantified and analyzed using the GIS-based fishnet method at a 1 km×1 km grid system, in order to reveal the spatio-temporal variations of active fire occurrence frequency in Indonesia during 2001-2018. The results showed that: (1) A total area of 22.79% was affected by active fire at least once in the past 18 years, which is called as "fire-affected area", while the rest was not impacted by fire according to the MODIS observations. The proportions of "fire-affected area" in the five major islands in a descending order were 32.93% for Kalimantan, 31.44% for Sumatra, 17.16% for Sulawesi, 9.50% for Java and 7.58% for Papua, respectively. The occurrence of active fire was dominated by low probability (1/18-6/18), typically between August and October, and widely distributed in various islands, which was primarily seen in Kalimantan and Sumatra. The number of grids in a medium probability (7/18-12/18) was small but intensively distributed, especially in the eastern lowland plains of Sumatra and the southern and southwestern coasts of Kalimantan. The girds of high probability were sporadically distributed in Indonesian islands, mostly concentrated in Java and Sulawesi. (2) The intensity of active fire was dominated by level-one (once per year) and level-two (2-3 times/year), followed by level-three (4-7 times/year). The active fires of level-one to level-five (1-22 times/year) were widely distributed in various islands, and primarily seen in Kalimantan and Sumatra, while the active fires (23-165 times/year) of level-six were concentrated in Java, Sumatra and Sulawesi. It is worth noting that the distribution of grids with different intensities diminished from the center to the periphery. In addition, the intensities of active fires in different probability groups were different. The low-probability of active fire was mainly 1 time/year, followed by 1-3 and 2-7 times/year for the medium and high probability, respectively. In particular, the intensity of level-six active fire only was observed in high probability grids. (3) Indonesia's active fires between August and October had different sensitivities to strong and weak El Niño, showing increased frequency and area of active fires. The stronger an El Niño event is, the higher the response of active fire will be. The islands in a descending order of sensitivity to active fire were Sumatra, Sulawesi, Kalimantan, Java and Papua.
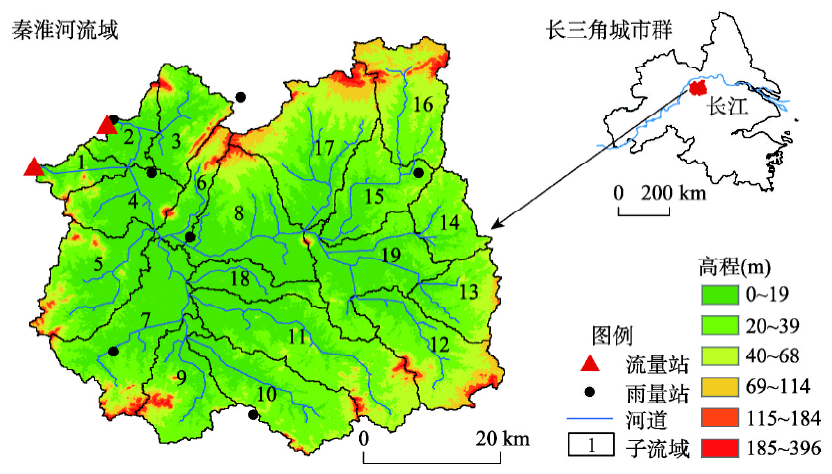
This paper used HEC-HMS hydrological model and statistical analysis method to examine the relationship between flood eigenvalues (i.e. flood volume, peak flow) and landscape pattern indexes of different landscapes. And on the basis of the above relationships, this paper constructed a flood ecological risk index to quantitatively calculate the basin's flood-landscape ecological risk. Then, the spatio-temporal risk change analysis of the whole basin and comparative risk analysis between selected sub-basins were performed. The Qinhuai River basin was selected as the study area, and two historical landscape distributions (2003 and 2017) were used in this study. The results showed that, for different landscapes, there are certain relationships between landscape patterns and flood eigenvalues, for different landscapes, the response indexes and degrees are different. From 2003 to 2017, the flood-landscape ecological risk increased and showed significant spatial differences. Landscape patterns have significant impacts on regional floods. In urbanization process, avoiding forming large-scale landscape patches, increasing landscape abundance of landscapes, and increasing contact area between different types of landscape patches can be helpful to reduce the negative effects of the increase of urban landscape area on flood.
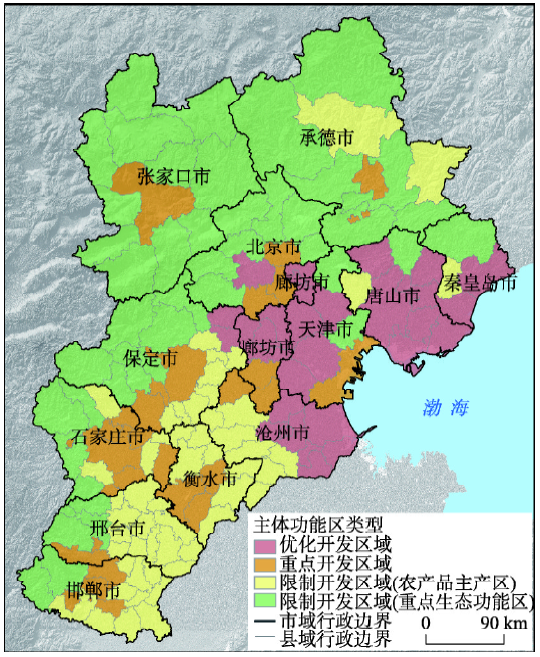
Environmental stress is used to indicate the integrated pressure on regional environmental system caused by various pollutant outputs during human life and production activities. Based on the pollutant emission and socio-economic database of the counties in Beijing-Tianjin-Hebei (BTH) region, this paper comprehensively calculates the environmental stress index (ESI) by entropy weight method at the county scale, and analyzes the spatio-temporal pattern and the differences among four types of Major Functional Zones (MFZ) in this region from 2012 to 2016. In addition, the socio-economic driving forces of environmental stress is quantitatively estimated by means of geographical weighted regression (GWR) method based on the STIRPAT model framework. The results show that: (1) The situation of environmental stress in the BTH region had been significantly alleviated, with an ESI decline of 54.68% since 2012. The decline was most significant in central urban areas of Beijing, Tangshan, Tianjin and Shijiazhuang, and Binhai New District. The degree of environmental stress in counties decreased gradually from the central urban areas to the suburban areas, and the high-level stress counties were eliminated in 2016. (2) The spatial spillover effect of environmental stress had been further enhanced on the county scale since 2012, and the spatial locking and path dependence emerged in cities of Tangshan and Tianjin. (3) Urbanized zones (development-optimized and development-prioritized zones) are the major bearing areas of environmental pollutants in the BTH region, with ESI accounting for 65.98% of the whole region, which should be focused on prevention and control of environmental pollution. (4) The controlling factors of environmental stress in counties include population size and economic development level. In addition, technical capacity of environmental disposal, agricultural production input intensity, territorial development intensity and urbanization had a certain degree of influence. (5) There was spatial heterogeneity in the driving effects of various driving factors on the environmental stress. Therefore, it is necessary to adopt differentiated environmental governance and reduction countermeasures from emission sources, according to the intensity and spatial difference of driving forces, so as to improve the accuracy and adaptability of environmental collaborative control in the BTH region.
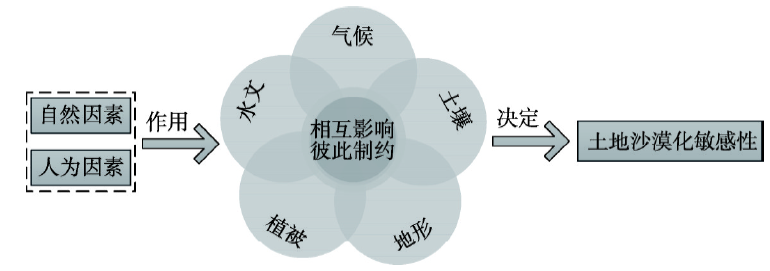
The sensitivity assessment of land desertification is one of important contents of monitoring, preventing and controlling desertification. This paper took the arid region of Northwest China as the study area. Based on the RS and spatial analysis technology of GIS, we built a comprehensive index system of desertification sensitivity for evaluation on "soil-terrain-hydrology-climate-vegetation". The spatial distance model (SDM) was used to calculate the desertification sensitivity index (DSI). Then, spatiotemporal change of land desertification sensitivity in the study area covering 2000, 2005, 2010 and 2017 was quantitatively assessed. On this basis, the main driving factors were analyzed by using the geographic detector. The results showed that: (1) terrain, soil, climate, vegetation and hydrology affected each other, which were the basic conditions for the distribution and changes of sensitivity to desertification in the study area. (2) On the whole, the desertification sensitivity showed a distribution pattern of low around and high inside. The low sensitivity regions were mainly distributed in the five major mountain ranges (i.e. Altai Mountains, Tianshan Mountains, Kunlun Mountains, Altun Mountains and Qilian Mountains), and Junggar Basin, Tarim Basin and Inner Mongolian Plateau belonged to the high sensitivity regions, including the back-land of Taklamakan Desert, Badain Jaran Desert and Tengger Desert. Besides, the spatial distribution of desertification sensitivity had obvious regionality, and high and low sensitivity regions had clear boundary and concentrated distribution. (3) In terms of spatiotemporal evolution, changes of desertification sensitivity since 2000 was mainly stable type, and the overall sensitivity showed a slow decrease trend, indicating that the potential desertification regions decreased year by year and some achievements had been made in the control of regional desertification. (4) Among the driving factors affecting study area, soil and climate played a direct role, which were the most important influencing factors, and vegetation was the most active and basic factor that changed desertification sensitivity. In addition, topography and hydrology played a role in restricting the changes of desertification sensitivity, while socio-economic factors were affecting the regional desertification sensitivity, and their effects were gradually strengthened. In general, desertification has been effectively controlled in the study area, and positive results have been achieved in desertification control. However, against the backdrop of intensified global climate change and new normal of socio-economic development, the monitoring, assessment and control of desertification in China still have a long way to go.
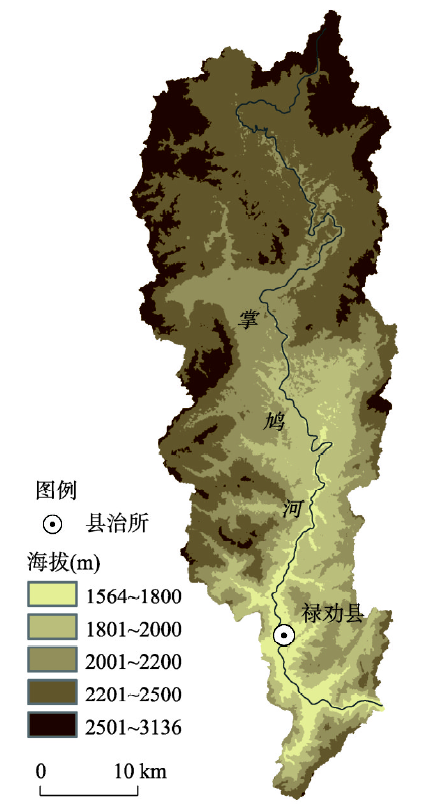
The reconstruction of land use/land cover change within small-scale areas during historical periods based on multi-source data is of great significance for obtaining an in-depth understanding of the mechanisms driving land use change and their effects on the environment and climate. Herein, we reconstructed the evolution of settlement patterns at the basin scale, the amount and spatial distribution of cropland at the settlement scale, as well as the cropland pattern at the basin scale. Typical small and medium-scale watersheds in the mountainous areas of Yunnan Province were used as the study area. Abided by historical documents, field investigation data, historical geographical research results, archival data, modern statistical data, and basic geographical data, we considered regional natural factors (slope and altitude) and anthropogenic factors (population, policies, agricultural technology, and distance between croplands and settlements) and built a gridded model for cropland reconstruction in historical periods in the small-scale mountainous areas. We then reconstructed gridded cropland patterns with clear temporal and spatial attributes for the past 300 years. The results showed that: (1) over the past 300 years, the area of cropland in the Zhangjiu River Basin has increased 6.3 times, and the reclamation rate increased from 2.1% in 1700 to 15.6% in 1978. (2) The cropland area differed considerably in various terrains. The cropland area in mountainous and semi-mountainous areas was the largest and increased rapidly, whereas the cropland area in the flatlands and the middle and lower reaches of the valley area increased slowly, which was caused by a combination of factors, such as the natural environment, population, policies, and agricultural technology. (3) The results were verified using the total cropland area and per capita cropland area. The gridded reconstruction model devised in this study can be used as a reference for simulating historical cropland in small-scale areas with distinct spatial and temporal attributes using gridded datasets.
Landuse change is an essential driving force of global climate change. Dynamic simulations are helpful for understanding and explaining the changing rules and characteristics of the land system. The "Grain to Green Program" (GTGP) is a critical contributing factor to landuse change in China's mountainous areas. Presently, the deficiency of integrated social and spatial approaches in the simulation of the "GTGP" limits the spatial accuracy of the social benefits simulation and its subsequent research. The accurate simulation of the "GTGP", by combining social and spatial approaches, can provide scientific evidence for the completion of this project. Taking Tongdu Town, Dongchuan district in Yunnan province as the research area, this study identified three kinds of agents: farmers, farmer households, and the government based on census, geographical information and field survey data. In addition, this research constructed a regional spatial simulation of the "GTGP" implementation based on agent-based model. It conducted spatial simulations of Tongdu Town from 2011 to 2015, including the annual income of farmer households, the willingness of farmer households and the government towards the program, and the spatial processes implementation of the "GTGP". The results showed that the implementation of the "GTGP" was mainly related to the slope, the traffic, and the income of farmer households. Specifically, 81.47% of the "GTGP" program conducted in this areas was on slopes of 25°-30°, and 56.37% of them was 0-2 km away from the road with convenient traffic conditions, and the proportion of the "GTGP" areas with low annual income of farmers was relatively high. The correlation between "GTGP" areas and soil fertility was low. The implementation of the project significantly enhanced the revenue of the study area, with an average household income increase of 1475 yuan from 2010 to 2015. The spatial accuracy of the simulation results was 91.12%. The spatial simulation methods constructed in this study can provide references for the implementation of the "GTGP" in other regions, which can contribute to applications of ecological protection and targeted poverty alleviation programs in China.

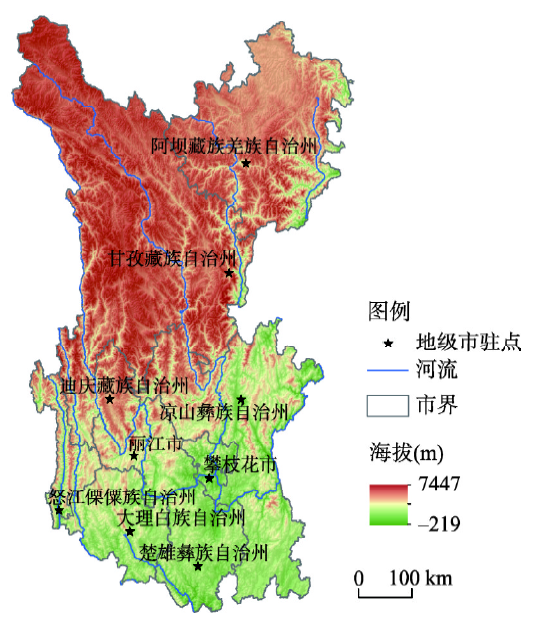
As a part of the supply of ecosystem services, land and water resources are an important factor restricting economic development in mountainous areas. Taking the Hengduan Mountains Area as a case study, we evaluated the degree of matching between land and water resources and economic development using the Gini coefficient method. Furthermore, the sensitivity of economic growth to land-water factors was analyzed by establishing an extended Cobb-Douglas function based on the individual stochastic effect model. In addition, the growth drag model was introduced to measure the restriction of land-water resources on economic development in the study area quantitatively. The research produced several important results: (1) From 2006 to 2015, the fluctuation ranges of the Gini coefficient between land and water resources and gross domestic product (GDP) in the study area were 0.265-0.298 and 0.389-0.424, respectively. The satisfaction by water resources in different industries was relatively reasonable, but the utilization of land resources for economic development was not satisfactory, especially in the secondary and tertiary industries. (2) The sensitivity analysis results showed that the elasticity of land resources in the region was about twice that of water resources. The cumulative contribution rate of land resources was significantly higher than that of water resources, and the contribution of land resources to economic growth was greater than that of water resources. (3) The average growth drag values of land and water resources were 0.012 and 0.022, respectively, indicating that both land and water resources had obvious restraining effects on the economic development, which was greatly restricted by land resources. The research showed that effective development of mountainous areas in China should focus on the sufficient land-water resources demanded by economic growth. Utilizing the potential of land-water resources and increasing their supply can reduce restriction on economic growth and promote sustainable development.
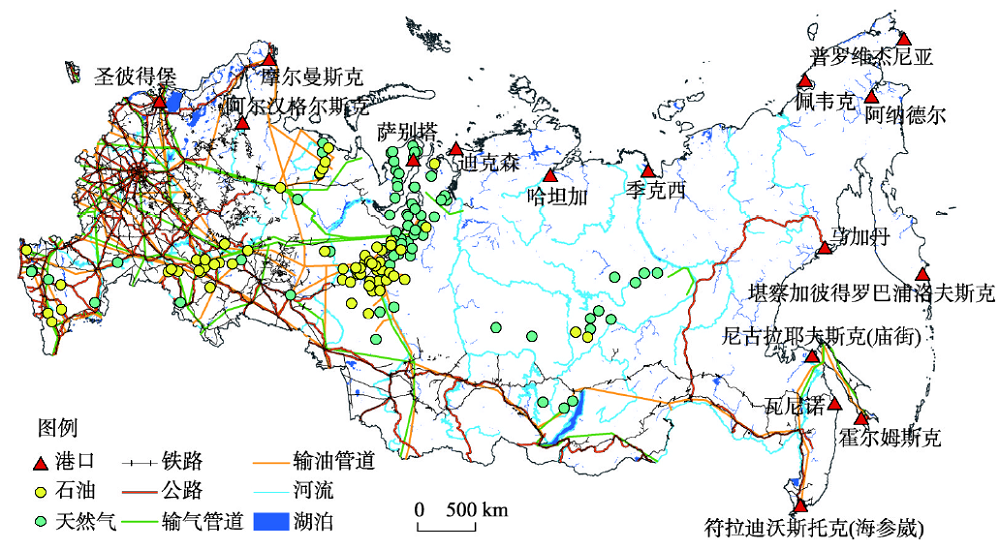
Russia is rich in oil, gas resources, and areas with unproven reserves, and also has a huge potential for application of oil and gas resources. As climate change intensifies, it would be possible for navigation in Arctic, and Russia hopes to vigorously develop its energy trade through the Arctic Sea Route. In this study, the Russian transportation network was regarded as the focus of connecting resources and ports, and spatial statistical method was used to describe the spatial distribution characteristics of Russian oil and gas resources. By means of grid cost distance, weighted average travel time and potential location advantage, the accessibility of oil and gas resources in each port was quantified, and the conclusions were drawn as follows. (1) The oil and gas resources were concentrated in the Western Siberian Plain. The accessibility of ports in the whole region of Russia was characterized by "high in the west and low in the middle". (2) The resource accessibility of the northeast port of Russia was generally poor, and the resource accessibility of the northwest port was better than that of the northeast one. Taking oil and gas resources, geographical location and project cooperation into account, we focused on the construction of three ports: Sabetta, Murmansk and Vladivostok. (3) The density of the nearby traffic network affected the resource accessibility of the port. With the climate warming, the melting of frozen soil, and the gradual implementation of the "Polar Silk Road" between China and Russia, it would be possible for further improvement in the resource accessibility of ports in the Far East region of Russia in the future.