GIScience inherits the spatial analysis tradition of geography. Given that "spatial is special", GIScience needs to highlight spatial effects when constructing methods for geographical analysis. The research presents an explicit definition of spatial effect. By formalizing core GIScience concepts including space, location, field, distance, and region, we identify four types of spatial effects, namely spatial heterogeneity effect, neighbor effect in spatial dependence, distance decay effect in spatial interactions, and scale effect in spatial zoning. A unified framework is constructed to cover the four spatial effects based on the inherent linkages among them. We argue that spatial heterogeneity effect is the most fundamental one. While spatial dependence and spatial interaction are two basic geographical processes that represent the second-order relationships between two locations, neighbor effect and distance decay effect reflect the impacts of space. Scale effect is raised when aggregating attributes using regional units. Hence, the four types of effects form a hierarchical system. From a methodological perspective, this paper summaries related GIScience tools that implement different effects, and emphasizes the value of geospatial artificial intelligence for revealing and quantifying spatial effects.
The earth surface oxygen concentration on the Qinghai-Tibet Plateau is the result of the combined effect of multi-factors, such as elevation, topography, climate, water, vegetation, and soil, among them, the relative contributions of altitude, temperature, vegetation coverage and leaf area index are -39.58%, 35.50%, and 24.92%, respectively. The earth surface oxygen concentration on the plateau primarily shows the difference from southeast to northwest, which is mainly related to the effect of vegetation on oxygen production depending on precipitation; secondly shows the difference on east-west extension and north-south turnover, which is mainly related to the effect of atmospheric pressure on relative oxygen concentration depending on temperature and terrain; thirdly shows the vertical zonation, which is mainly related to the effect of atmospheric pressure on the relative oxygen concentration depending on the terrain and temperature, bond with the effect of vegetation on oxygen production depending on temperature and precipitation. The earth surface oxygen concentration can quantitatively reveal the spatio-temporal pattern of the physiographical characteristics of the earth surface. Accordingly, we divide the natural zone of the Qinghai-Tibet Plateau into 3 first-grade regions and 17 second-grade zones. In the southeastern subtropical forest-forest steppe region, including 2 second-grade zones, the annual average oxygen concentration is 20.35%, the average oxygen concentration in July is 20.45%, and the average oxygen concentration in January is 20.27%. In the eastern temperate forest-steppe region, including 5 second-grade zones, the annual average oxygen concentration is 20.10%, the average oxygen concentration in July is 20.23%, and the average oxygen concentration in January is 20.00%. In the western cold temperate grassland-desert-steppe region, including 10 second-grade zones, the annual average oxygen concentration is 20.00%, the average oxygen concentration in July is 20.10%, and the average oxygen concentration in January is 19.91%.
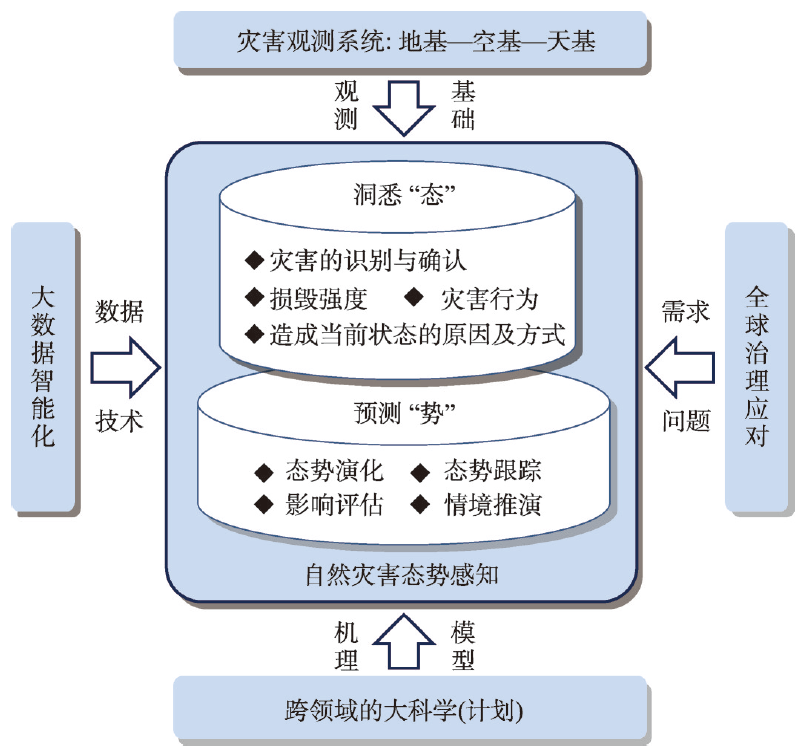
Natural disasters and normalized extreme weather have emerged as the main threats to human life with the onset of the Anthropocene. The technological drive of big data and intelligence, the disciplinary basis of big science (planning) and the demand pull of globalized governance and response together constitute the main theme of natural disaster research in the new era. The paper puts forward the concept of natural disaster situational awareness and its two levels: situation understanding and situation predicting. In situation understanding, the paper identifies the differences and connections between traditional disaster observation and big data situational awareness; and systematically compares the research and practice of big data in disaster situational understanding of typhoons, floods, earthquakes, and extreme heat, using social media, cell phone signaling, and video surveillance as examples. In situation predicting, the paper summarizes a series of big data observation, machine learning and mechanical model integration methods and validates them with the evolution simulation of urban flooding events as an example. At the regional or global scale, it proposes that cross-domain integrated situational awareness and prediction should be carried out for some future scenarios defined by the big science (program) and serve the sustainable development of the region; especially, to use the human-earth coupling model to sense the cascading impact and remote effect of disasters on socio-economy, which can be used to eliminate and address non-traditional security threats. Finally, it is recommended that the state should establish relevant research institutions to promote the sharing and application of disaster big data, and carry out the construction of disaster standard knowledge base and training library. It is recommended to further promote the integration and application of mechanism models, big data and machine learning, and promote the coupling of natural disaster human-terrestrial systems to enhance the social governance and decision support capability of natural disasters in China.
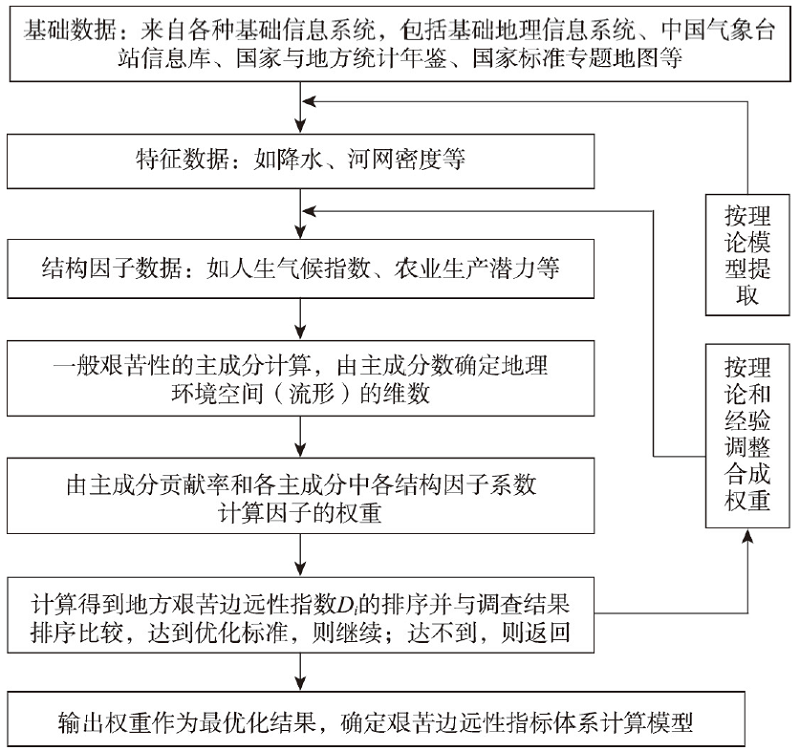
This paper summarizes the authors' theoretical understanding of management over the past two decades on the scope and classification of less developed areas in China. As a theoretical exploration of geography, we first focus on the geographical basis and development possibilities of less developed areas in China. In terms of methodology, we have studied the relationship between regional output and regional characteristic elements, defined the three geographical natures from the aspects of natural geographical environment, traffic, location, social development, etc., scientifically constructed an evaluation index system for regional development, and developed related geographic information science data mining methods. The important finding is that in modern regional development, the importance of the first nature factors is close to 70%, the contribution rate of the second nature factors is about 17%, and that of the third nature factors that triggered the third industrial revolution is about 13%. This verifies that the first nature factors play an important role in regional development, which means that regional development faces the locking effect of the first nature and the necessity of geographic engineering transformation. To achieve regional innovation and development, it is necessary to rely on the evolution of geographical natures. At present, China's regional development has been in the innovative development stage of improving the per capita education level and developing regional informatization, and the key to the policy is to promote new urbanization and enhance rural revitalization.
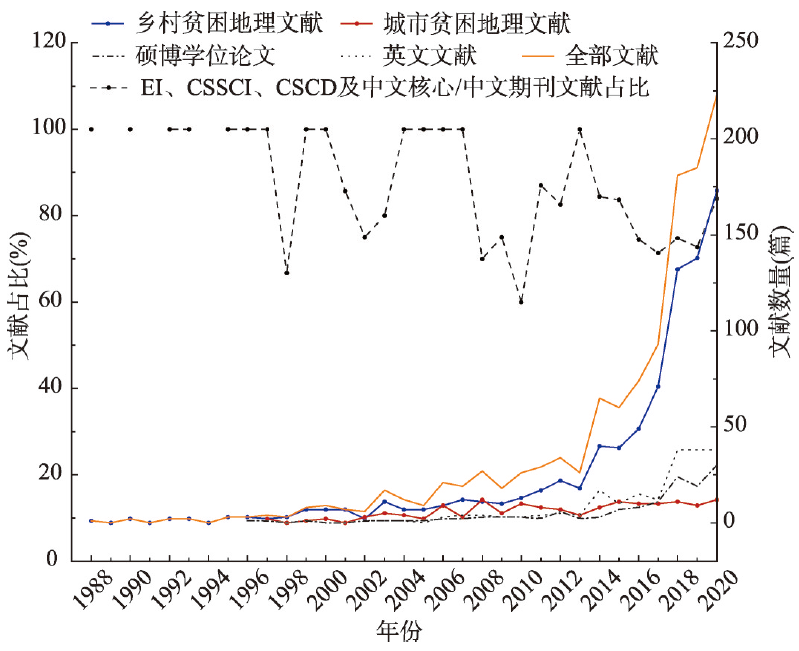
China's success in poverty reduction has a worldwide impact. This paper reviewed the characteristics and academic contributions of China's poverty geography research, and summarized its disciplinary paradigm. This study has an important disciplinary value for geographical research on relative poverty and effective link of poverty alleviation achievements with rural revitalization. Based on the data in CNKI and a core database in Web of Science from 1988 to 2020, the knowledge map analysis of China's poverty geography literatures was presented through CiteSpace6.1.R2. Results show that: (1) With the increasing practice of poverty reduction, China's poverty geography research has gradually increased in the number of publications, institutions and authors, indicating that poverty geography research is driven by demand; (2) Due to the differences in urban and rural poverty reduction policies, China's rural poverty geography and urban poverty geography have developed distinctive research patterns, reflecting the urban-rural duality in poverty geography research; (3) In response to the adjustment of poverty reduction policies and the transformation of the main social contradictions, the paradigm of poverty geography research has undergone a change in China; (4) Under the framework of the disciplinary paradigm of geography, the poverty geography research is considered to be the common field of development geography and poverty geography. Development geography aims to construct the poverty reduction process, method and decision-making, while poverty geography focuses on deconstructing poverty process, method and decision-making. These "disciplines" share a common research basis in addition to diverse academic discourse expressions.
The diurnal freeze-thaw cycle of near-surface soils on the Qinghai-Tibet Plateau (QTP) significantly affects the exchange of water and energy between the soil and the atmosphere, which is important for an understanding of the response of the QTP to climate change. Based on MODIS, AMSR-E and AMSR-2 data, we first obtained the diurnal calibration coefficients from AMSR-2 to AMSR-E in the Qinghai-Tibet Plateau (QTP), and then used the Fourier nonlinear model to fusion diurnal freeze-thaw index with surface temperature, and further obtained the diurnal freeze-thaw condition of near-surface soils at 1 km resolution per day, and finally carried out a study on the spatial and temporal changes of diurnal freeze-thaw cycles of near-surface soils in the QTP between 2002 and 2020. The results indicate that: (1) The improved calibration method of AMSR series sensors in this paper is more suitable for the QTP region than the calibration method for global scale. The accuracy of the freeze-thaw product obtained by fusion using the Fourier nonlinear model was 80.96% for diurnal freeze-thaw discrimination, which was 3.95% higher than that of the unfused product. (2) The frequency of diurnal freeze-thaw cycles in the seasonal freeze-thaw process of near-surface soils on the QTP varies spatially, with the highest frequency occurring in the southern Tibetan region and the Qinghai plateau, and is cyclical in time, the high frequency region shows a shift to the northwest when warming and to the southeast when cooling. (3) In the past 20 years, the trend of diurnal freeze-thaw days in different parts of the QTP is varied, with the northern Tibetan plateau, southern Tibetan alpine region and eastern Tibetan region showing an increase and the Qinghai plateau showing a decrease. (4) There are regional differences in the beginning of the continuous diurnal freeze-thaw cycle on the QTP, with the beginning of the thawing process being gradually delayed from east to west and the beginning of the freezing process being gradually delayed from west to east. In the past 20 years, the starting time of continuous diurnal freeze-thaw cycle in near-surface soils has been changing, with 0.17 d/a earlier during thawing and 0.18 d/a earlier during freezing.

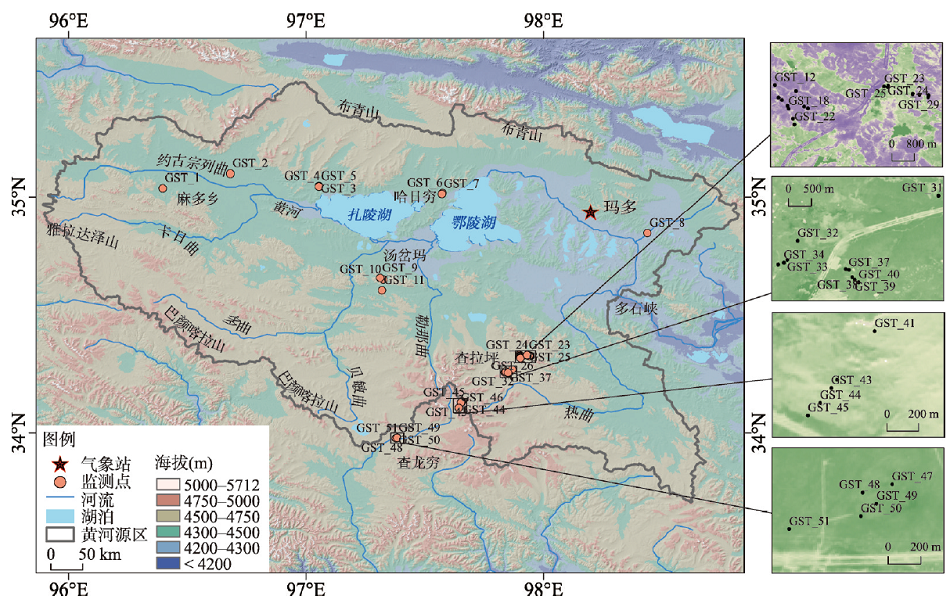
Permafrost is a product of long-term thermal exchanges between the ground surface and atmosphere; thus, the ground surface thermal regime and freeze-thaw cycles highlight the complex thermal influences resulting from multi-interactions between the atmosphere and underlying surface characteristics and reflect the variation in the thermal regime of the near-surface shallow frozen soils. Based on the ground surface temperature observations from 51 sites in the Headwater Area of the Yellow River (HAYR), the ground surface freezing and thawing indexes were calculated, the freezing and thawing processes were analyzed, and their spatial differentiations were explored. The results showed that the mean annual ground surface temperature (MAGST) in the HAYR ranges from -3.06 to 1.31 °C, exhibiting extremely strong spatial differentiation, the differentiation of ground surface temperature is mainly affected by elevation, latitude, and NDVI (P < 0.001) on a regional scale, the MAGST decreases at a vertical lapse rate of about 0.7 ℃·(100 m)-1. The larger value of NDVI represents a better condition of vegetation, leading to lower ground surface temperature in summer and higher ground surface temperature in winter. The ground surface freezing index ranges from 851.9 to 1906.6 °C·d and is averaged at 1253.3 °C·d, the frost day on the ground surface varies from 54 to 219 d with an average of 137.1 d, and the ground freezing index is slightly correlated to elevation and latitude. The ground surface thawing index ranges from 388.4 to 1727.2 °C·d, with an average of 1039.3 °C·d, and the thawed day on the ground surface ranges from 61 to 156 d, with an average of 128.8 d. The ground surface thawing index is negatively correlated with elevation, latitude, and longitude. Furthermore, the influence of elevation and NDVI on the thawing index is the largest. The onset date of ground surface thawing is greatly affected by topography and local factors, occurring mainly from mid-March to mid-May, the spatial heterogeneity of the onset date of ground surface freezing is less than the onset date of ground surface thawing, and the onset date of ground surface freezing occurs from the end-September to end-October. The thawing N-factor (Nt) ranges from 0.87 to 1.60, which is mainly concentrated at 1.2 to 1.5 with an average of 1.29±0.21. The freezing N-factor (Nf) ranges from 0.49 to 0.90, which is mainly concentrated at 0.5 to 0.65 with an average of 0.60±0.18. The ALT calculated with the classic Stefan Equation ranges from 0.99 to 2.72 m with an average of 1.68±0.45 m, which is influenced by dense vegetation and fine-grained saturated substrates. The correlation between the calculated and observed ALT is 0.886, with a deviation from 0.026 to 0.547 m. The monitoring network of ground surface temperature and relevant findings in this study could provide fundamental data and scientific evidence for the alpine ecological environment, thus likely facilitating the study of accurate mapping of high-elevation permafrost in the Headwater Area of the Yellow River.
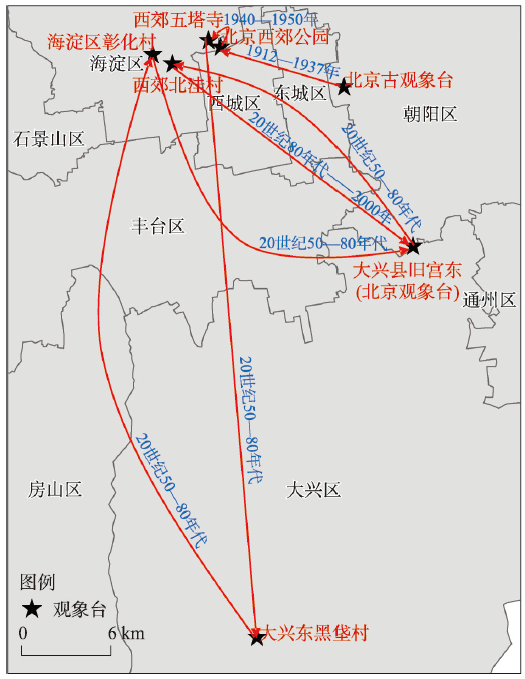
Understanding the mechanisms of regional climate evolution requires extensive research on long-term urbanization and meteorological elements. The various data sources and an interactive interpretation method were utilized to reproduce the urban expansion in Beijing over the past century. The relationship between urban development and regional climate change was then determined by using the moving average method and the Mann-Kendall trend test. We found that the area of urban land in Beijing increased 64.48 times from 1916 to 2020, expanding in a circle around the central region. The rate of urban expansion peaked at 70.12 km2/a between 2000 and 2010. The average annual temperature and precipitation from 1916 to 2020 in Beijing were 12.25 ℃ and 588.6 mm, respectively. The 5-year moving average temperature fluctuated upward by 0.22 ℃/10a over the past century, with a notable warming trend since 1978. Precipitation trended downward at a rate of 9.37 mm/10a. The accelerated expansion of the impervious surface area in the city might lead to urban warming by altering the surface energy balance. The rate of urbanization and the regional temperature rise were positively correlated, with urbanization accounting for 20.83% of the regional warming in Beijing. Changes in the surface energy balance and an increase in air pollution emissions might result in a decline in precipitation. The results provide scientific resources for advancing knowledge of the processes and mechanisms by which urban development influences the regional climate change.
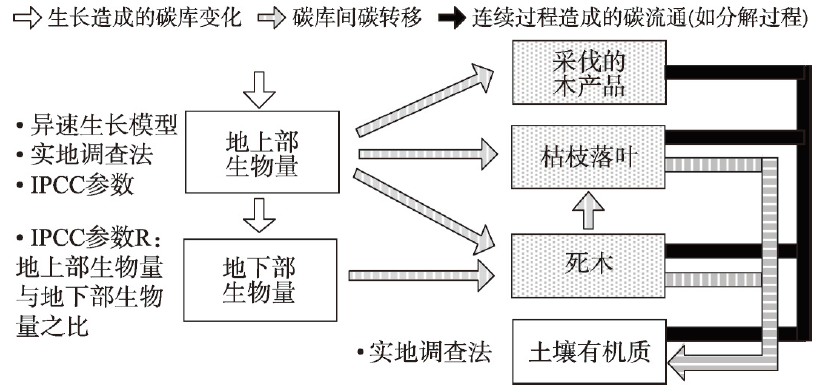
Land use, land-use change, and forestry, also known as LULUCF, are significant sources and sinks of carbon. A high-precision carbon accounting system for LULUCF should always be established as the primary building block for advancing low-carbon land use and sophisticated land management. This study uses the stock-difference method to account for carbon sources and sinks brought by LULUCF at the plot scale in Guangdong. According to the carbon accounting based on the surveys on soil, land use, and forest resources, Guangdong's LULUCF produced 29.673 million tons of carbon sinks in 2018, of which the biomass carbon sink contributed approximately 70% and the soil carbon sink around 30%. The major ways to increase LULUCF carbon sinks, therefore, are to increase plant cover and improve forest management. Different areas within the same land-use type have various carbon accounting values. Even within particular land-use types, such as forestland, wetland, cropland, settlements, and grassland, the carbon accounting values may fluctuate between being recognized as carbon sources and carbon sinks. In the era of reaching carbon peaking and carbon neutrality goals, it is difficult to meet the land-use management requirements with a carbon accounting technique assuming the carbon emission coefficient of every land-use type is constant. The carbon accounting of LULUCF in this study takes annual fluctuations in biomass and soil organic carbon pools into account, which complies with the United Nations Framework Convention on Climate Change criteria and is applicable on a national level in China. Meanwhile, the vegetation allometric growth model and the differentiation map of annual fluctuations of the soil carbon pool resulting from this study can be utilized to enable multi-scenario analyses of the carbon sources or sinks of lands at the plot scale. Finally, the results of the LULUCF carbon accounting offer some support for policymaking that emphasizes decreasing carbon sources and increasing carbon sinks in the management of land use and natural resources.
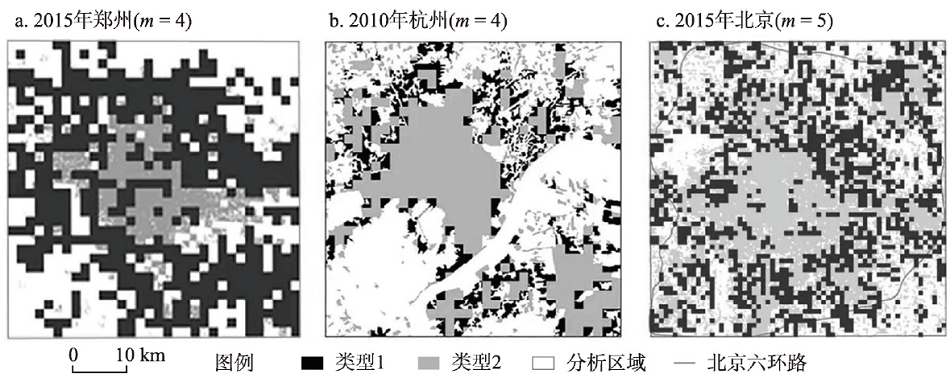
The space on the 30-150 m scale in the urban-rural transition zones belongs to an urban grass-roots space system that has obvious changes in development. In this paper, a multifractal analysis is carried out to reveal the evolution law of these zones, and the construction lands in Zhengzhou, Hangzhou and Beijing are taken as examples. Specifically, this study presents the multifractal characteristics by dividing three spatial evolution subsystems, according to generalized and typical f(a)-a(q) curve. Therefore, this paper makes a quantitative analysis of the spatial multifractal characteristics, taking the courtyard group level-neighborhood committee level space in the urban-rural transition zone as the research scale interval. The analysis shows that, the evolution of the zones belongs to adaptive change which is under the influence of macro-middle space, so its market-driven overtones are striking. On the whole, the evolution of grass-roots space is complicated in the rural-urban transition zone. Within a certain scale interval, generalized and typical spatial multifractal characteristics and their corresponding patch density (q) distribution areas are formed. Moreover, the evolution intensity of multiple spatial subsystems is usually different under the influence of various development processes and other factors, and their spatial composition also presents dynamic changes at various scales. And so, the spatial evolution of this zones is "situational". However, the grass-roots space of urban-rural transition zone is not a necessary continuation process from small and medium cities→traditional metropolises→modern metropolises→megacities. Its changes should be related to the status of the city in the urban system, more with the specific situation of urban-rural integration. The theoretical contribution of this paper is, to extend the typical multifractal characteristic system to more extensive evolution characteristic and degradation characteristic systems on the basis of satisfying the global and local indices. Thus, the nonlinear description of real development state of geographic space is enhanced.
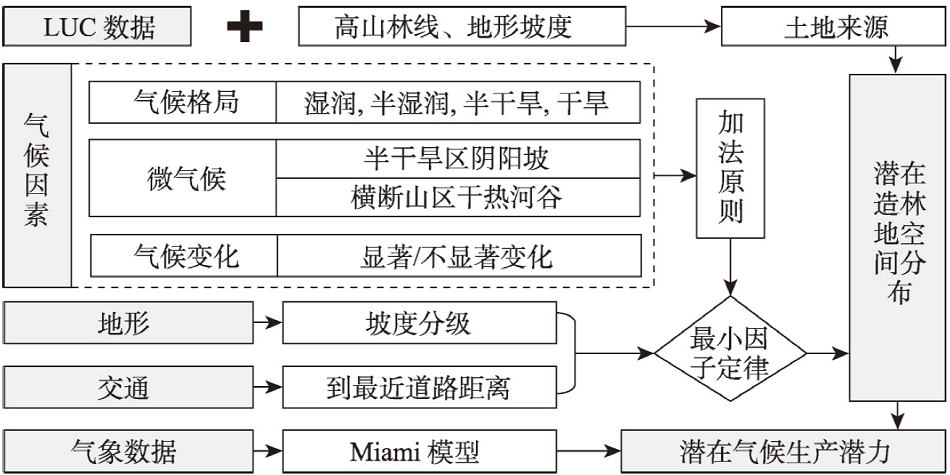
Based on 30 m resolution remote-sensing classified land use/land cover data from GLC_FCS30 and GlobeLand30 in 2020, and combined with spatiotemporal data, such as topography and microclimate, transportation, alpine timberline, ecogeographical zoning, as well as changes in Miami climatic potential productivity, this study has obtained the spatial distribution and quality of China's potential forestation land with a resolution of 30 m by selecting the grassland and cultivated land with a slope greater than 25° as the potential land source and applying Liebig's "Law of the Minimum". The results show that China lacks potential forestation land of high quality; as the quality level decreases, its area increases. Among potential forestation land, the area of prioritized potential forestation land is 0.66 million km2, of which the total multiyear average Miami climatic potential productivity is 630 million tons. If all the prioritized potential forestation land is developed for forest plantations, the national forest coverage rate would increase by 6.94%, and the corresponding climatic potential productivity would increase by 25.00%. The area of prioritized potential forestation land in North China is the highest and two-thirds of this area is observed in Inner Mongolia, while the climatic potential productivity in Southwest China is the highest, 1.59 times that in North China. Among the prioritized potential forestation land, the areas for afforestation and reforestation accounted for 59.56% and 40.44%, respectively, but the climatic potential productivity accounted for 47.94% and 52.06%, respectively. Therefore, in future forestry, we must not only actively deploy afforestation land but also strengthen forest restoration in areas with better climatic conditions. The spatial distribution of potential forestation land with a resolution of 30 m obtained in this study can provide an important reference for the nationwide forest planting plan for carbon sequestration.
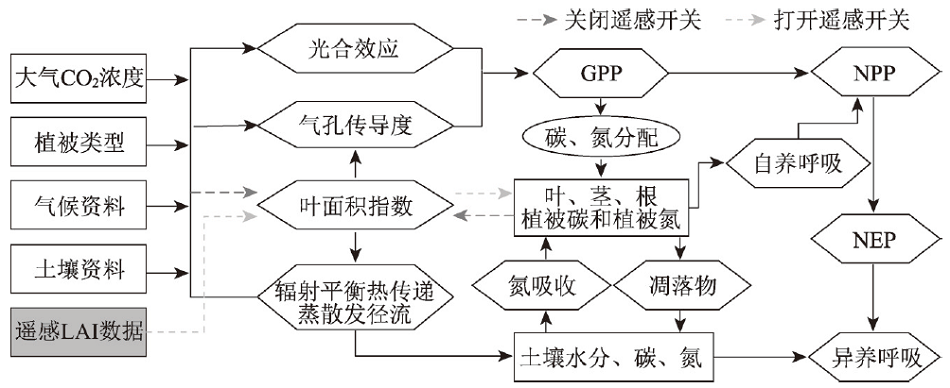
Chinese terrestrial ecosystems play an important role in the global carbon cycle. Net primary productivity (NPP) of vegetation is an important carbon cycle component. However, the report was seldom found until present on the trends and stability of NPP and its climate impact for Chinese terrestrial vegetations. In this study, through an ecosystem process model CEVSA-RS developed previously, the NPP was simulated for Chinese vegetation under climate scenarios of RCP4.5 and RCP8.5 for the period from 2006 to 2099. The interannual trends and turning points were analyzed by segmented linear regression. The moving window method was applied to quantify the changes of NPP stability and the effects of temperature and precipitation. The results showed that: (1) the total NPP of vegetation in China will be respectively 4.41 Pg C a-1 and 4.40 Pg C a-1 under two climate scenarios. The temperate and tropical-subtropical monsoon zones together contribute 72.8% (RCP4.5) and 73.4% (RCP8.5) in the national total NPP. (2) NPP will have an increasing and then a decreasing trend with the turning points respectively in 2062 and 2055 under the two climate scenarios. Specifically, NPP will increase significantly (p<0.01) by the rates of 5.3 g C m-2 10a-1 and 6.5 g Cm-2 10a-1 before the turning points, and then significantly accelerate a decrease by the rate of 4.28 and 2.57 times higher than those before turning points, respectively, for the two scenarios. (3) The NPP stability will significantly (p<0.01) decrease by the rates of -2.9% and -4.3% every 11 years under the two scenarios respectively. The NPP stability after turning year will decrease to 68.33% (RCP4.5) and 54.57% (RCP8.5) of the previous turning year, respectively. (4) In the future, the temperature will be significant warmer by the rates of 0.2 °C and 0.4 °C per decade under both of the scenarios, while precipitation will change insignificantly under RCP4.5 scenario but will be wetter by the rate of 2.9 mm per decade under the RCP8.5 scenario. Therefore, the drought indices, calculated from temperature and precipitation, will decrease significantly (p< 0.01) by the rates of -0.5 and -1.2 per decade under the two scenarios and the future climate will be warmer and drier. Responding to the future climate change, NPP will have a downward trend after 2055 over Chinese terrestrial ecosystems due to drought under the RCP8.5 scenario. This study reveals that in the future more instable warm and dry climate will cause a declining and instable NPP over the terrestrial ecosystems, which will probably result in some ecological and environmental problems, such as decreasing ecosystem services. Further, this study indicates that the policies and measures, such as carbon neutrality by 2050 implemented in China, are essential to mitigate and adapt climate change.
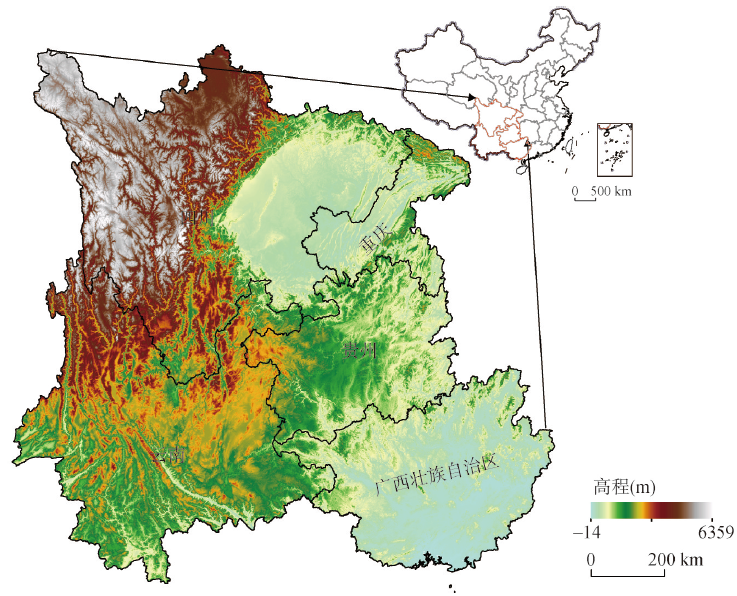
Southwest China is an important carbon sink region in China. Monitoring vegetation dynamics and exploring the impacts of climate change and human activities on vegetation are essential for gaining insight into carbon cycle mechanisms and promoting sustainable economic development. In this paper, downscaled NDVI data were obtained by fusing the GIMMS NDVI and SPOT NDVI. Then, the data were combined with multitemporal land use and meteorological data to explore the relative contributions of human activities and climate change to vegetation dynamics in Southwest China from 1982 to 2019 by using trend analysis, partial correlation analysis and residual trend analysis. The results are obtained as follows: (1) From 1982 to 2019, the NDVI showed an overall increasing trend in the study area, with an average annual rate of 0.0020 a-1; the NDVI showed a decreasing trend before the Grain to Green Program (GTGP) was implemented, but it turned to an increasing trend after the implementation of the GTGP. (2) Temperature and precipitation increased NDVI as a whole, but there was apparent spatial heterogeneity. Except in the central cities, temperature mainly promoted the NDVI. However, precipitation inhibited the NDVI in the western part of the study area and promoted the NDVI in the eastern part. (3) As the areas affected by climate change and human activities became separated, the contribution of climate change to vegetation recovery increased from 30.47% to 60.28%. In comparison, the contribution of human activities to vegetation recovery decreased from 69.53% to 39.72%. The results suggest that the impact of human activity on vegetation may decline further in the sparsely populated western part of the southwest region.
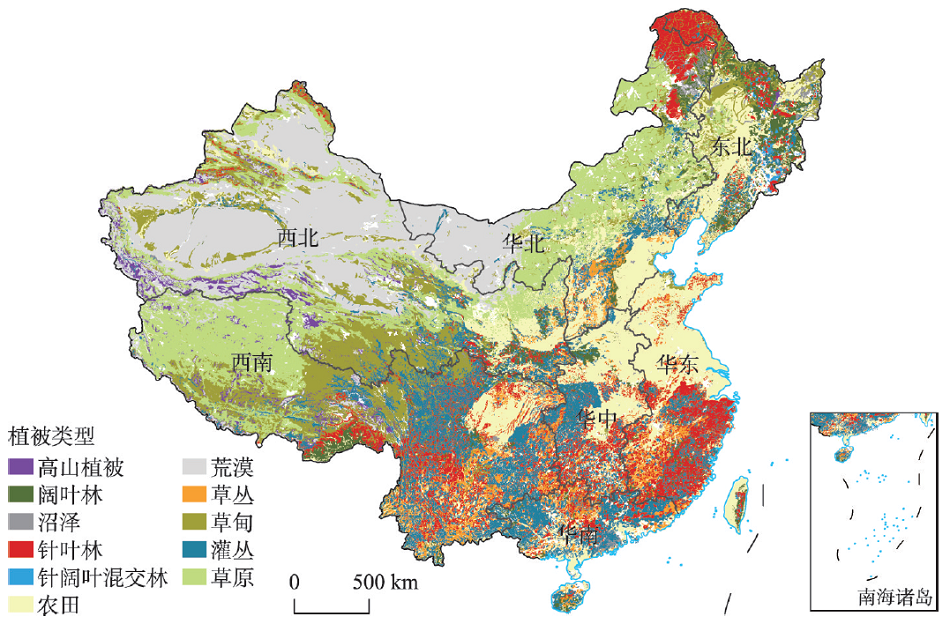
Compared to traditional optical remote sensing indicators, the microwave remote sensing indicator vegetation optical depth (VOD) is less sensitive to clouds and atmosphere, and also less susceptible to saturation. The VOD is capable of monitoring changes in the total water content and biomass of vegetation. In this study, we analyzed the spatio-temporal dynamics of VOD in different regions of China and different vegetation types from 2000 to 2018 based on multiple frequencies of VOD datasets (VODCA C-VOD, X-VOD, Ku-VOD, and AMSRU X-VOD) using trend analysis and residual analysis. Then, the relative contributions of climate change and human activities at national and regional scales were quantitatively assessed. Results showed the following. (1) All of the VOD increased significantly over this period. AMSRU X-VOD had the fastest growth rate (0.062/10a), especially in eastern China. VODCA C-VOD increased at the lowest rate (0.013/10a), which showed the highest increasing rate in southwestern China. The fastest increasing trend of VOD was observed in grasslands, followed by needleleaf forests and scrubs. (2) The rising precipitation and radiation promoted the increase of VOD in northern and northwestern China. The temperature was closely related to the VOD changes in southern China and coastal areas. The contribution of radiation on Ku-VOD and X-VOD representing vegetation canopy was higher than that of precipitation and temperature. (3) According to different datasets, human activities were the primary factor for the increase in VOD. The contribution of human activities to VODCA C-VOD, Ku-VOD, X-VOD, and AMSRU X-VOD was 171%, 48%, 43%, and 30%, respectively, especially in the Loess Plateau, southwestern China, and Northeast China Plain. The outcomes of this study shed new light on the efficiency evaluation of ecological projects, which will provide guidance for future ecosystems management and environment protection in China.
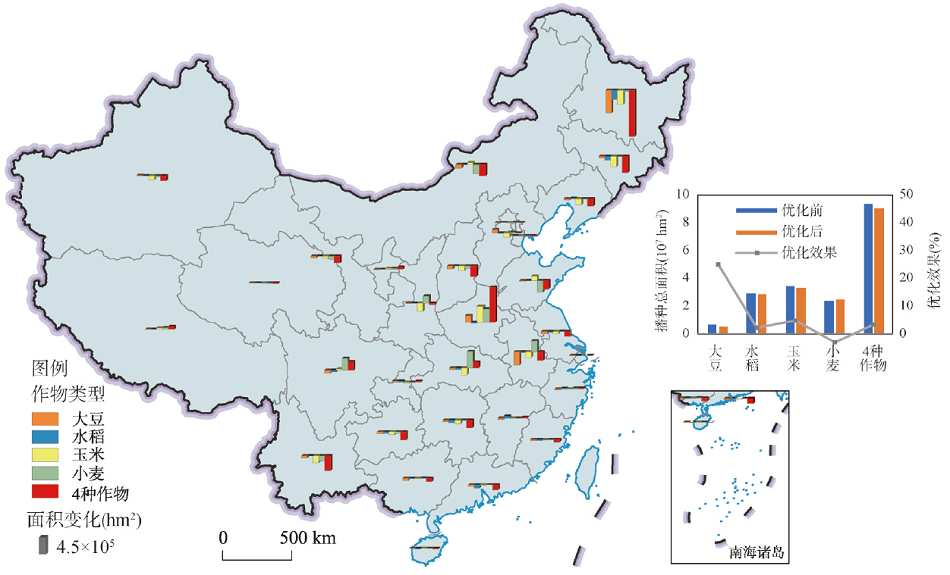
Water and soil resources are indispensable for the development of agricultural production. However, the uneven spatial and temporal distribution of water resources and the mismatch of arable land distribution have emerged as critical issues affecting the sustainable development of agriculture in China. Based on the existing arable land, this study focuses on the synergy between grain production security and sustainable water resource utilization, with the objective of securing grain production while reducing water consumption and regional water stress, and uses the CPLEX optimization model to optimize the pattern of major crops (soybean, rice, maize, and wheat) in China based on data such as pixel-scale crop yield, water consumption, and regional water stress. Furthermore, this study analyzes the water resource effects of crops in terms of their water use efficiency and water resource stress. The results indicate that: (1) Under the premise of guaranteeing the crop yield remains unchanged, the pattern optimization of crops by province can reduce the total water consumption by up to 3.63×10¹⁰ m3 (a decrease of 9.60%), the average baseline water stress falls from 1.42 to 0.90, and the sown area can be reduced by 3.08×10⁶ hm2 (a decrease of 3.29%). (2) Distinct crops have a different optimization direction. Soybeans should be reduced in the northern part of the Northeast Region and the southern part of the Huang-Huai-Hai Region, the pattern adjustment of rice should be made mainly in the Middle and Lower Yangtze River Region and the central part of the South China Region, the maize should be moved to the northeast as a whole and adjusted mainly within the Northeast Region and the Huang-Huai-Hai Region, while the wheat should be adjusted mainly in the Huang-Huai-Hai Region and the northern part of the Middle and Lower Yangtze River Region. (3) Under crop collaborative optimization, the irrigation water consumption of wheat can be decreased by 3.08%, while the reductions of the remaining three crops range from 20% to 30%, with the largest reduction for rice (8.52×10⁹ m3). (4) The impact of crop pattern optimization on regional water resources varies among provinces. More specifically, crop pattern optimization in Heilongjiang, Xinjiang, Inner Mongolia and Anhui contributed the most to the reduction in irrigation water consumption, while Sichuan, Gansu and Shandong mainly manifested a shift of crops to areas with less water resource stress, but with a slight increase in total irrigation water consumption. This study can provide decision-making suggestions and technical support for the sustainable use of water and land resources in agricultural production.
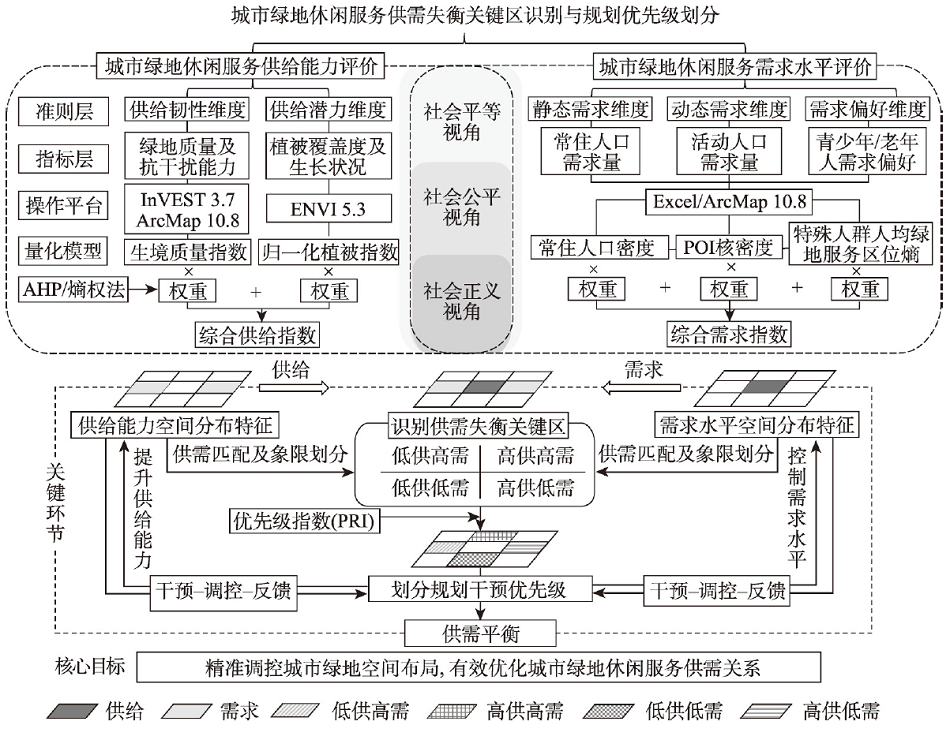
Urban green space recreational service is one of the types of urban ecosystem services that are closely related to urban residents. Identifying the key areas of imbalance between supply and demand of urban green space recreational service and prioritizing the planning intervention will play an important role in accurately improving the supply efficiency of urban green space recreational service and meeting the needs of urban residents for high-quality recreational functions. This paper takes Xiamen Island as the research object, and conducts quantitative analysis using 2019 remote sensing data, point of interest data, statistical data and other multi-source data. And, the spatial analysis tools such as InVEST model, ArcGIS platform and GeoDA are used to build the evaluation index system and research framework of urban green space recreation service supply and demand. On this basis, the supply and demand level and spatial clustering characteristics are evaluated, and the key areas of supply and demand imbalance and the priority of planning intervention are identified. The main results are as follows: (1) The habitat quality and vegetation growth status of Xiamen Island showed the spatial distribution characteristics of "superior in the south and inferior in the north"; there are significant spatial agglomeration characteristics in the supply capacity of urban green space recreational service, and high-high hotspots are concentrated in the southern and western parts of the study area. (2) Both the density of permanent population and the density of POI cores showed the characteristics of spatial agglomeration of "overall homogeneity and concentration of areas"; the per capita enjoyment rate of green space resources among special groups varies greatly; the demand level of urban green space recreational service is opposite to the spatial agglomeration characteristics of supply capacity, and high-high hotspots are scattered in the southwest and central parts. (3) A total of 387 key units of the "low supply-high demand" imbalance were identified, mainly distributed in residential areas in the central and northern parts of Xiamen Island, which faced the severe challenge of insufficient supply of urban green space recreational service and needed to be repaired and optimized. (4) Five planning intervention priorities are divided, and 44 units are in the IV-V priority area, which requires priority intervention to accurately alleviate the contradiction between supply and demand of urban green space recreational service.