×
模态框(Modal)标题
在这里添加一些文本
Close
Close
Submit
Cancel
Confirm
×
模态框(Modal)标题
×
Journal
Article
Figure
Search
EN
中文
Home
About Journal
Editorial Board
Guide for Authors
Peer review policy
Ethical Guidelines
Copyright transfer agreement
Submission Guidelines
Template article
Requirements for formatting references
Browse
Current Issue
Online First
Archive
Highlights
Topic
Archive by Subject
Most Viewed
Most Download
Most Cited
E-mail Alert
RSS
Subscribe
Advertisement
Contact us
EN
中文
Figure/Table detail
Spatiotemporal diversity and attribution analysis of land surface temperature in China from 2001 to 2020
TIAN Hao, LIU Lin, ZHANG Zhengyong, CHEN Hongjin, ZHANG Xueying, WANG Tongxia, KANG Ziwei
Acta Geographica Sinica
, 2022, 77(
7
): 1713-1729. DOI:
10.11821/dlxb202207010
区域
相关系数
海拔梯度递减率(℃/100 m)
中国
-0.66
0.41
第一阶梯
-0.76
0.44
第二阶梯
-0.29
0.57
第三阶梯
-0.17
0.15
Tab. 3
Correlation between LST and DEM
Other figure/table from this article
Tab. 1
Data introduction
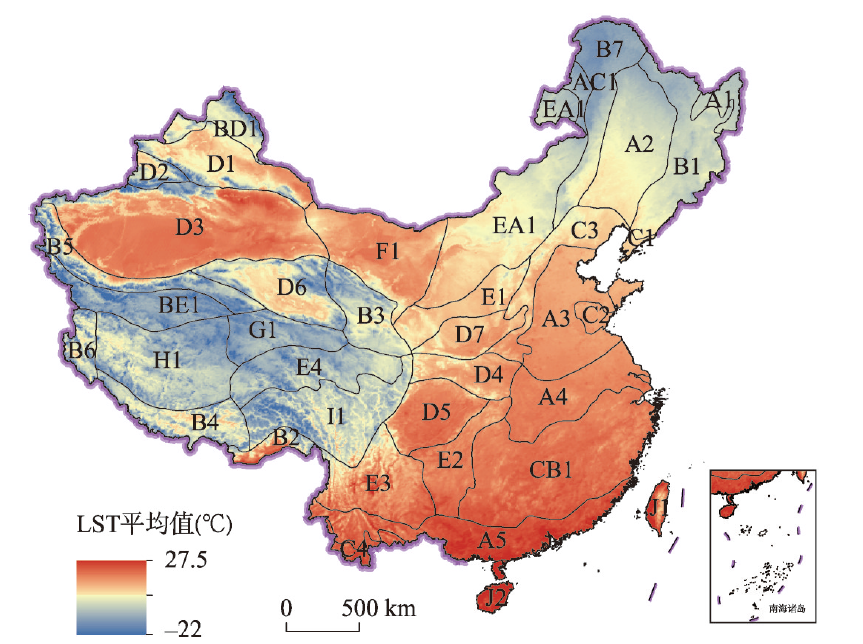
Fig. 1
Spatial distribution of LST average value in China, 2001-2020
Tab. 2
Eco-geographic zones of China
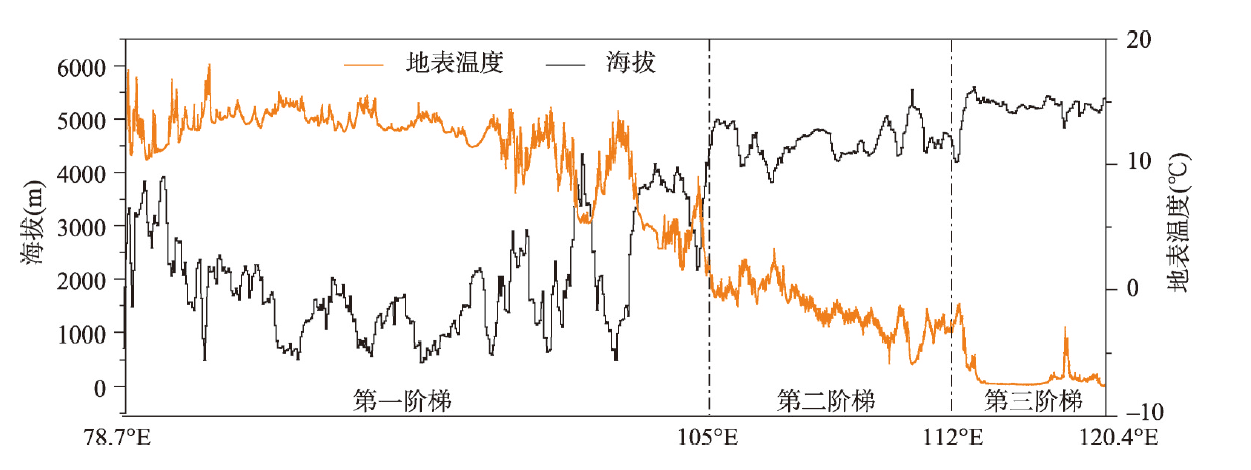
Fig. 2
Section lines of LST and DEM at 34°N
Fig. 3
Spatial variation and statistical results of LST in China in 2001-2020
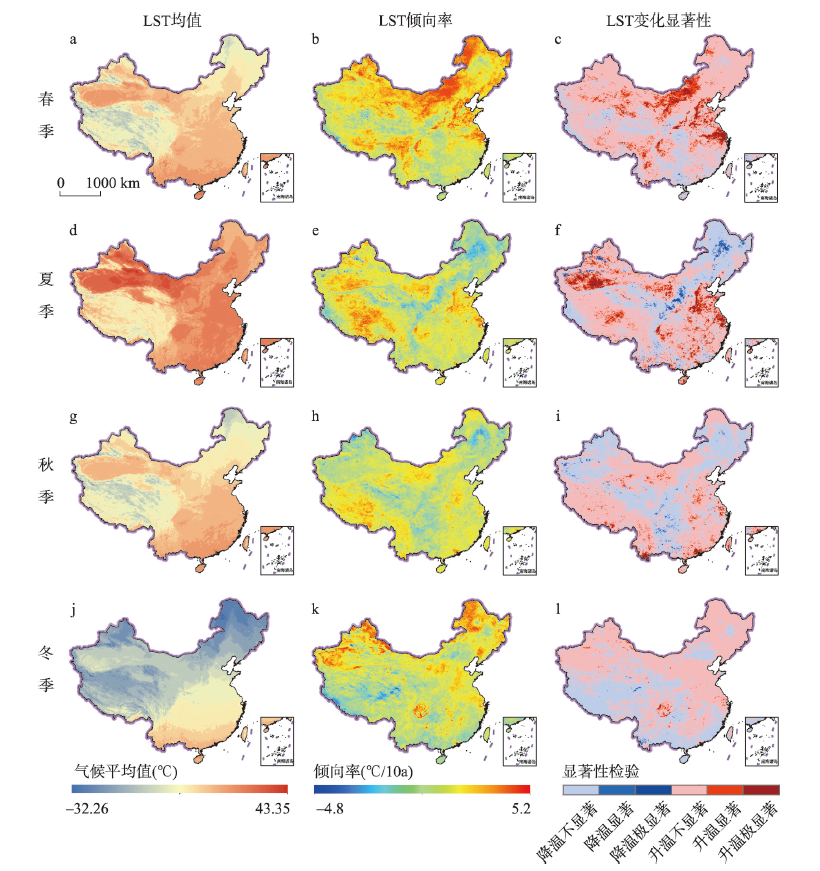
Fig. 4
Spatial distribution and variation of LST in different seasonsin China in 2001-2020
Tab. 4
Seasonal average value and change rate of LST in China
Fig. 5
Trajectory of centroid in warming/cooling zones in different seasons in China in 2001-2020
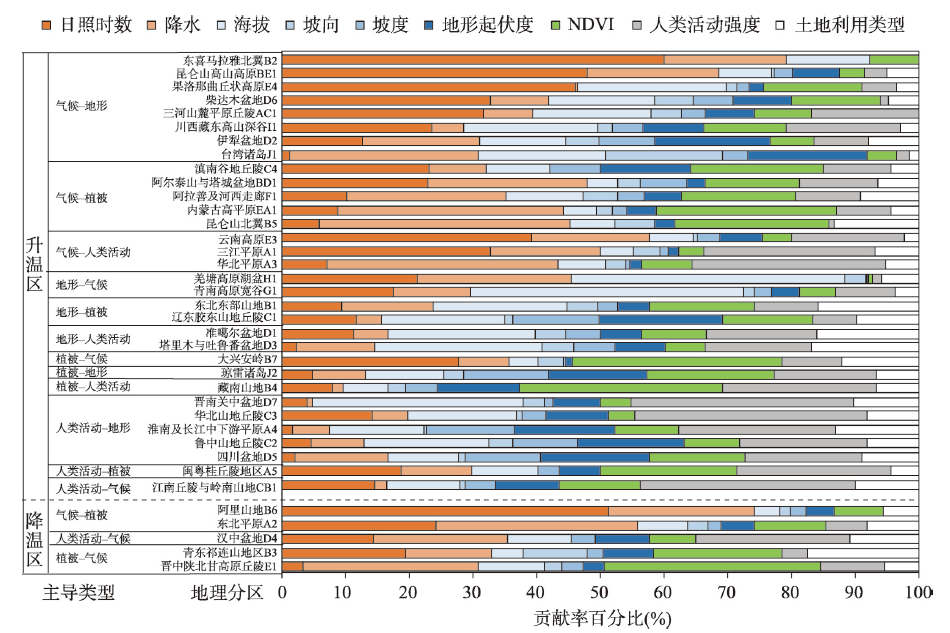
Fig. 6
The factor detection results of LST change rate and the division of dominant types
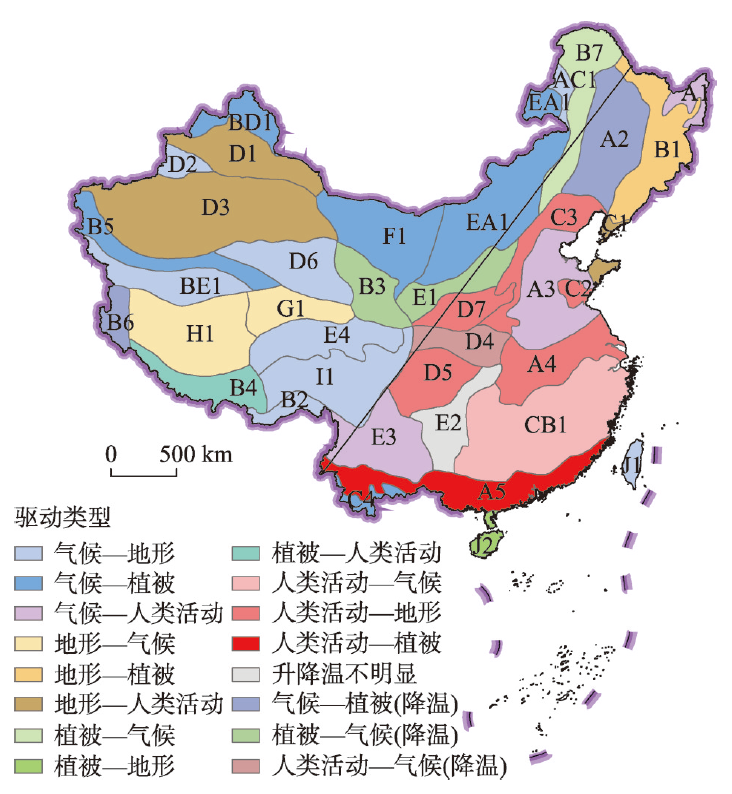
Fig. 7
Driving force types of LST variation based on eco-geographic zones in China