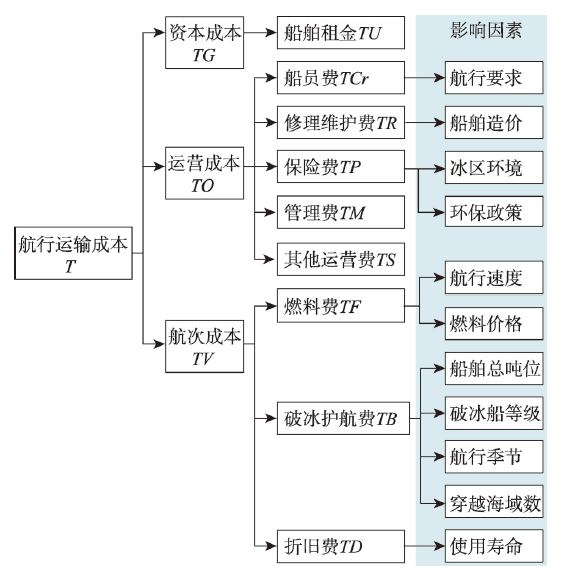
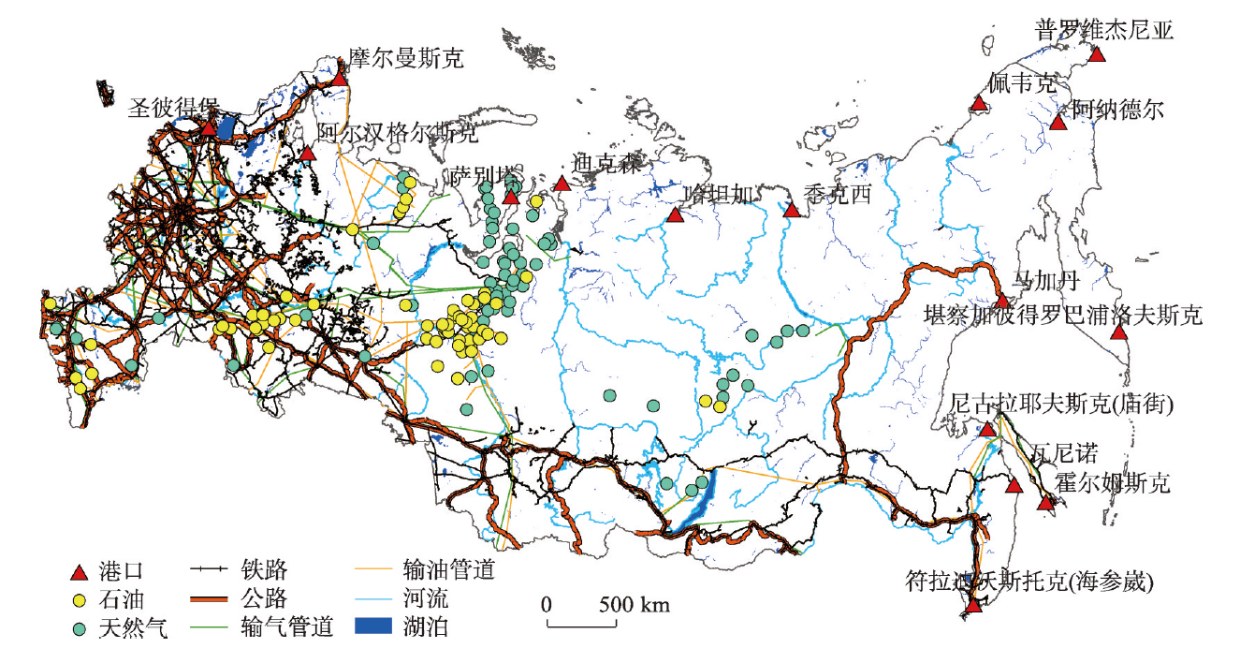
The global warming has led to the acceleration of the melting of Arctic sea ice, and the opening of the Polar Silk Road has gradually been put on the agenda. In this paper, according to the navigation performance of eight important Russian ports reaching the Bering Strait through the Northeast Passage from 2030 to 2070, the sea ice data of six CMIP5 climate models under two RCPs and two ship types of PC6 icebreaker and OW (merchant ship) ship are adopted. Based on the study of the four factors of optimal route, navigation time, navigable mileage and navigation cost, the main conclusions are as follows: (1) With the change of time, the optimal navigation routes are gradually concentrated and orderly. The navigation capacity of merchant ship has been significantly improved, and by 2070 it will have the same navigation capacity as the PC6 icebreaker has. (2) The navigation time between the Russian ports and the Bering Strait has decreased by 14 h every 10 a, of which St. Petersburg Port has the most significant decline. By 2070, when the longitude difference between the Russian port and the Bering Strait increases by 1°, the navigation time of the port decreases by 0.4 h. (3) In the next 50 a, the navigable mileage of Northeast Passage will increase by 166 km every 10 a, among which the change pattern and average change pattern of navigable mileage in St. Petersburg Port are the most similar. (4) The navigation cost of the route from the Arctic port is reduced by $10,000 every 10 a, and the decrease of the total navigation cost of merchant ships is the most obvious under high emission concentration. Combined with the change of sea ice, the ports in central and western Russia have great potential for resource transportation. This study quantifies and evaluates the evolution of the navigation performance of the Northeast Passage under the future sea ice melting situation, which provides theoretical and data support for the navigation of the Northeast Passage and the Arctic port trade.
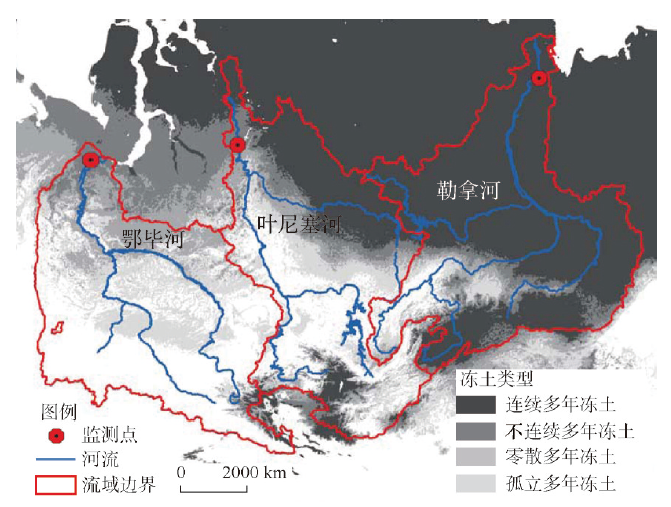
As an important component of Arctic carbon cycle, riverine organic carbon export is very sensitive to climate change. In order to analyze the organic carbon output from 2004 to 2017 of Ob, Yenisei and Lena rivers in Siberia of Russia, river discharge and organic carbon data from the ArcticGRO (
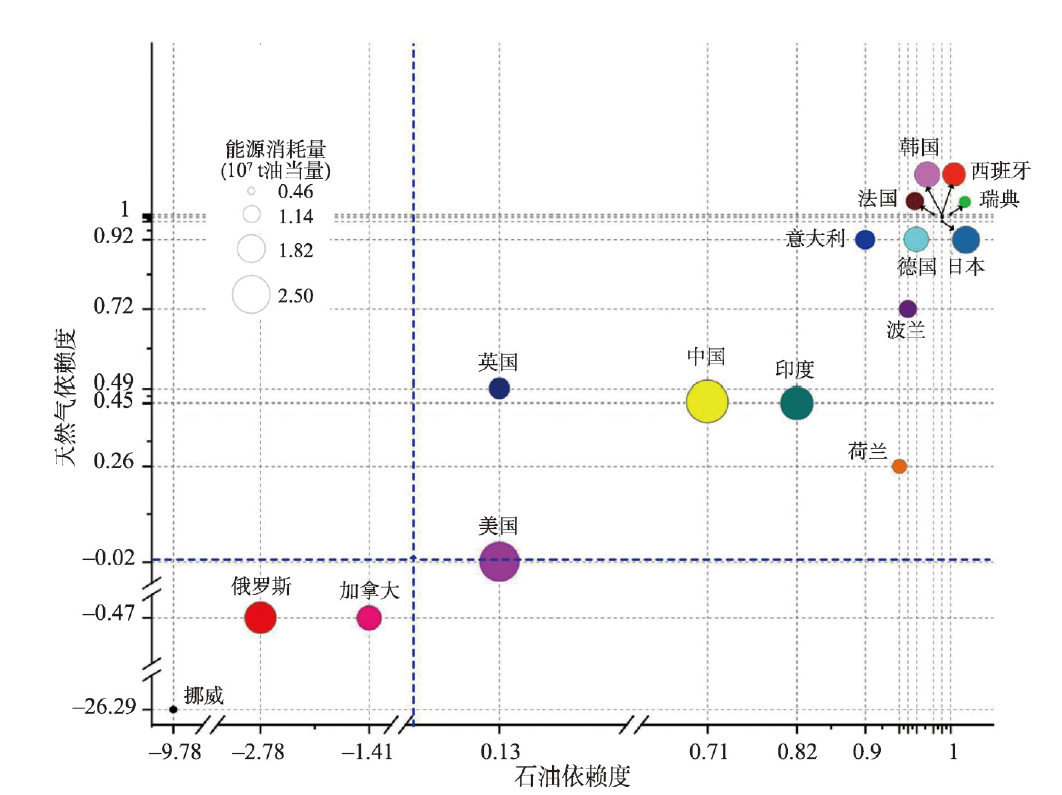
The accelerating global warming enhanced the Arctic sea ice melting, which made it possible to explore energy resources in the Arctic region. This study firstly analyzed the energy trade structure in the pan-Arctic countries, covering Arctic countries and the observer countries. Secondly, it uses correlation analysis to extract the direct geopolitical factors including energy dependence, energy importance, energy security, and indirect geopolitical factors including national power (military power and foreign investment influence), climate and environmental protection and social inclusive development, which might influence the willingness of the pan-Arctic countries to exploit the Arctic energy. Finally, we apply fuzzy-set qualitative analysis (fs/QCA) to examine the driving mechanisms of these geopolitical factors on the willingness to exploit the Arctic energy. The results showed that: (1) Arctic countries mainly serve as energy exporter while observer countries mainly serve as energy importer. The amount of China's energy imported from Arctic counties is small at current stage, but with a huge potential. (2) Energy dependence, energy importance, national power and social inclusive development are significantly correlated with the willingness on Arctic energy exploitation, acting as key geopolitical factors. (3) Key geopolitical factors drive or impede the willingness on Arctic energy exploitation through three major pathways, among which, national power together with energy dependence or energy importance behave as the major driving forces for most of the pan-Arctic countries, large countries in particular, such as Russia, USA, China and India. The second pathway is driven by national power but restricted by social inclusive development, including most European countries and Canada. The third pathway is mainly driven by energy importance while restricted by social inclusive development, mainly including Norway. Finally, this study provided coping strategies and suggestions on China's participating Arctic energy exploitation based on the energy trade structure and the driving mechanisms.
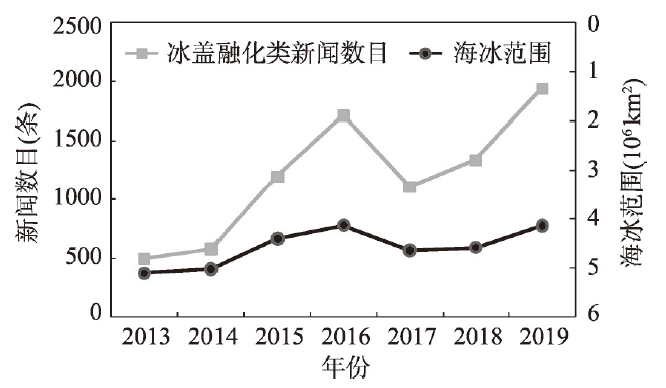
Global warming has caused a shrinkage of the Arctic sea ice cover. It endangered the environment, but made the Arctic channel possible. Therefore, the strategic position of the Arctic has been improved significantly. As a near-Arctic country, China has formulated relevant Arctic policies, which will be directly affected by the changes in the international relations between the eight Arctic countries (region). A comprehensive and real-time analysis on the variation characteristics of the Arctic geographical relationship is required in China, which can provide instructions for formulating political, economic and diplomatic countermeasures in the Arctic. Massive global real-time open databases, such as GDELT (The Global Database of Events, Language, and Tone) global news event database, provide news data from major media in various countries. And this makes it possible to monitor the geographical relationship in real time. Based on the GDELT database and the method of labeled-LDA (Latent Dirichlet Allocation), this paper explored the key elements in social development of eight Arctic countries (region) over the past seven years. This paper also constructed the national interaction network, and identified the evolution pattern of the relations between the Arctic countries. The following conclusions were drawn: (1) Arctic news focused on climate change and ice sheet melting, which had become the main driving factor for the change of international relations in the Arctic; (2) There was a strong correlation between the number of ice sheet melting news pieces and the sea ice area; (3) With the melting of the ice sheet, the social, economic and military activities in the Arctic were booming, and the competition for dominance was becoming increasingly fierce. Generally, a pattern dominated by Russia and Canada was formed.
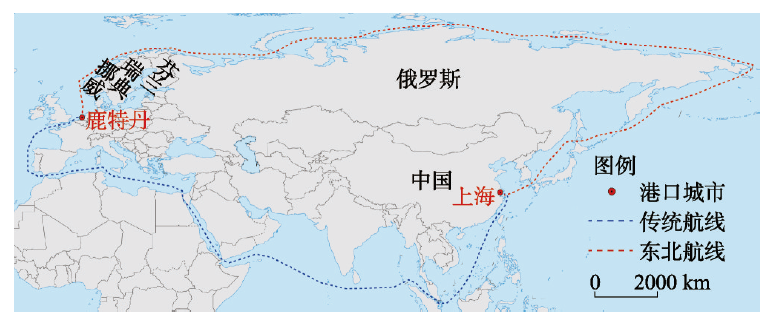
The Northern Sea Route has been increasingly attracting the attention from countries all over the world due to its important strategic status. By calculating the economic costs of shipping among China-EU ports through the Northern Sea Route and China-EU trade complementarity index, this study builds a trade gravity model in stochastic frontier based on the Northern Sea Route, and explores the influencing factors of China’s import from and export trade to 18 European countries, which shows the following: (1) Taking the traffic volume of 12000 TEU for comparison, the economic costs of shipping along the Northern Sea Route are 1.58-2.80 times those based on the traditional passage among China-EU ports. (2) In 2000-2018, the proportion of the China-EU trade complementarity index based on China’s export (CEij) greater than 1 accounted for 52.63%, and countries with higher CEij included Iceland, Denmark, Norway, France, Sweden and the United Kingdom, while the proportion of the China-EU trade complementarity index based on China’s import (CIij) less than 1 accounted for 94.74%, with a declining trend. So, China’s import and export with 18 European countries were less complementary. (3) In terms of trade scale of China’s export to 18 European countries, the economic scale of trade partner countries has a greater influence than that of China, and the economic costs of shipping are significantly negatively correlated with the trade scale based on the Northern Sea Route; in terms of trade scale of China’s import from 18 European countries, the economic scale of trade partner countries has a greater influence than that of China, and the positive correlation relationship between the economic costs of shipping and the trade scale has lower confidence based on the Northern Sea Route. (4) If the Northern Sea Route was taken for the China-EU trade, the trade efficiencies of China’s export to 18 European countries and import from them declined and rose to varying degrees, respectively, which means that the trade efficiency of China’s import and export had large room for improvement. This study can strengthen the research foundation of relationship between China-EU shipping and trade based on the Northern Sea Route, and provide references for China on participating in the construction of the Northern Sea Route, exploiting and utilizing Arctic resources, and reinforcing the trade between China and Europe.
Due to the rapid development of society and economy, China's demand for energy and mineral resources is increasing day by day. Therefore, China has carried out a lot of energy trade with Russia, a country with adequate resources. Under the background of global warming and the gradual improvement of Arctic navigation, the energy transportation between the ports of the two countries can be completed through the northeast passage, which will be better than the traditional passage in terms of time, cost, and security. In this paper, the weighted average travel time was used to quantify the accessibility from Chinese ports to Russian oil and gas resources from 2030 to 2070 under climate change scenarios, and a shipping cost system was established to calculate the navigation cost. The conclusions are as follows: (1) The accessibility of Chinese ports to Russian oil resources will be better than that to Russian gas resources. (2) The accessibility of Chinese ports to Russian resources will be reduced by 7 hours on average every decade, and the accessibility of Nantong Port to Russian resources will be the best. (3) The navigation cost of Chinese ports will be reduced by $5000 on average every decade, and the cost of the route from Nantong Port will be the lowest. (4) Under the high emission concentration scenario, merchant shipping will cover a wide range in the future. This paper quantified and evaluated the time and cost of energy trade between China and Russia from 2030 to 2070, which provided a theoretical reference for Sino-Russian maritime transportation and energy trade.
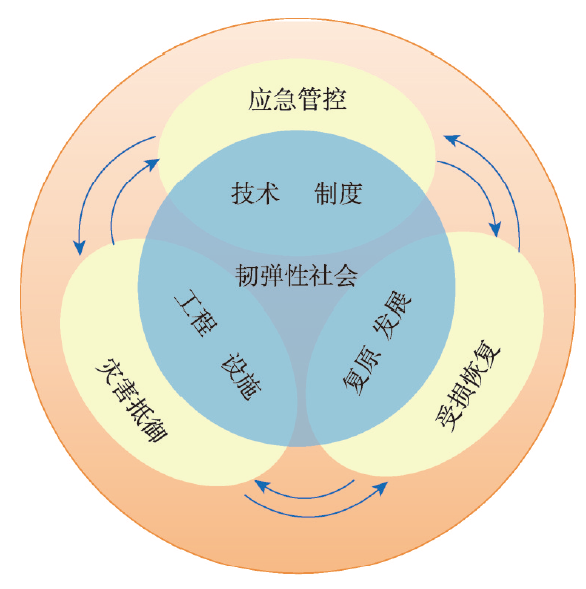
The change of global environment and the rapid development of economy have led to the increase of natural disasters, which have become one of the most serious environmental problems in modern human society. Facing the grim situation of natural disaster risk prevention and control, human society should be built strongly enough to deal with natural disaster risks. On the basis of "building a resilient society to reduce natural disaster risks", this paper focuses on analyzing the exact meaning of resilience, and interprets the connotation, composition and structure of natural disaster-resilient society through integrated hazard defense, damage recovery and emergency governance. The index system and quantitative characterization method of the natural disaster-resilient society was established to evaluate the situation of a natural disaster resilient-society in the case area. According to the differences between urban and rural areas, we designed pathways to build a natural disaster-resilient society. Then a theory paradigm of the natural disaster-resilient society, including concept-structure-index-approach, is systematically constructed. It is an inevitable option for human to build a natural disaster-resilient society, which is highly consistent with the sustainable socio-economic development. The research aims at promoting a comprehensive response to natural disaster risks, exploring ways to build a "stronger, safer and more sustainable" natural disaster-resilient society, supporting the transformation of national disaster prevention and reduction strategies, and implementing the "Nine Key Areas and Weak Links Projects".
Understanding the influencing factors and controls of rainstorm-induced floods, which have caused tremendous losses of human lives and national economy, is a pressing need for flood risk management in China. Based on the meteorological disaster census data of counties in China, hourly precipitation data at 2420 stations, statistical yearbook, terrain data and other data, the authors (1) investigated the spatiotemporal pattern of flood impacts in China over the period from 1984 to 2007 using trend analysis techniques and (2) explored the driving factors of the spatiotemporal pattern by adopting the geospatial statistical analysis tool (Geodetector). This study considered the spatiotemporal patterns and their interplays among county-level flood impacts (i.e., flood-induced mortality rate, proportion of population affected, and economic loss in percentage), disaster-formative environmental factors (i.e., population density, urban population percentages, average elevation, river density, average slope, and average distance to the seashore), and extreme precipitation characteristics (i.e., annual average volume and duration of extreme rainfall). The results show that: (1) there were no consistent temporal trends of extreme rainfall characteristics over the study period across China. (2) The frequencies of flood disasters in the Yangtze and Pearl rivers and southeast coastal areas increased significantly, but the casualties over these regions decreased. (3) Flood-induced casualties, proportion of population affected and economic loss in percentage increased in Northwest China; and meteorological factors, disaster-formative environment factors such as geographical conditions and social economy, and geographical conditions contribute mostly to the proportion of population affected, flood-induced death and economic loss in percentage. These results indicate that more attention should be paid to improving the flood control capacity of small or medium-sized cities in the inland river basins, especially in Northwest China, and we should recognize the important roles that disaster-formative environment plays in triggering flood losses.
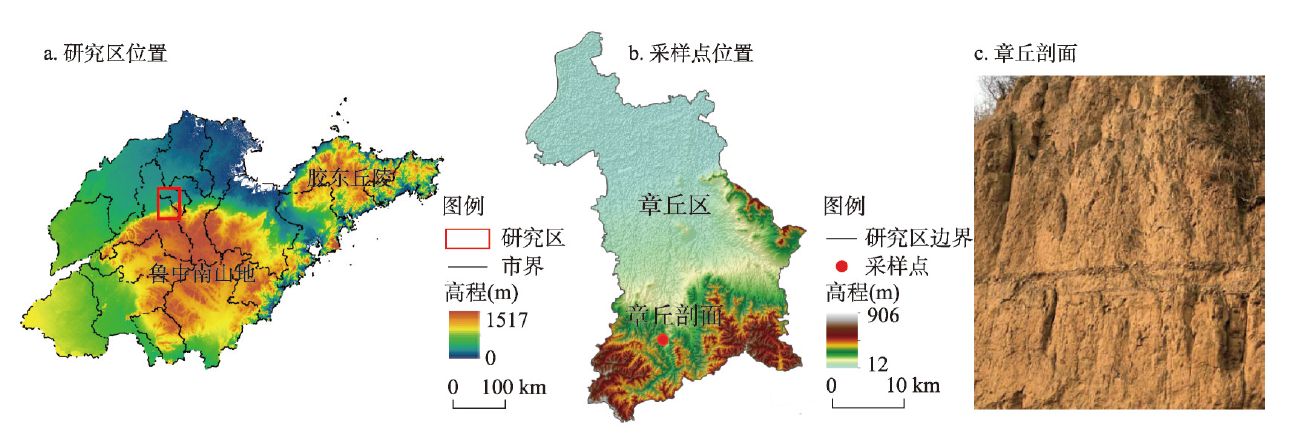
The accumulation processes of loess in Shandong Province record atmospheric circulation changes in eastern China, which is significant in revealing the varied characteristics of East Asian monsoons and palaeoenvironmental change. In this study, the parameterized end-member modelling analysis of grain-size distributions is used to discuss the sedimentary characteristics, transport dynamics and environmental significance for a loess section in Zhangqiu, Shandong Province. The results indicated that: (1) The optically stimulated luminescence (OSL) ages of the Zhangqiu section ranged from 0.26 to 42.24 ka, suggesting that sediments have mostly deposited since the late Pleistocene. (2) The grain size components of the sediments in this section were divided into five end members: EM1 represents the mixed clay component of pedogenesis and transported sediment, EM2 represents the fine silt component transported by the high-altitude westerly wind over long distance, EM3 represents material that settles as floating dust, EM4 is the main material source of the profile, which represents the silt component transported by low-altitude suspension under local wind systems, and EM5 represents short-distance suspended materials under dust storm conditions. Change in the EM5 component is a good indicator of winter monsoon intensity change, and has recorded all climate fluctuation events since the late Pleistocene. (3) According to the climatic proxies such as the grain-size end-member content, low frequency magnetic susceptibility (χlf) and chromaticity (a*), combined with the results of OSL, this effectively indicated the stage change and differences of the sedimentary environment in the Zhangqiu section since the late Pleistocene and reflected the regional response to global climate change.
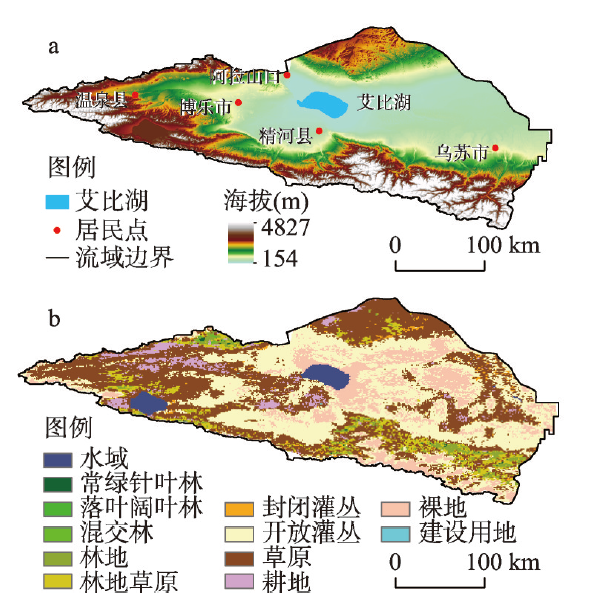
Traditional methods for estimating evapotranspiration are mostly based on local scales. For data-scarce basins where ecological hydrology has undergone dramatic changes, a land surface process model that fully considers the spatial variability of the underlying surface of the watershed provides a new method of performing continuous actual evapotranspiration simulations over a long time series and at a large scale. Taking the Ebinur Lake basin as the research area, the variable infiltration capacity (VIC-3L) model was used to simulate the hydrological processes from 1960 to 2017 and explore the spatial and temporal variations in actual evapotranspiration in the study area. Additionally, the wavelet analysis method was used to analyze the multiscale characteristics of the five meteorological elements and the simulated values of actual evapotranspiration in the study area. The following results were obtained: (1) The runoff Nash-Sutcliffe efficiency (NSE) coefficients of the VIC at the Wenquan and Bole stations were 0.09 and 0.23, respectively, and the simulation results were satisfactory. Specifically, the simulated value and theoretical calculated value of the actual evapotranspiration of the VIC had an R2 value of 0.80, an RMSE of 31.76 mm a-1, an NSE of 0.32, and a relatively good simulation effect. (2) Regarding the time scale, the interannual actual evapotranspiration has presented an upward trend over the past 58 years, with the annual average actual evapotranspiration increasing at a rate of 1.03 mm a-1. Furthermore, both monthly and daily evapotranspiration showed a single peak trend. Regarding the interdecadal changes, the actual evapotranspiration from May to July showed a downward trend in the 1990s and in the early 21st century, and an upward trend in the 1970s, while no significant change in tother months. (3) In terms of spatial distribution, the actual evapotranspiration generally showed strong evapotranspiration in high altitude areas and their surroundings. From spring to summer, the area with strong evapotranspiration shifted from the northwest to southeast. The spatial distribution of annual actual evapotranspiration is consistent with that in spring and summer. (4) A wavelet analysis identified 1 to 4 significant periods in the time-frequency domain for the actual evapotranspiration and meteorological elements in the study basin. Over a certain period, the average wind speed, average temperature, and sunshine hours changed ahead of the actual evapotranspiration while the annual precipitation and relative temperature lagged behind the actual evapotranspiration changes. Affected by precipitation, the actual evapotranspiration had a "strong-weak" transition in 1965 and 2003 with a period of 1 a; and affected by relative humidity, the actual evapotranspiration had a "strong-weak" transition in 1965 and 2008 with a period of 2-4.5 a.
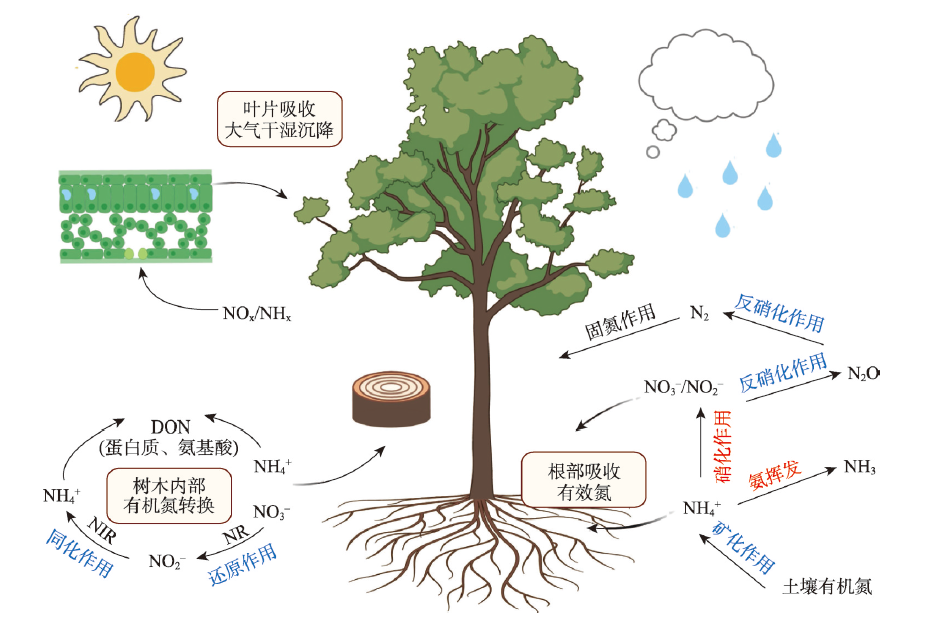
Stable isotope in tree rings are effective proxies for the study of climate change and environmental evolution. Coupling analysis of stable isotope records of tree rings can reveal the spatiotemporal variation characteristics and interactions of carbon, water and nitrogen in forest ecosystems, and reflect the physiological effects of environmental changes on plant-specific compounds. The stable nitrogen isotope ratio (δ15N) in tree rings is closely related to the environmental conditions of tree growth, and the change of ratio can indicate the dynamic characteristics of nitrogen cycle in forest ecosystem on a long-term scale, and make up for the lack of monitoring data. Herein, we reviewed the theory of the stable nitrogen isotope fractionation and measuring method, and found out the issues that need to be paid attention to in sample pretreatment and measurement. Furthermore, we synthetically stated and evaluated the reports of climate and environment evolution based on δ15N of tree-rings, and the effects of human activities on nitrogen cycle in forest ecosystem. We suggested the great potential of tree-ring δ15N in combination of the multiple isotope proxies and its development directions in the future, which should promote further studies on the spatiotemporal characteristics of nitrogen cycle in forest ecosystems.
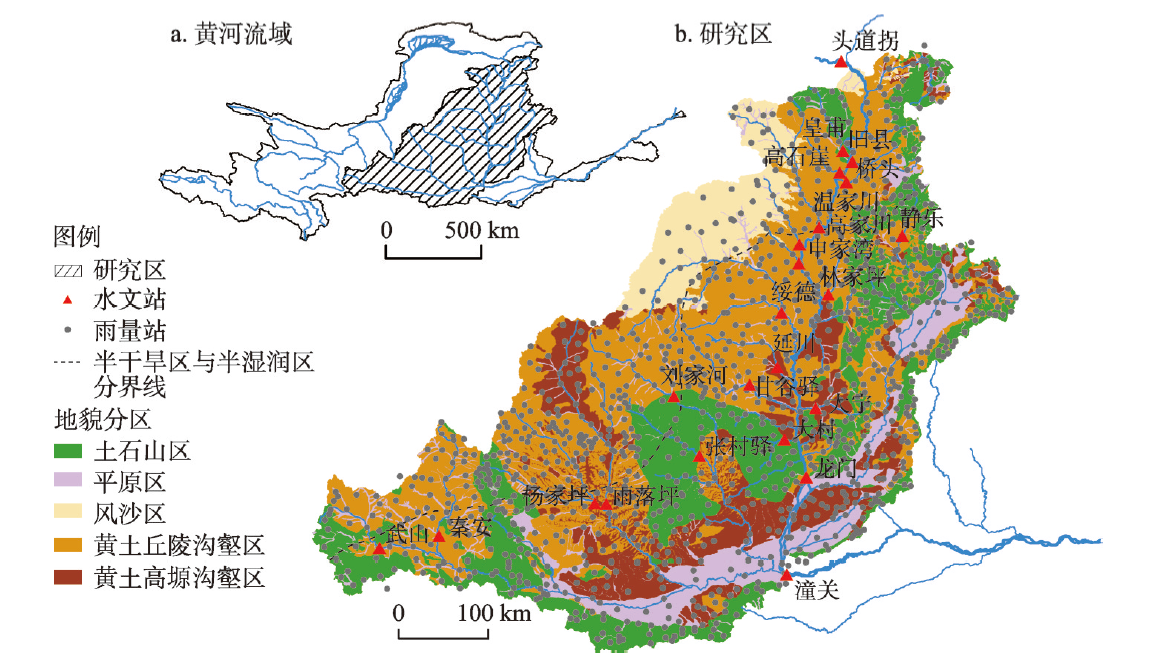
The Toudaoguai-Tongguan section is the main source area of sediments in the Yellow River and has the largest vegetation restoration rate in China. Subsequently, the rapid restoration of vegetation has had significant effects on the runoff and sediment transport processes. In this paper, the vegetation restoration characteristics, and the influencing factors and their effects on runoff and sediment processes in different landform units in the Toudaoguai-Tongguan section were analyzed based on the MOD13Q1 Normalized Difference Vegetation Index (NDVI) data using the statistical and trend analysis techniques. And then, the future vegetation development trend in this area was predicted. The results suggest that the vegetation exhibits a significant increasing trend (p < 0.05) in 82.87% of the study area, and the semi-humid loess hilly and gully zones have the largest vegetation restoration rate. Slope gradient and precipitation have different effects on the vegetation restoration in different landform units. With the increase of precipitation, the correlation between NDVI and annual precipitation in the Toudaoguai-Tongguan section is lessened. In the context of vegetation restoration, precipitation is still the major factor influencing the main river runoffs in the middle reaches of the Yellow River, whereas the sediment load is affected by both precipitation and NDVI, and the sediment concentration exhibits a relatively strong negative correlation with NDVI. With the increase of vegetation coverage, the amount of soil erosion in the watershed decreases, and the river sediment load exhibits a decreasing trend. The contribution rate of the amount of soil erosion to the sediment load varies between 39%-88%. Based on the vegetation restoration potential and vegetation restoration rate, it was predicted that the mean values of NDVI in the Toudaoguai-Tongguan section in 2020, 2030, 2040, and 2050 would be 0.68, 0.75, 0.79, and 0.80, respectively.
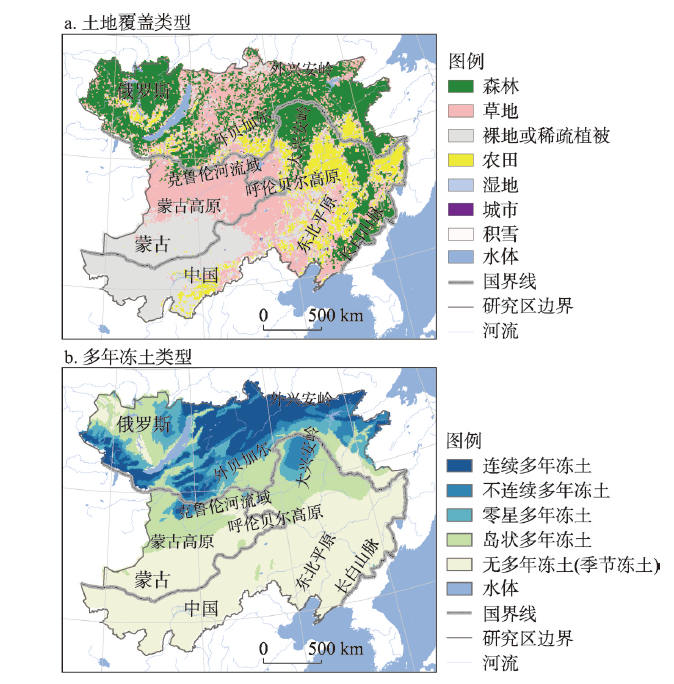
The eastern segment of the China-Mongolia-Russia economic corridor is situated in the overlap region of the southeast margin of Eurasia permafrost region and the southern border of the tree line, where fragile frozen ground and ecosystems have been maintained. In this study, we analyzed the spatiotemporal distribution and annual change of frozen ground, leaf area index (LAI), and the vegetation green-up data in the eastern China-Mongolia-Russia economic corridor from 2000 to 2015 based on the MERRA-Land data product, GLOBMAP LAI, and MODIS EVI dataset. The main controlling environmental factors of the green-up date and the status of vegetation growth in the different periods over a year were calculated by grey correlation analysis, and then the response of vegetation growth in typical areas to the freezing-thawing changes of the frozen ground was analyzed. Some conclusions can be drawn as follows. (1) In the past 16 years, permafrost and seasonal frost in the eastern China-Mongolia-Russia economic corridor was persistently and significantly degraded, which was mainly reflected by the early thawing and delayed freezing of the frozen ground in time, and manifested as the disappearance of permafrost and the uplift of the lower limit of seasonal frost in the southern isolated permafrost, and the thickening of the active layer in the southern continuous permafrost in space. (2) In about 48% of forest areas, the onset day of frozen ground melting is the main factor affecting the start of vegetation greening season. The growth situation of vegetation in forest areas is altered by the soil water from thawing frozen ground and the hydrothermal mechanisms of peatland. (3) With the transition from forest and peatland to meadow or farmland, the frozen ground degrades and in turn further facilitates the fade of peatland. Exploring the synergetic relationship between the degradation of frozen ground and the ecological environment is helpful to identify the vulnerable regions of degrading frozen ground and the sensitive regions of the ecological environment under the influence of climate warming and human activities.
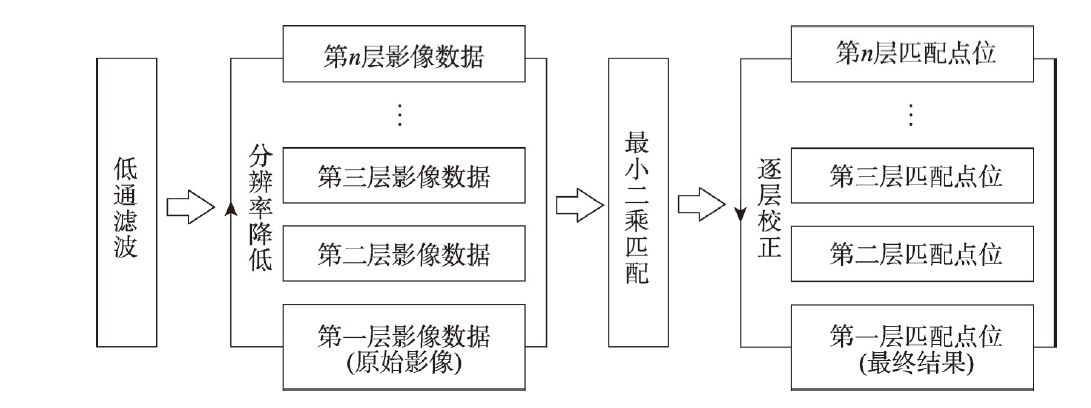
Unmanned Aerial Vehicle (UAV) has been developed to obtain high-precision, high-resolution and three-dimensional (3D) dynamic of glacier surface, which is helpful for revealing the movement and melting of glaciers, so it has become an important technology for glaciology researches. Because the high-resolution image data can be used to effectively identify the detailed features on the surface of the debris-covered glaciers, this study employed the pyramid image set combined with the least square matching (LSM) method to track the feature points of 3D displacement field. We acquired digital orthophoto map (DOM) and digital surface model (DSM) by UAV mapping at the lower part of Gongba Glacier, Mt. Gongga, on June 9 and October 17, 2018. Feature points were extracted and tracked to obtain a 3D glacier surface displacement field, which suggests that the mean surface displacement velocity was 7.51 cm/d and the ablation was over 11 cm/d at the glacier tongue. This study provides effective reference for monitoring glaciers and glacial related hazards in steep terrain regions and unreachable mountainous areas.
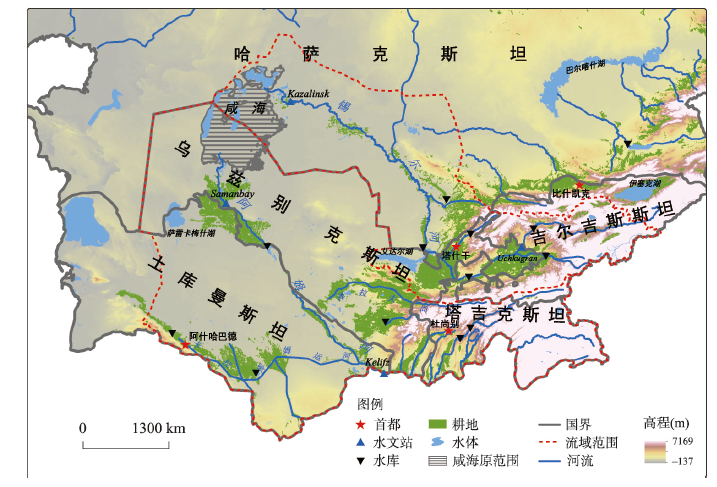
Since 1960, water and land resource development in the Aral Sea Basin has led to a surge in socio-economic water consumption and resulted in about 50% shrinkage of the Aral Sea until 1990, which is also known as the Aral Sea Crisis. However, the spatial and temporal changes in socio-economic water consumption are still unclear. Based on the multi-source acquisition of Aral Sea Basin national/state water resource and socio-economic data during 1960-2016, this paper used the system dynamics model to simulate and analyze the characteristics of the socio-economic and water use changes in the Aral Sea Basin and forecasted the socio-economic water use in 2016-2030 under multi-scenarios. The population and GDP in the Aral Sea Basin increased rapidly, by 267% and 1100% respectively, during the study period. The socio-economic water consumption increased from 41 km3 in 1960 to 91 km3 in 2016. The socio-economic water consumption of Kazakhstan and Uzbekistan increased rapidly before the collapse of the Soviet Union, and decreased afterwards. The socio-economic water consumption in Turkmenistan and Tajikistan continued to grow in the past 60 years. The benefits of industrial and agricultural water use in the basin increased significantly after the collapse of the Soviet Union, but remained at a relatively low level. The future forecasts show that if the existing socio-economic water use efficiency and cropland continue to increase (S1), the socio-economic water consumption in the Aral Sea Basin will reach 96.2 km3 by 2030. Under the S10 scenario that the drip irrigation penetration rate reaches 70% and the cropland remains unchanged, the socio-economic water consumption will drop to 68.1 km 3, which can effectively alleviate the crisis in the study area.
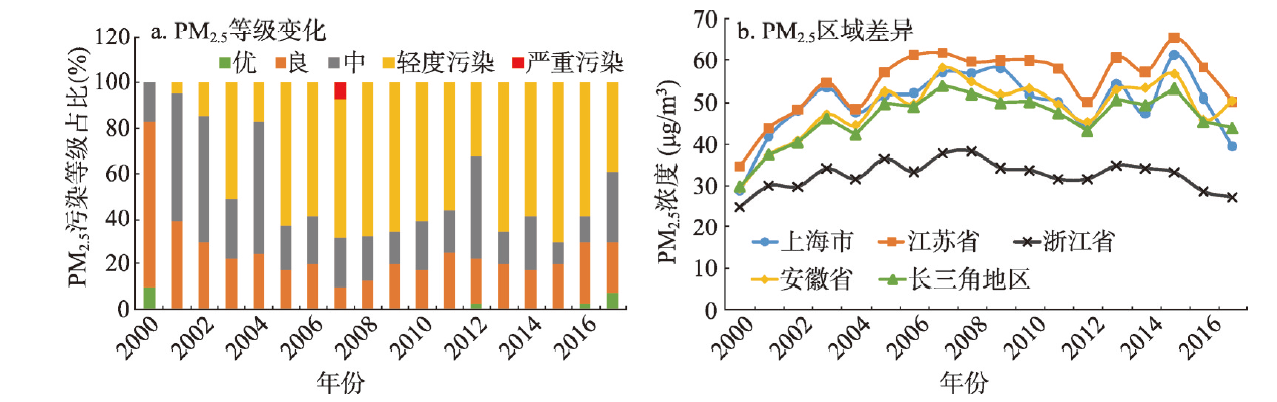
Exploring the nonlinear effects and driving mechanism of multidimensional urbanization on PM2.5 concentrations is of great significance in the high-quality development of urban agglomerations. This paper uses inverse distance weighted spatial interpolation, spatial autocorrelation and standard deviational ellipse to analyze the spatiotemporal heterogeneity of PM2.5 concentrations in the Yangtze River Delta. It also applies the systematic dynamic panel regression model to explore the nonlinear effects and driving mechanism of multidimensional urbanization on PM2.5 concentrations based on the remote sensing images and statistical data of urban panels in the study area from 2000 to 2017. The main conclusions are as follows: (1) From 2000 to 2017, the pollution level caused by PM2.5 concentrations evolved from low to high. Overall, the PM2.5 concentrations showed a spatial trend of increasing from southeast to northwest. (2) The PM2.5 concentrations exhibited significant spatial agglomeration and correlation characteristics. Meanwhile, the centroid of the PM2.5 concentrations generally shifted from southeast to northwest, and the PM2.5 concentrations tended to be dispersed in the east-west direction, while in contrast they were gradually polarized in the north-south direction. (3) There were significant differences in the impact of different development stages of the urbanization subsystem on the PM2.5 concentrations. The economic urbanization exhibits an inverted N relationship with the PM2.5 concentrations, which indicates that an Environmental Kuznets Curve (EKC) existed between the economic urbanization and PM2.5 concentrations. When the per capita GDP exceeds RMB 63,709 yuan, economic urbanization will have a restraining effect on the PM2.5 concentrations. This illustrates the fact that the improvement of urban development quality and transformation of urban development methods are the key to controlling PM2.5 pollution. However, the relationship among population urbanization, land urbanization and PM2.5 concentrations is only the left part of the inverted U curve, which indicates that population urbanization and land urbanization are still at a certain distance from the inflection point of air quality improvement. Last but not least, the population size, foreign investment and industrial structure all have a significant positive effect on PM2.5 concentrations, while environmental regulations have a significant negative effect on PM2.5 concentrations. It is worth noting that the spatiotemporal heterogeneity of PM2.5 concentrations is formed under the interactive overlay and cycle accumulation of socioeconomic factors, government regulations, and other factors in this region. Among them, socioeconomic factors play a leading role. This paper provides a new research perspective to explore the effects of multidimensional urbanization on PM2.5 concentrations, so that we can achieve coordination between environmental protection and urban sustainable development in the Yangtze River Delta.
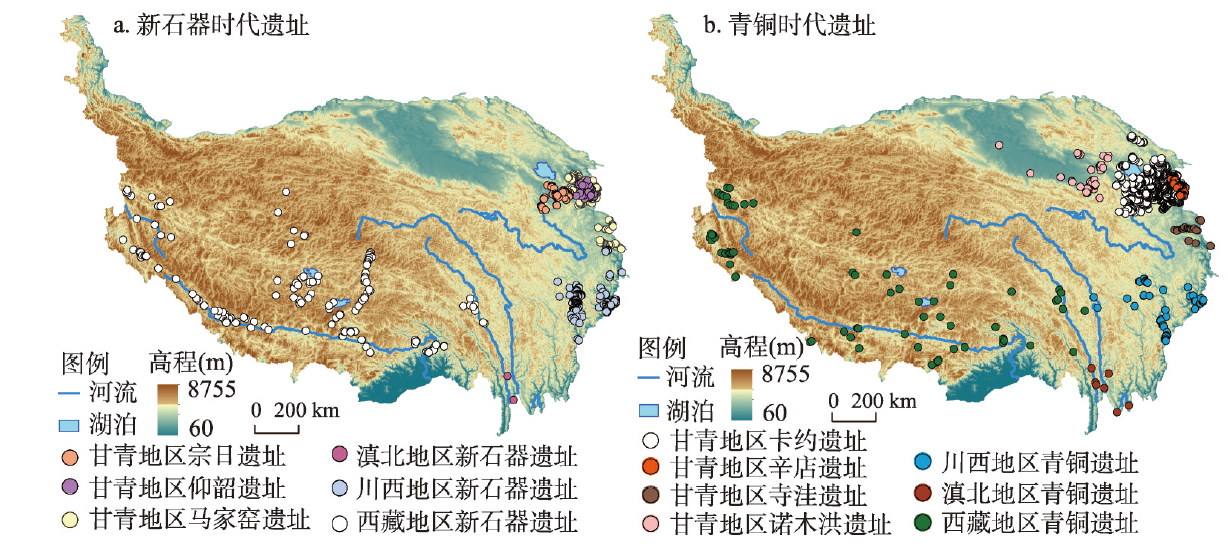
Eurasia mainland cultural exchange has been at the center of the international concern, especially after the Belt and Road Initiative was proposed. The unique geographical location of the Qinghai-Tibet Plateau made it important to strengthen the cultural exchange between the East and the West. This paper uses natural geographical factors and cultural sites in various time periods as data sources, based on cyclic cumulative analysis of the lowest cost path-multipoint connectivity, and GIS spatial analysis (R language) to construct cultural exchange routes from the Neolithic to Bronze Age. We constructed 27 routes in the Neolithic Age with a total length of 6000 km and 30 routes in the Bronze Age with a total length of 7800 km. During the Neolithic Age, the cultural exchange routes mainly exhibited a crescent form along the Northeast-East-Southeast-Southwest margin. By the Bronze Age, the cultural exchange routes expanded to the hinterland in a net form, due to the development of cultural exchange between the settlements. The reconstructed route testified the dissemination path of colored pottery, millet, jade, sheep, wheat and bronze technology, and concretized these archaeologically conceptualized roads. In addition, this paper identified that evolution of the early plateau route was significantly influenced by climate, and also influenced by agricultural technology, introduction of domesticated livestock.