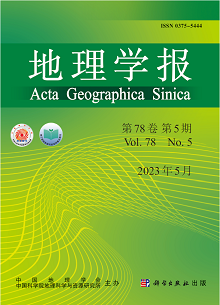
According to the Ministry of Water Resources of the People's Republic of China, the number of casualties in flash flood disasters accounts for nearly 70% of flood disaster casualties in recent years and flash flood has become one of the major natural disasters causing casualties in China. Flash flood regionalization is fundamental for implementing the local measures of the flash flood prevention and mitigation according to local conditions. Using results from existing flash flood relevant physiographical regionalization schemes, and in accordance with the principles of comprehensive, dominant factors, the relative consistency within units, the relative difference between units, the integrity of spatial distribution and the hierarchical divisions, this paper firstly constructs an index system of the flash flood trigger factors and its underlying surface environment for the flash flood regionalization in China. In the combination of top-down and bottom-up regionalization, the hybrid self-organizing-map-based spatial clustering algorithm is then built. Finally, nine homogeneous regions at the first-grade and thirty-three subregions at the second-grade are delineated for flash floods in China. The historical flash flood events and the Geodetector method are adopted to evaluate the developed regionalization schemes. Results show that the first-grade and the second-grade flash flood regionalization schemes in China can respectively provide the determinant power of 66.4% and 75.4% for the spatial distribution of historical flash flood events in the whole country, indicating the developed flash flood regionalization has a good spatial consistency with the distribution of historical flash flood events with different densities. The developed flash flood regionalization not only effectively delineates the regional differentiation pattern of flash floods, but also provides a scientific basis for the implementation of localized flash flood prevention and mitigation measures in China, which benefits for the sound development of flash flood disasters prevention and management in China.
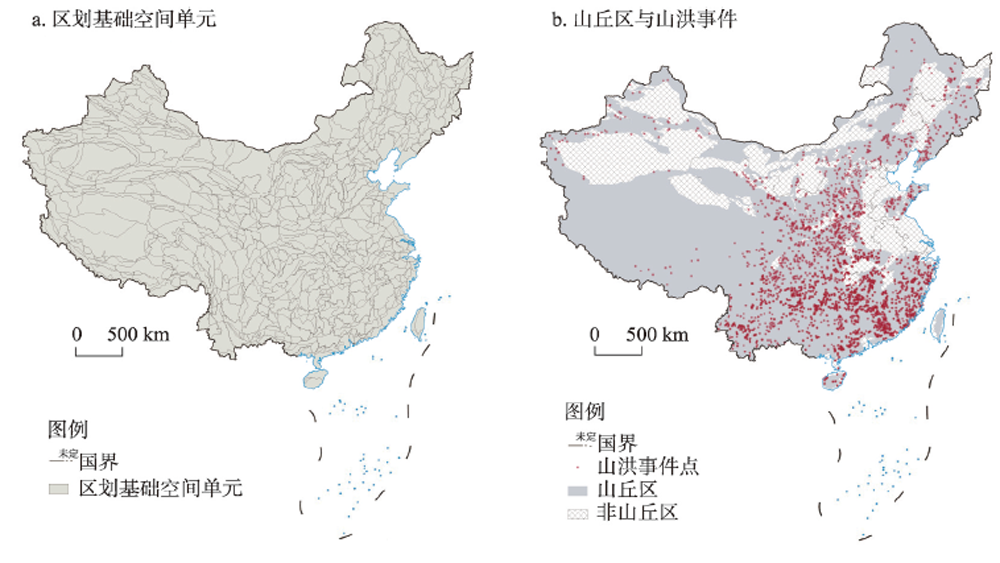
Mass mortality is one of the major threats posed by natural disasters to the population system, which consists of interactions between natural and socio-economic systems. Based on records of deaths extracted from the Integrated Natural Disaster Information System of the Qing Dynasty, events with mass deaths caused by natural disasters are identified, and the decadal deaths index series from 1644 to 1911 is reconstructed. The spatio-temporal characteristics and causes of these extreme events with mass deaths are also analyzed. The main results show the following. First, from 1644 to 1911, historical China suffered a high frequency of extreme events with mass deaths that occurred in 91 years, with events occurring once every three years on average. Second, the deaths index series varies significantly in three phases: Phase Ⅰ is from 1644 to the 1720s with a frequency and intensity close to the average over the entire Qing Dynasty; Phase Ⅱ is from the 1730s to the 1800s with a low frequency of events occurring in two years and in two provinces per decade; and Phase Ⅲ is from the 1810s to 1911 with a high frequency of events occurring in five years and in five provinces per decade. The maximum frequency and intensity appeared in the 1870s, whereas no extreme events with mass deaths occurred in the 1750s. Third, a total of 18 provinces experienced extreme events, and the spatial distribution of extreme events during the three phases differs. During Phase Ⅰ, extreme events were widely distributed but of relatively low intensity; such events occurred in fewer provinces during Phase Ⅱ. During Phase Ⅲ, extreme events occurred in 18 provinces with high intensity and their spatial distribution showed a significant pattern of floods in southern China and droughts in northern China. Finally, epidemics, famine, and flood were the main contributors to extreme events with mass deaths throughout the entire Qing Dynasty, with drought, heavy rain, and storm surges being the main indirect factors.
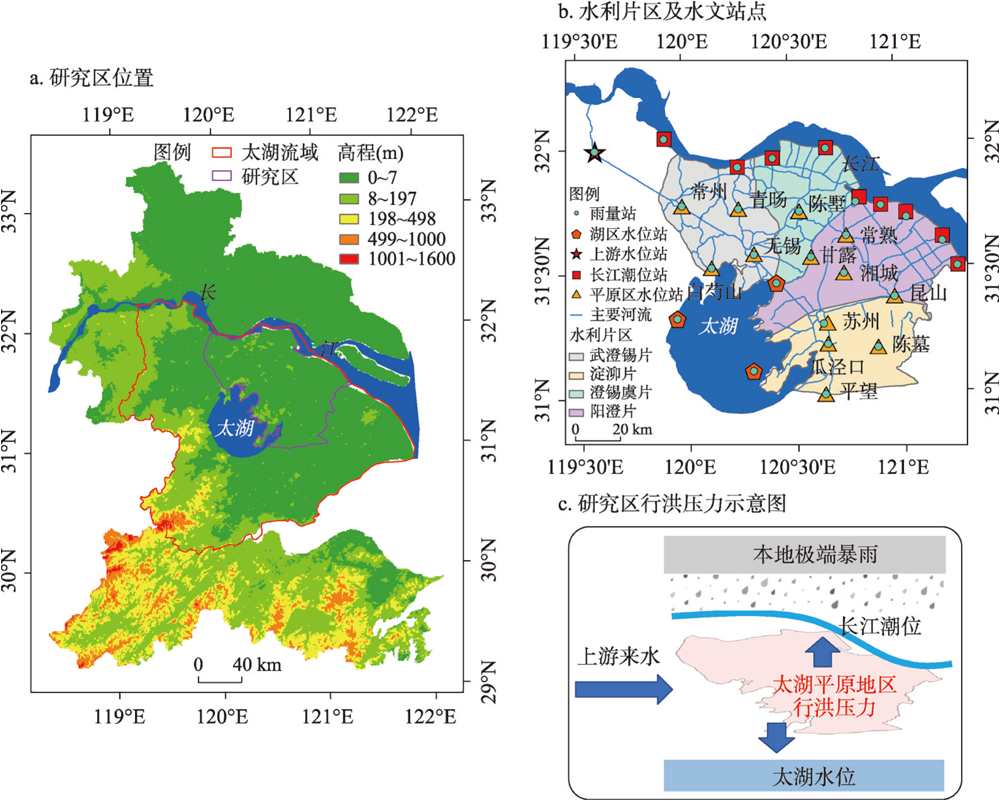
Under the background of urbanization and climate change, flood disasters are getting more and more serious. Floods tend to shift from single site to multi-sites and from urban area to suburb area, however, the mechanism of flood formation and transformation at different scales under changing environment is still unclear. In this study, we proposed a process-based flood event identification and scale division method. We then detected the characteristics, changes and driving mechanisms of local, regional and basin-scale floods at the Taihu Plain region during the past 50 years (1971-2020). The results indicate that floods in the study area showed distinct scales, with regional floods dominated (69.34%), and extraordinary floods were at basin sclae or regional scale. Floods in the study area showed a significant increase trend, mainly due to the increase of regional floods (accounting for 80.8%) in 1971-2020. Flood characteristics at different scales are significantly correlated with rainfall, tidal level, water level of the Taihu Lake, and upstream water amount. The antecedent conditions of water level were the main driving factor of local and regional floods (contributing 53.2% and 54.98%, respectively). Total rainfall played a dominant role in the rise of water level for local, regional and basin-scale floods, with the relative contributions of 64.91%, 65.01% and 78.72%, respectively. The main driving factors of flood characteristics at different scales and their influencing degree also have some spatial differences. The results of this study show that the spatial scale of floods has changed significantly under the background of changing environment in the Taihu Plain region, which would provide a feasible idea and reference for the identification of floods and mechanism analysis of its changes at different scales in this region or a similar estuary deltas area. This can help to ensure the regional flood control safety under the changing environment.
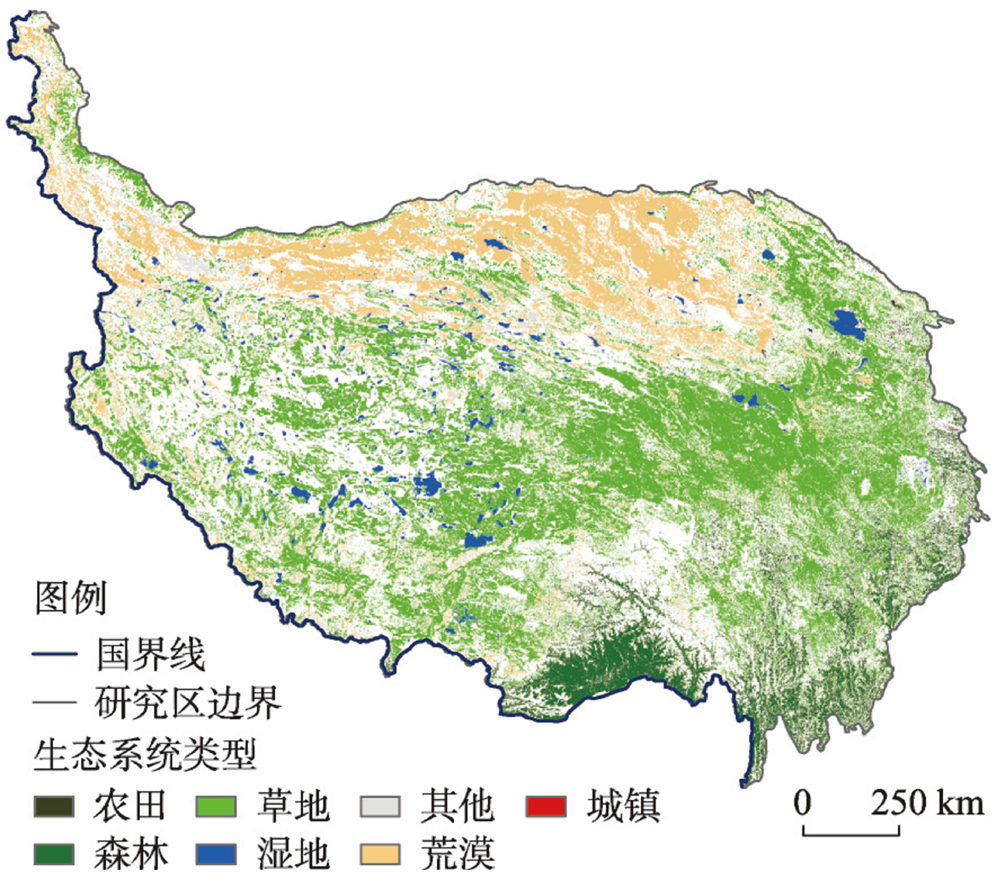
As the third pole of earth, the Qinghai-Tibet Plateau is an important ecological security barrier in China and an ecologically sensitive area of global climate change. The increasing climate change has posed a major challenge to its ecosystem function and stability. This paper first analyzes the spatiotemporal variation characteristics of the ecosystem pattern of the Qinghai-Tibet Plateau and its key functions including water conservation, soil conservation, windbreak and sand fixation from 2000 to 2020, clarifies the regional differences in ecosystem functions and their importance, and further evaluates the stability of ecosystem functions. And there is no doubt that the stable state will lay a scientific foundation for the plateau to build an ecologically civilized highland and launch protection and restoration projects. The results show that: (1) From 2000 to 2020, the wetland area of the study area increased and the grassland area decreased significantly. The water conservation and windbreak and sand fixation capacity were improved, and the annual change rates were 3.57 m3/(hm2·a) and 0.23 t/(hm2·a), respectively. However, the overall soil conservation showed a downward trend with an annual change rate of -0.16 t/(hm2·a). (2) The core areas of water conservation, soil conservation and windbreak and sand fixation accounted for 12.7%, 13.9% and 14.2%, respectively. The core water conservation barrier areas were mainly located in southeast Tibet, Sanjiangyuan and Ruoergai. The core windbreak and sand fixation areas were concentrated in the central and western parts of the plateau, and the core soil conservation areas surrounded the plateau. (3) From 2000 to 2020, the water conservation, soil conservation, and wind protection and sand-fixation functions have shown relatively high stability in the southeastern and central parts of the plateau, while relatively weak stability in the western part of the plateau. Combining stability assessment and ecological protection and restoration practices, we can divide the Qinghai-Tibet Plateau into three major categories of 16 ecosystem function zones and carry out differentiated ecological protection and restoration for different core ecosystem functions and zones.
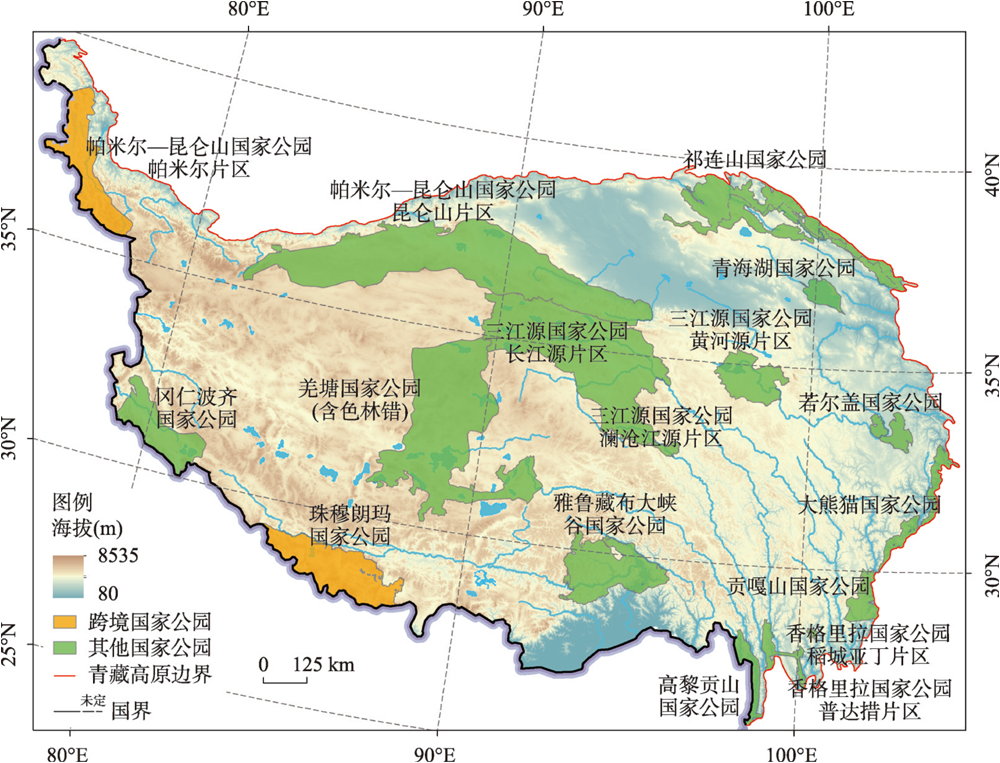
Protecting the uniqueness, authenticity and integrity of the human ecosystem is an important path to achieve sustainable development of the Qinghai-Tibet Plateau National Park Cluster. The integrated evaluation method, coupling coordination model and equilibrium entropy index were comprehensively used to outline the spatial distribution pattern regarding the coupling coordination of human ecosystem in the Qinghai-Tibet Plateau National Park Cluster, and the main obstacle dimensions were clarified with the help of obstacle degree model. The results show that: (1) The sustainable production capacity of human ecosystem in the study area decreased from east to west, and each dimension presented the sequence characteristics of "harmony > openness > independence > vulnerability". At the national park level, the Zoige National Park, Shangri-La National Park-Pudacuo Area and the Giant Panda National Park scored the highest on the sustainable production capacity, while at the county level, the scores of sustainable production capacity in the central counties of the Giant Panda National Park ranked highly. (2) On the whole, the coupling coordination degree of the human ecosystem in the cluster showed the spatial characteristics of decreasing from southeast to northwest. The majority of counties involved in the national park cluster were in the primary or intermediate coordination state, and the human ecosystem in most of the national parks exhibited coupling and mutual feed-forward of internal structure. (3) At the level of national parks and the counties involved in national parks, the first obstacle dimension of coupling coordination of human ecosystem was openness, followed by independence. The main reasons are mostly related to the geographical location, location conditions, topographic characteristics and economic basis of national parks. Therefore, improving openness and promoting material circulation and energy flow between human ecosystem and the outside world are still the primary tasks for protecting the human eco-security of national parks in the future.
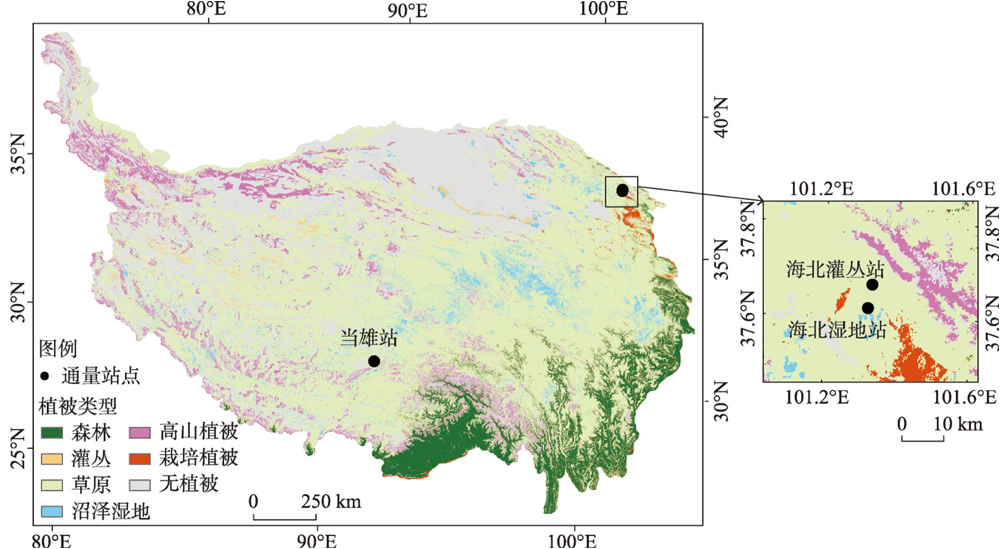
The extremely anoxic environment on the Qinghai-Tibet Plateau has a great impact on human and animal health. Studies of the contribution of vegetation to the atmospheric oxygen concentration on the Qinghai-Tibet Plateau are useful to clarify the environmental effects of changes in atmospheric oxygen concentration on human and animal health. Up to now, however, there are few such studies, and there is no spatio-temporal distribution map of the contribution rate. In this study, the vegetation net primary productivity was used to calculate the vegetation oxygen production on the Qinghai-Tibet Plateau, and the empirical equation of atmospheric relative oxygen concentration and the Ideal-Gas Equation were used to calculate the atmospheric absolute oxygen concentration, and then the ratio of the vegetation oxygen production and atmospheric absolute oxygen concentration was used to obtain the contribution rate. The results showed that the annual total vegetation oxygen production was 1.0353×10⁹ t on the Qinghai-Tibet Plateau in 2019. The theoretical upper limit value of the contribution rate of vegetation oxygen production to near-surface atmospheric oxygen concentration was 0.2788%/d on average over the plateau in 2019, but there were great differences across time and space (0.00 %/d to 4.62 %/d). In terms of temporal distribution, the change of contribution rate during the year is like a "∧" shape, the lowest value of the contribution rate in a year appeared during December through February of the next year, and the maximum value appeared in mid-August. In terms of spatial distribution, the contribution rate gradually decreased from southeast to northwest, with the lowest value in the northwest and the highest value in the southeast. From the perspective of vegetation types, the contribution rate per unit area from high to low was forest, cultivated vegetation, grassland, swamp wetland and shrub. From the perspective of altitude, the contribution rate per unit area gradually decreased with the increase of altitude. The spatial and temporal distribution map of the contribution rate was constructed in this paper, and the theoretical upper limit value of the contribution rate of vegetation oxygen production to atmospheric oxygen concentration on the plateau and its spatio-temporal variations were revealed. The results of this study can provide a reference for the studies on the changes of near-surface atmospheric oxygen concentration and its environmental effects on human and livestock on the Qinghai-Tibet Plateau.
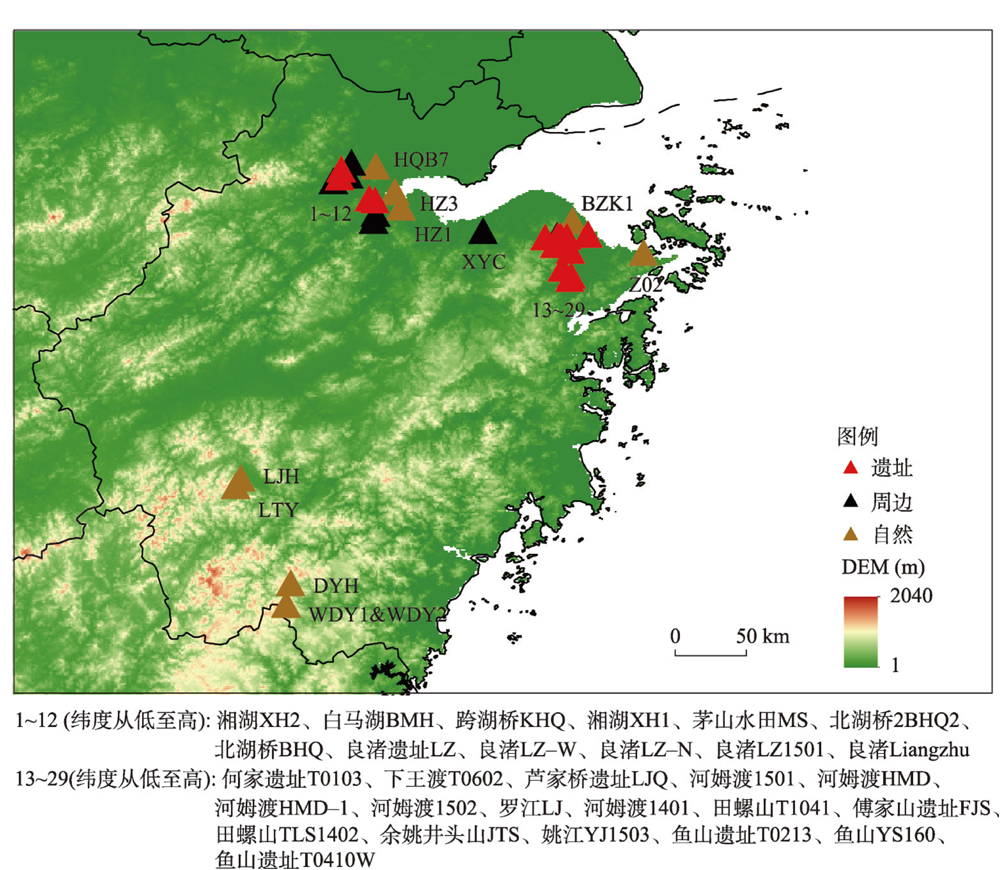
During the Holocene, human activities gradually intensified, resulting in significant interference and alteration of natural vegetation. Anthropogenic disturbance has been one of the most critical factors driving vegetation changes in some regions. The archaeological study illustrated that continuous Neolithic culture developed in Zhejiang during Holocene. However, the relationship between vegetation changes and human activities in this region remains unclear. Here, we collected 40 pollen records in Zhejiang and classified them into three groups, i.e., archaeological sites, peripheral sites and natural sites. After standardizing the chronology and taxonomy of those pollen data, we calculated the rate and pattern of vegetation changes (RoCs) by the R-Ratepol package and Biomisation. The results showed that the RoCs increased significantly at archaeological sites, with high variabilities during 9000-3000 cal a BP. The values of RoCs at peripheral sites were lower than that of archaeological sites but showed a dramatic increase after 3000 cal a BP. The RoCs at natural sites were the lowest and relatively stable before 2000 cal a BP; after 2000 cal a BP, it accelerated and outstripped that of archaeological and peripheral sites. The increased RoCs at both the peripheral and natural sites manifested that the spatial range of human impact on vegetation expanded significantly in the late Holocene. The vegetation change rates exerted by Neolithic human activities might be 2-3 times greater than that under the natural state. Furthermore, there was a certain deviation between the human-related and natural vegetation changes. The deforestation and cultivation of Neolithic ancestors led to the fragmentation of the terrestrial landscape. The residence time of biomes at archaeological sites was significantly lower than that in natural and peripheral sites. To sum up, long-term human activities in Zhejiang accelerated the regional vegetation changes and reduced the stability of terrestrial ecosystems. In pollen-based vegetation and climate reconstructions, and also in the practice of vegetation protection and restoration, the potential influence of long-term human activities must be considered.
The connection between Arctic Oscillation (AO) and net primary productivity (NPP) of vegetation in the Indo-Myanmar region during the period from 1981 to 2018 was quantitatively analyzed using regression analysis, composite analysis, and other methods based on AO index, vegetation NPP, and meteorological data. The results revealed that: (1) There is a significant in-phase relationship between winter AO and NPP in the Indo-Myanmar region, with a regional average NPP increasing (decreasing) significantly by 6.50 gC·m-2, and the maximum increment (decrement) reaching 20.60 gC·m-2 corresponding to a one standard deviation increase (decrease) of winter AO index. The correlation coefficient between AO and NPP time series reaches 0.57. (2) The AO primarily affects the atmospheric circulation over the Indo-Myanmar region through wave propagation, which in turn impacts precipitation and ultimately leads to abnormal NPP. During the positive (negative) phase of AO, a Rossby wave propagates eastward along the subtropical jet, resulting in anomalous cyclonic (anticyclonic) circulation in the mid-lower troposphere over the Bay of Bengal-Indo-Myanmar region. This tends to strengthen (weaken) the South-Branch Trough, which in turn enhances (weakens) the southwestward moisture transport and ascending motion ahead of the trough, both of which favor above-normal (below-normal) precipitation in the Indo-Myanmar region. With a one standard deviation increase (decrease) in the winter AO index, precipitation from five datasets significantly increases, with ERA5 and GPCC datasets showing a significant increase (decrease) of more than 12 mm at higher resolutions. The precipitation of anomalously positive AO years minus its negative ones can exceed 90 mm, and all of the correlation coefficients between the regional average precipitation and the AO index reach more than 0.50 (p < 0.01). Accompanied by a 1 mm increase (decrease) in precipitation, the NPP increase (decrease) exceeds 10.10 gC·m-2, and the correlation coefficients of the two time series exceed 0.40 (p <0.01).

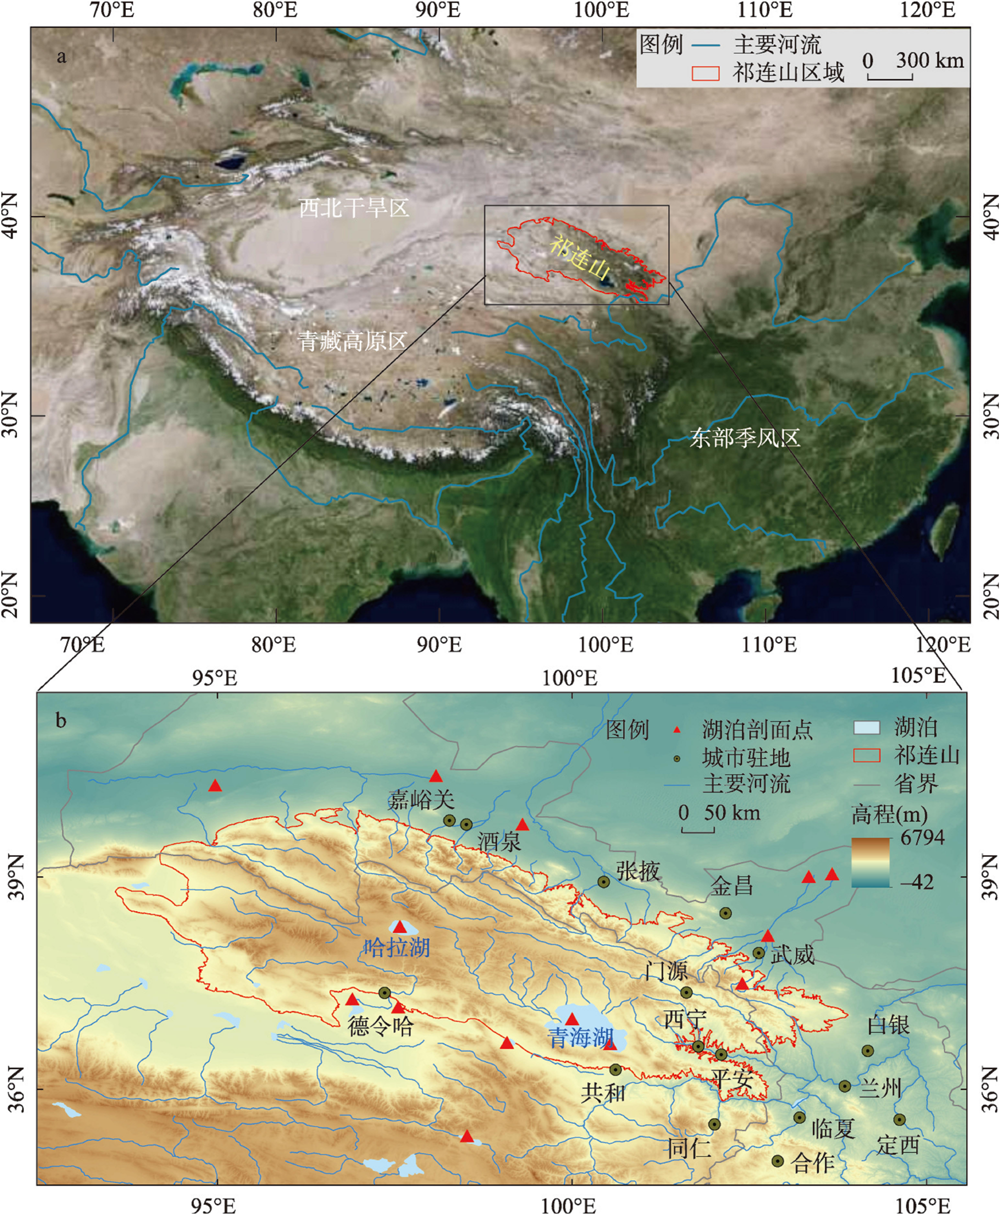
The process and mechanism of coupling between human activities and Holocene environmental change has become a research hotspot in the field of earth sciences. Lake sediments store rich environmental information, which can help to reconstruct past climate changes. Up to now, most of the studies on the palaeoenvironmental proxies indicating human activities have focused on single lakes, and there is a lack of comprehensive studies at a regional scale. Furthermore, relatively few studies focus on the identification of regional human activities through the paleoenvironmental proxies, partly due to the uncertainty of their indicative significance. In this paper, we analyzed the lithology, ages, and palaeoenvironmental proxy data from 14 closed-basin lakes around the Qilian Mountains, reconstructed the Holocene climate change, and explored the coupling relationship between climate change and human activities. The results are as follows: the organic matter in the terminal lakes in the Qilian Mountains and the surroundings is mostly from the mixed sources of aquatic and terrestrial plants; it was warm and humid during the early and middle Holocene around the Qilian Mountains, then it has experienced significant regional aridification since the late Holocene; the changes of sedimentary facies are consistent with proxies, which have different significance in various sediments. The changes of lake sedimentary facies have been affected by human activities since 2.0 cal ka BP, and human activities have dominated the regional environmental changes since 1800 AD.
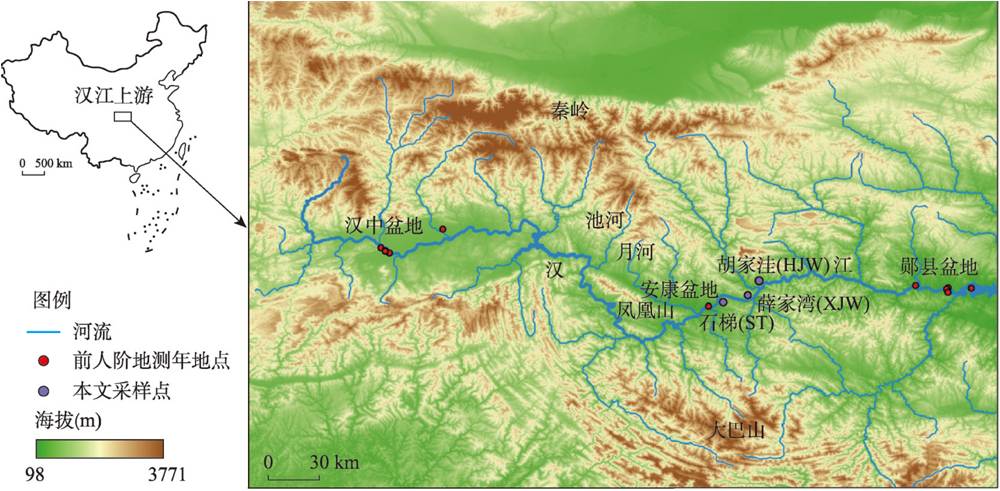
The Hanjiang River, located between the Qinling and Daba mountains, connects the Hanzhong, Ankang and other intermontane basins where there are numerous paleolithic sites. Here is an ideal area to explore the impacts of geomorphic processes on hominin activities. In this study, based on loess stratigraphy, magnetostratigraphy and detrital zircon U-Pb geochronology, the age of high terraces in the Ankang basin and the time of the drainage connection of the Ankang and Hanzhong basins by the Hanjiang River from west to east was determined. In addition, the possible influence of the evolution of landform and drainage network pattern of the Hanjiang River on the hominin occupation in the southern Qinling Mountains in the context of orbital scale climate change is discussed. The results show that (1) Eight terraces of the Hanjiang River were developed in the Ankang basin, with the sixth forming at ~1.82 Ma; (2) Most of these terraces were formed during the climatic transitions from interglacial to glacial periods, and more terraces were formed under the conditions of the Mid-Pleistocene climate transition (MPT) and the increase of uplift rate of the Qinling Mountains since 1.2 Ma; (3) It was not later than 1.82 Ma when the Hanjiang River connected the Ankang and Hanzhong basins as a result of river capture from east to west. River capture and the resulted connections of intermountain basins provided convenient geomorphological conditions for hominins to migrate into the Qinling and Daba mountains along broad river valleys since ~1.5 Ma, and thereafter fluvial terraces provided beneficial space for hominin activities.
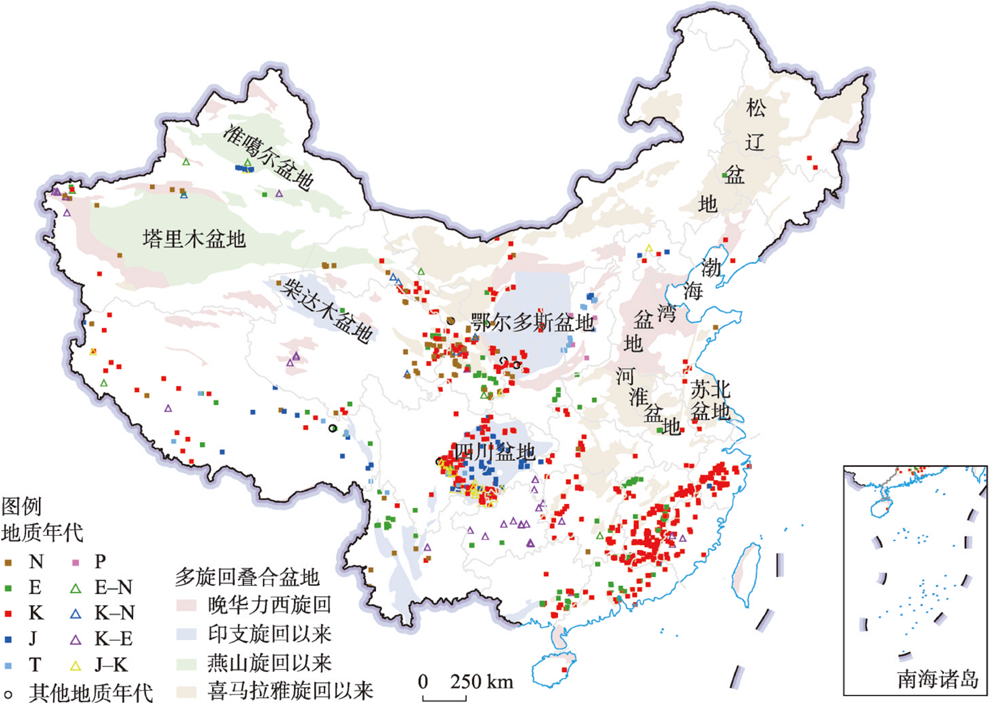
Danxia landscapes are a landscape feature with the Danxia landform as the main body, and are widely distributed in China. An in-depth understanding of the landscape differentiation on a national scale is essential for the protection and utilization of Danxia landscapes as tourism resource. Based on data such as lithology, cliff height, stratum attitude, rock strength, and other data, this study quantitatively analyzes the spatial pattern of Danxia landscapes. Combining these data with the understanding from an on-site survey of more than 200 Danxia landforms across the country, the differentiation of Chinese Danxia landscapes is semi-quantitatively determined. Based on multiple geologic and geomorphologic factors, the Danxia landscape in China is divided into six distinctive regions: Southeast China, the Sichuan-Chongqing-Guizhou junction, the Ordos Plateau, the southwestern Ordos Basin, "Tianshan-Qilian", and the Qinghai-Tibet Plateau. Through the national-scale comparison of Danxia landscapes, six key characteristics are noted. The basin size of red-bed deposits and the crustal uplift and subsidence during the Himalayan movement jointly controlled the spatial distribution of the Danxia landforms, while the tectonic deformation characteristics in different regions controlled the inclination of strata. The spatial lithological differences among different types of the basins affect the slope morphology. Rock strength has little effect on cliff height, but the difference in vertical rock strength affects the slope shape, which in turn affects the geomorphological process. The landform evolution stages affect the richness of individual and group landscapes. Finally, climate influences the currently active geomorphic processes, and the combination of vegetation and landforms in different climate zones shapes different Danxia landscape features and aesthetics. Nationally, the spatial distribution of Danxia characteristics is a regional manifestation of tectonic evolution, Earth's surface environment, and other factors.
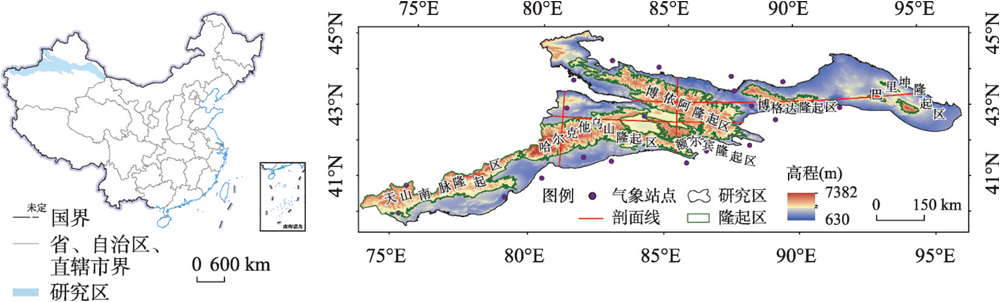
The mass mountain effect (MEE) is a thermal effect generated by the uplifted mountain, which has a universal and profound impact on the pattern of hydrothermal conditions and ecological geographical processes in mountainous areas. It is also one of the breakthroughs in mountain science research. Based on multi-source remote sensing data and observation data, we carried out the spatial downscaling inversion of temperature in the Tianshan Mountains of China, and explored the MEE estimation and spatio-temporal pattern analysis in the study area. The GeoDetector and GWR models are used to explore the temporal and spatial heterogeneity of the region. The results show that: (1) The temperature pattern of the study area is complex and diverse, and the overall distribution characteristics are high in the south and low in the north, and high in the east and low in the west. The zonal characteristics of temperature were obvious, and the temperature was negatively correlated with altitude, interior and exterior degree. (2) The warming effect of mountains was common and prominent, and the temperature at the same altitude increased in steps from west to east and from north to south. Geomorphological units such as large valleys and intermountain basins weaken the latitudinal zonality and altitude dependence of temperature at the same altitude, among which the warming effect of mountains was observed in the southern Tianshan Mountains, espectially in Erbin and Balikun. (3) The dominant factors affecting the overall pattern of the MEE in the study area were topography and location, among which the internal and external degrees and elevation played a prominent role. The interaction between factors has a greater influence on the spatial differentiation of mountain effects than that of single factors, and the interaction between terrain and climate, precipitation, NDVI and other factors is strong. (4) There was obvious spatial heterogeneity in the direction and intensity of the spatial variation of the MEE. Absolute elevation was significantly positively correlated with the change of mountain effect, while precipitation and NDVI were dominated by negative feedback. In general, topography has a greater effect on the macroscopic control of MEE, coupling with precipitation, underlying surface and other factors to form a unique mountain circulation system and climate characteristics, which in turn enhances the temporal and spatial heterogeneity of the MEE in the Tianshan Mountains. The results are a useful supplement to the analysis of the causes of MEE and their ecological effects.
As one of the pillar industries, the non-ferrous mining industry has caused severe environmental problems while supporting the development of the national economy. Understanding the spatial pattern and driving force of non-ferrous mining industrial sites (NMISs) is of great significance in promoting the optimization of industrial layout and the overall control of environmental pollution. However, the current research on the evolution of the national distribution pattern of NMISs is still insufficient, which is challenging to meet the actual needs of the existing related industry and environmental protection situation. In this paper, we obtained a high-resolution NMISs dataset, based on multi-source information fusion, including geographic big data, Gaode POI, and special environmental data. We also investigated the spatio-temporal pattern, evolution characteristics, and driving factors of NMISs from the beginning of the 20th century to 2019 based on the spatial regression model and the GIS platform. The results showed that the growth of NMISs in China has generally experienced a stable and slow development trend in the early period (before 1978), gradually reaching a peak after the reform and opening up (1979-2006), and then stabilizing again (2007-). With the continuous enhancement of spatial agglomeration of NMISs, the hotspot areas gradually extended from southeast Hunan and central Yunnan to central and western China, which is rich in resources and energy, presenting an agglomeration pattern of "four cores and multiple sub-cores". The cores include eastern Yunnan, the Hunan-Jiangxi-Guangdong junction area, southern Anhui, and western Henan. The sub-cores included parts of Northwest and Northeast China. Further, the above spatio-temporal evolution characteristics were controlled by the positive promotion of resource endowment, path dependence, and the earlier encouraging industrial policy. However, we observed the emerging negative restraining effect on the recent pattern of NMISs from the tightening of related restrictive industrial and environmental policies introduced intensively after 2010. This paper could provide a reliable scientific basis and information support for optimizing related macro-strategic decision-making and environmental spatial governance by analyzing spatio-temporal patterns and the driving factors of China's NMISs. Furthermore, this study proposed the methodological system for constructing national-scale high-precision industrial site datasets by applying multi-source geographic big data technology. The current paper also provided a new perspective and ideas for the related assessment at a large regional scale.

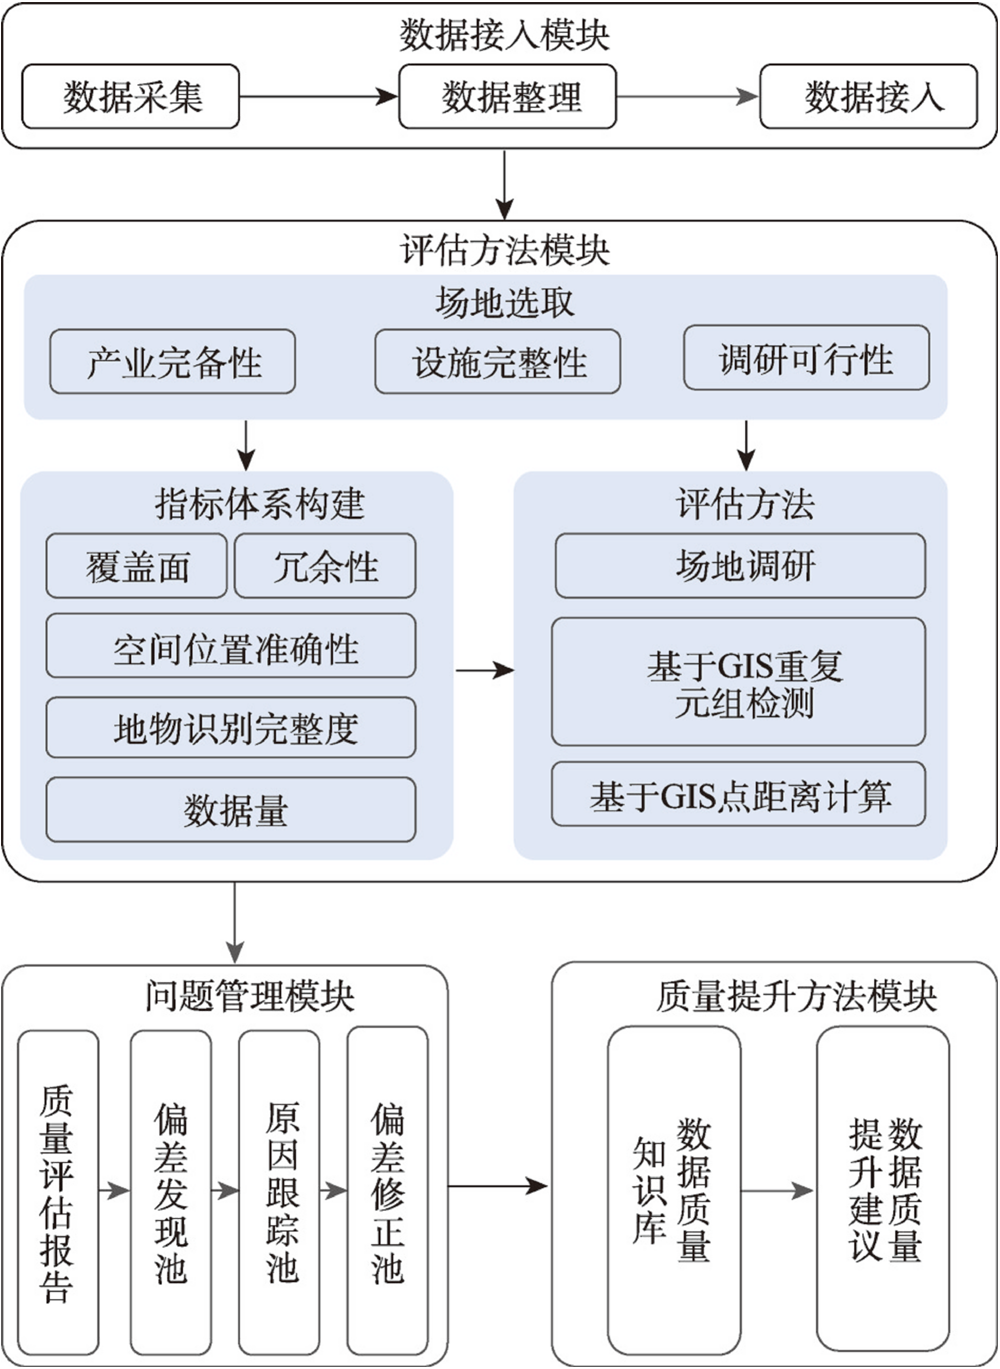
Geographic big data enables a fine-grained depiction of regional human-terrestrial systems and provides new data for the study of human-terrestrial relations and regional development. At present, geographic big data research has entered the stage of widespread application, but the examination of its quality and the corresponding evaluation methods have been lacking to guarantee the widespread and efficient application of the data. POI is an important part of geographic big data and plays an important role in location-based services and an understanding of regional scenarios. This paper proposes a method to assess and enhance POI-type big data, and realize quality evaluation based on site research, GIS and other methods from three dimensions: feature identification completeness, data redundancy rate and spatial location accuracy; discover and summarize possible influencing factors of data quality based on data production process, and prove that multi-source data fusion is an effective means to enhance POI data quality. We found that: the volume of Amap data acquired based on API interface is slightly higher than that of Baidu, the accuracy rate of spatial location is comparable and the redundancy rate is lower; Amap focuses on identifying the entrance of features, which is suitable for analysis such as accessibility; Baidu focuses on discovering non-significant features, which is suitable for analysis such as spatial planning; the discovery, acquisition and processing stages are possible links to reduce data quality, which is influenced by data protection mechanism, and the data quality is inversely proportional to the acquisition volume and area. The quality assessment, enhancement and integration of multi-source heterogeneous geographic data is one of the key ways to enhance the "emergent value" of data, promote trans- and cross-multidisciplinary and solve geographic problems in the new era.
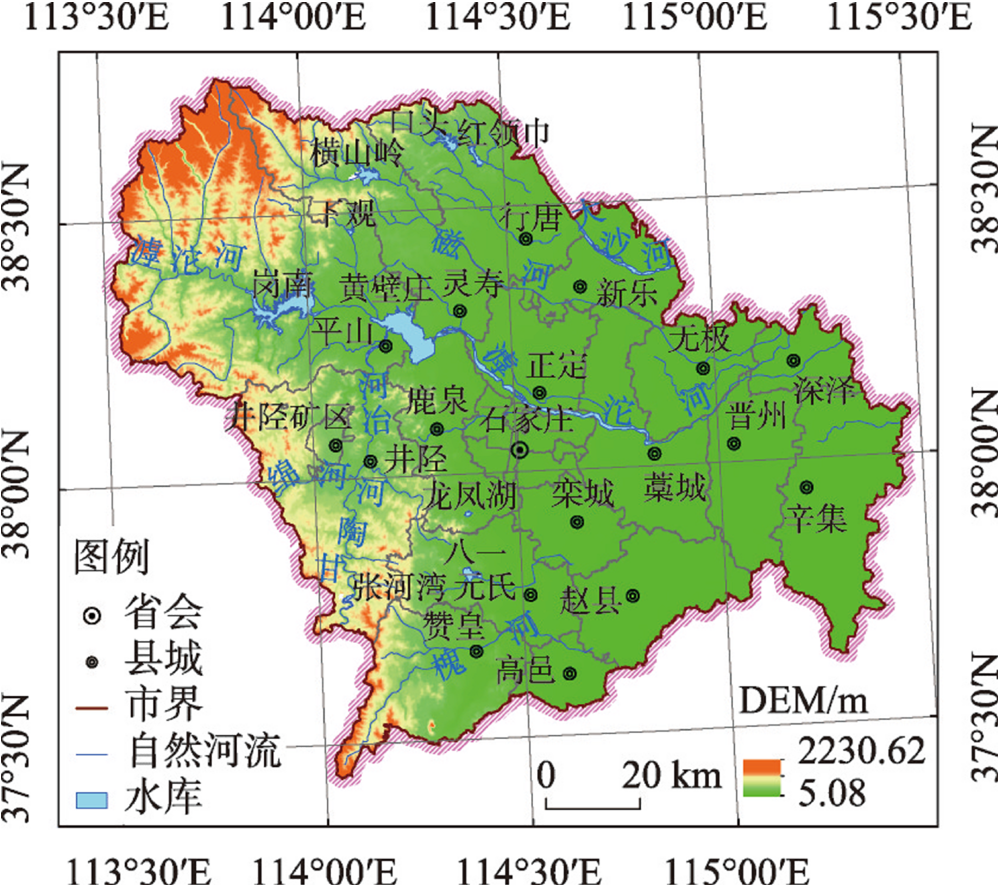
Random forest model is a mainstream research method to accurately describe the regional population distribution law and impact mechanism. Taking Shijiazhuang as the experimental area and its endowment zones as the modeling unit, we carried out stratified sampling on a hectare grid scale, and conducted a systematic experiment to determine the factors influencing the increasing population density. An optimized random forest model was applied throughout the whole process of zoning modeling, stratified sampling, factor selection, to obtain weighted outputs. Four main conclusions can be drawn as follows: (1) Zoning before modeling prevented the model from confusing the population distribution laws. Sampling at the raster unit not only freed the training samples from the modifiable areal unit problem (MAUP), but also formally reduced the negative effect of the ecological fallacy. Stratified sampling ensured the stability of the maximum population density in the training samples. (2) The experiments to determine the factors influencing population density were conducted in different zones, and the introduction of these factors significantly improved the fit (R2) of the model. Distance to a settlement was the dominant factor influencing population density in each zone. There were significant differences in the geographical mechanisms that influenced the population distribution in different regions. Innovation endowment factors had the strongest impact on population density in urban areas, while natural endowment factors had the strongest impact in rural areas. (3) The optimized combination of the population density prediction datasets significantly improved the robustness of the model. (4) The population density datasets had the characteristics of multi-scale superposition. At the large scale, the population density in the plain area was higher than that in the mountain area, whereas at the small scale the population density in urban areas was higher than that in rural areas, which represented the characteristics of a core-periphery model. The optimized scheme of the population density random forest model provided a unified technical framework for determining the factors that control the local population distribution and the geographical mechanisms that influence population distribution.