×
模态框(Modal)标题
在这里添加一些文本
Close
Close
Submit
Cancel
Confirm
×
模态框(Modal)标题
×
Journal
Article
Figure
Search
EN
中文
Home
About Journal
About Journal
Indexed in
Awards
Editorial Board
Guide for Authors
Browse
Current Issue
Online First
Archive
Highlights
Topic
Archive by Subject
Most Viewed
Most Download
Most Cited
E-mail Alert
RSS
Subscribe
Advertisement
Contact us
EN
中文
Figure/Table detail
Spatio-temporal pattern of cropland abandonment in China from 1992 to 2017: A Meta-analysis
Xuezhen ZHANG, Caishan ZHAO, Jinwei DONG, Quansheng GE
Acta Geographica Sinica
, 2019, 74(
3
): 411-420. DOI:
10.11821/dlxb201903001
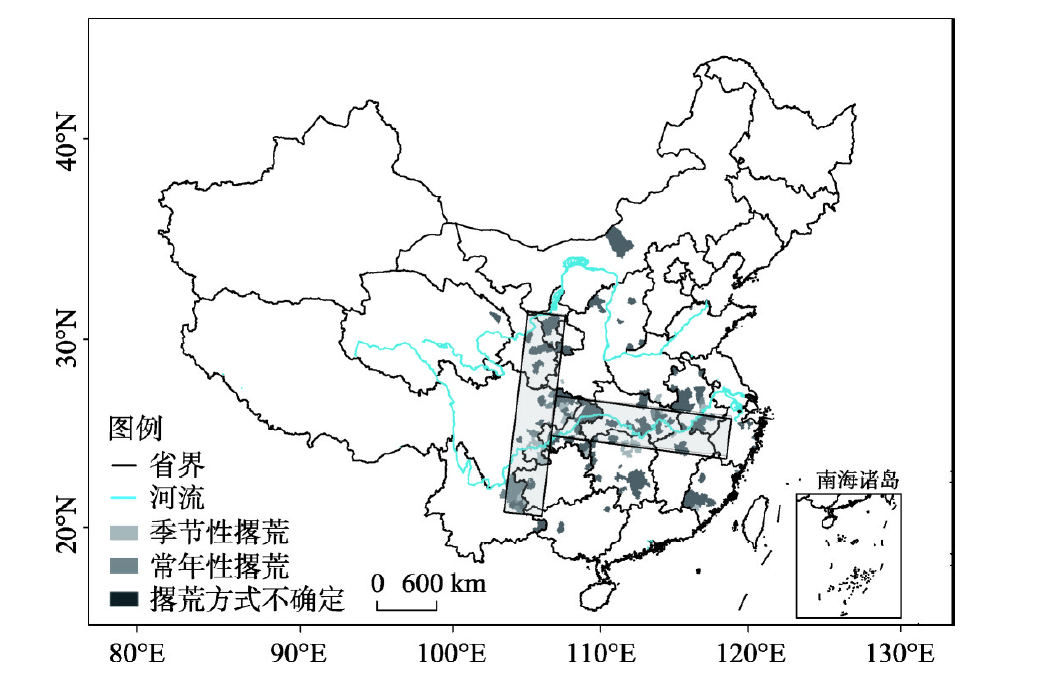
Fig. 1
Spatial distribution of cropland abandonment at county level in China
Other figure/table from this article
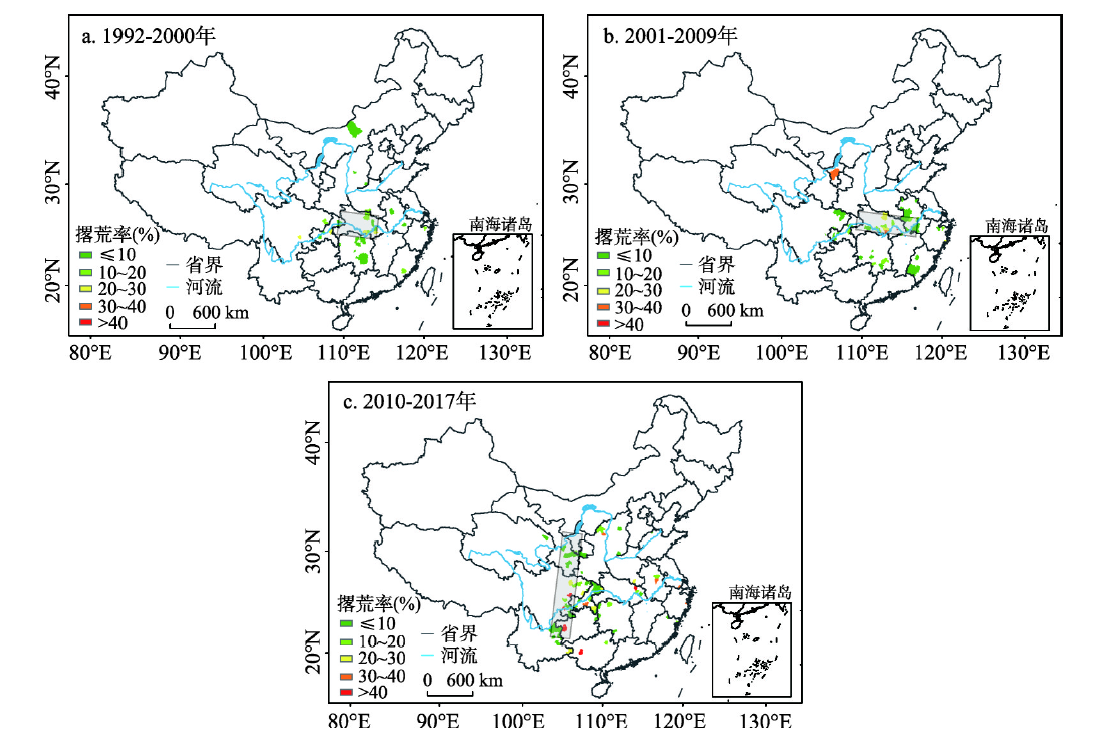
Fig. 2
Spatial distribution of cropland abandonment at county level in China in each stage
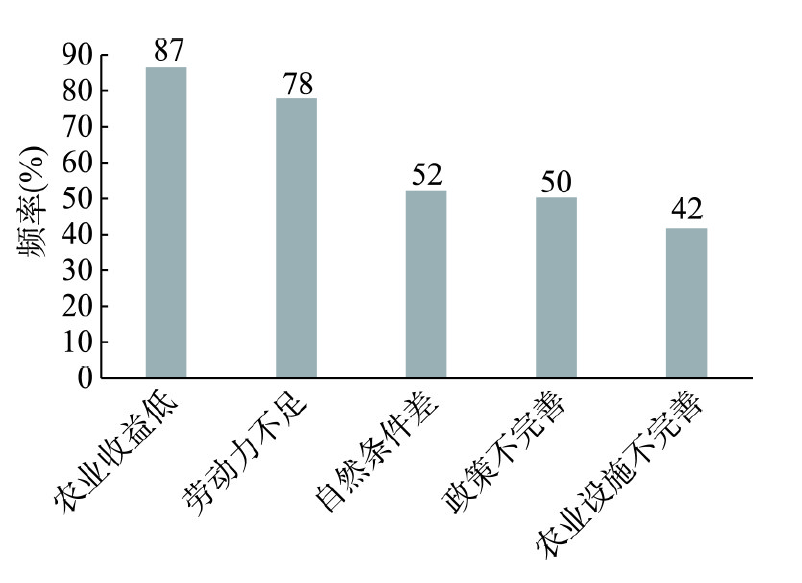
Fig. 3
Frequencies of the main determinants of cropland abandonment
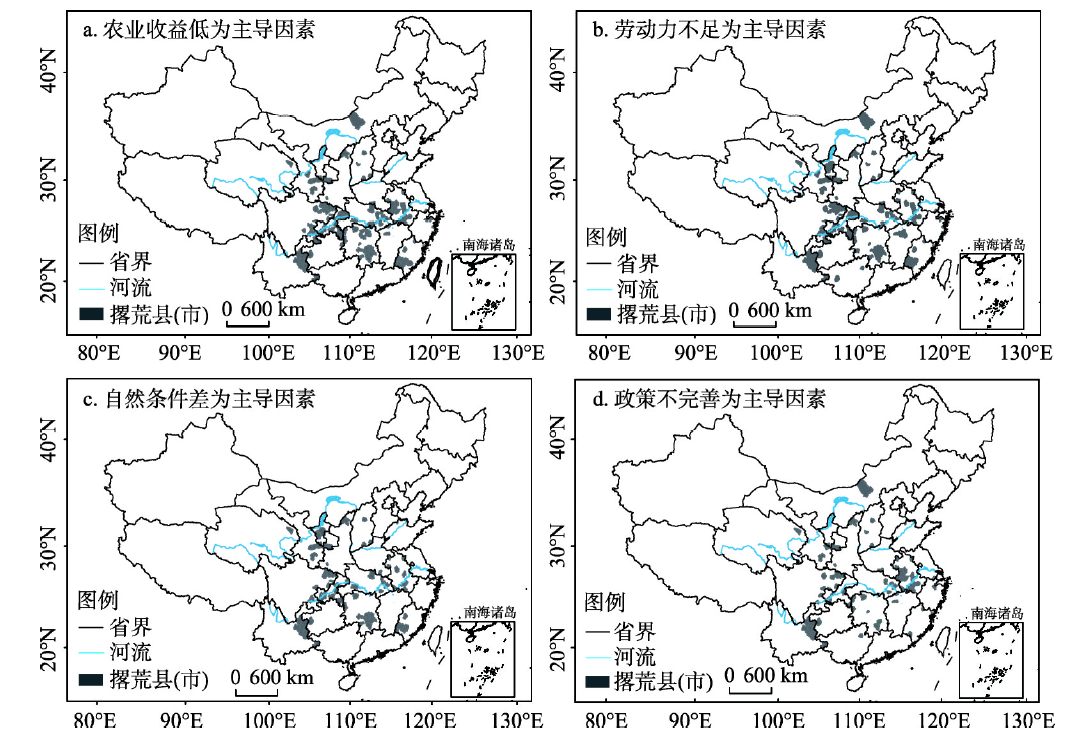
Fig. 4
Spatial distribution of the main drivers of cropland abandonment in China
Tab. 1
Gross Domestic Product (GDP) per capita (10
3
yuan) of each province in the T-shaped area of cropland abandonment in China
Tab. 2
Percentage of agricultural employees against total population of each province within the T-shaped area of cropland abandonment in China (%)
Tab. 3
Grain sown area of each province within the T-shaped area of cropland abandonment in China (10
3
hm
2
)