×
模态框(Modal)标题
在这里添加一些文本
Close
Close
Submit
Cancel
Confirm
×
模态框(Modal)标题
×
Journal
Article
Figure
Search
EN
中文
Home
About Journal
About Journal
Indexed in
Awards
Editorial Board
Guide for Authors
Browse
Current Issue
Online First
Archive
Highlights
Topic
Archive by Subject
Most Viewed
Most Download
Most Cited
E-mail Alert
RSS
Subscribe
Advertisement
Contact us
EN
中文
Figure/Table detail
Evolution of major productive force layout and spatial form simulation in China
CAO Weidong, CAO Ji, ZHANG Wenrui, YUE Wenbo, CAO Yuhong
Acta Geographica Sinica
, 2024, 79(
12
): 3030-3049. DOI:
10.11821/dlxb202412007
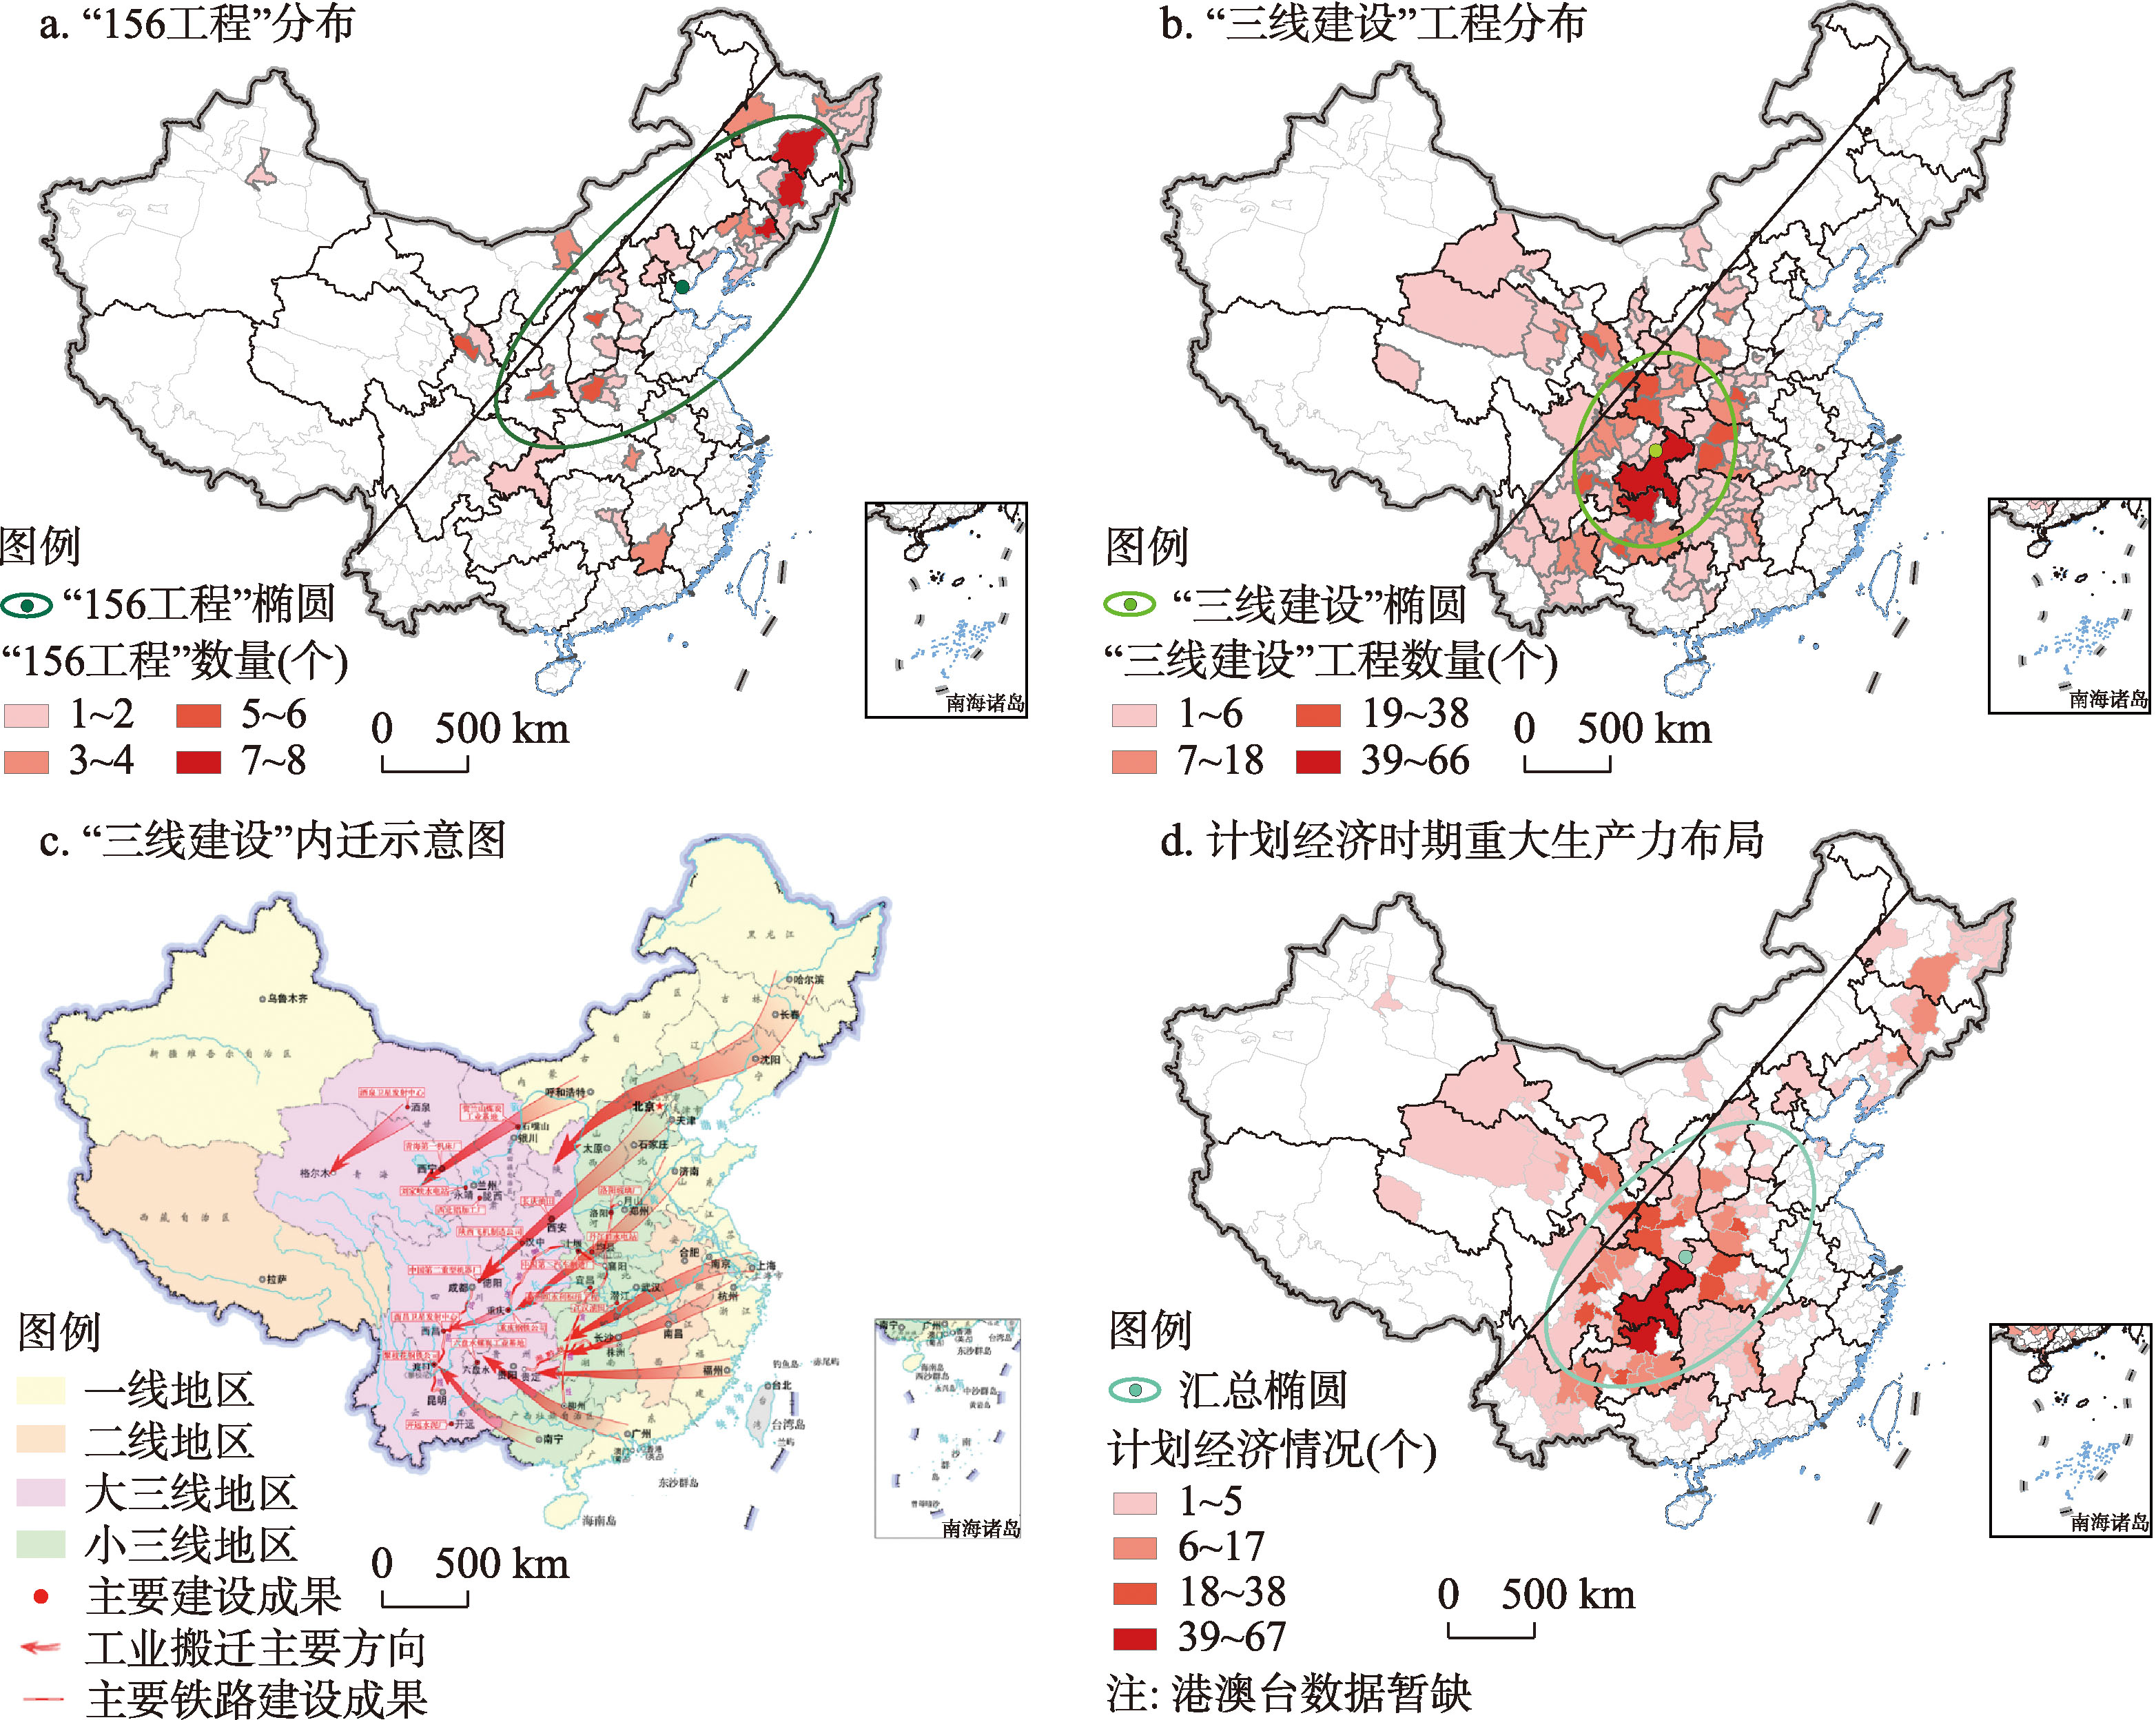
地区分类
“156工程”数量
“三线建设”工程数量
东部地区
6
0
西部地区
20
140
东北地区
50
0
中部地区
36
63
Tab. 3
Distribution of the layout of major projects during 1949-1977
Other figure/table from this article
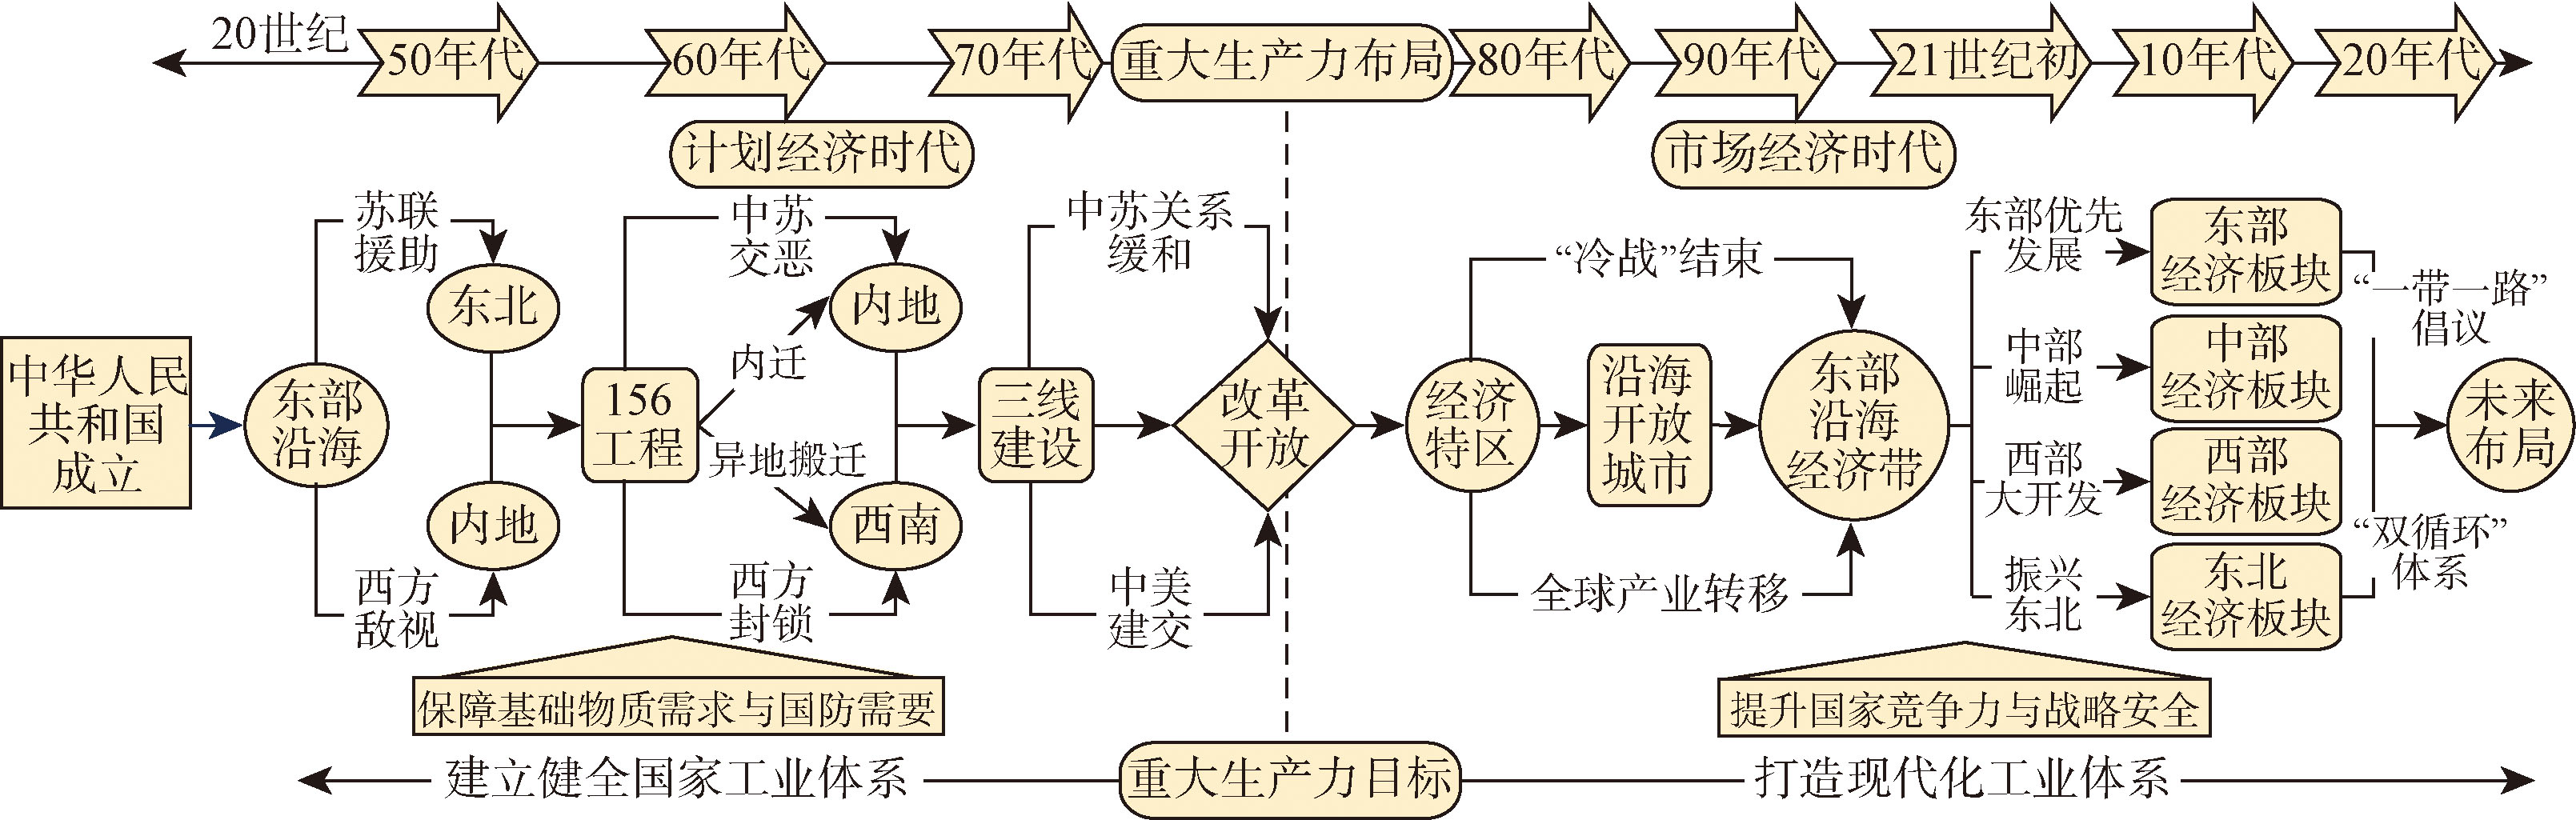
Fig. 1
Timeline of the development of China's major productive forces layout
Tab. 1
Local productive forces development evaluation indicator system
Tab. 2
Data sources
Fig. 2
Distribution of major productive forces in the period of planned economy (1949-1977)
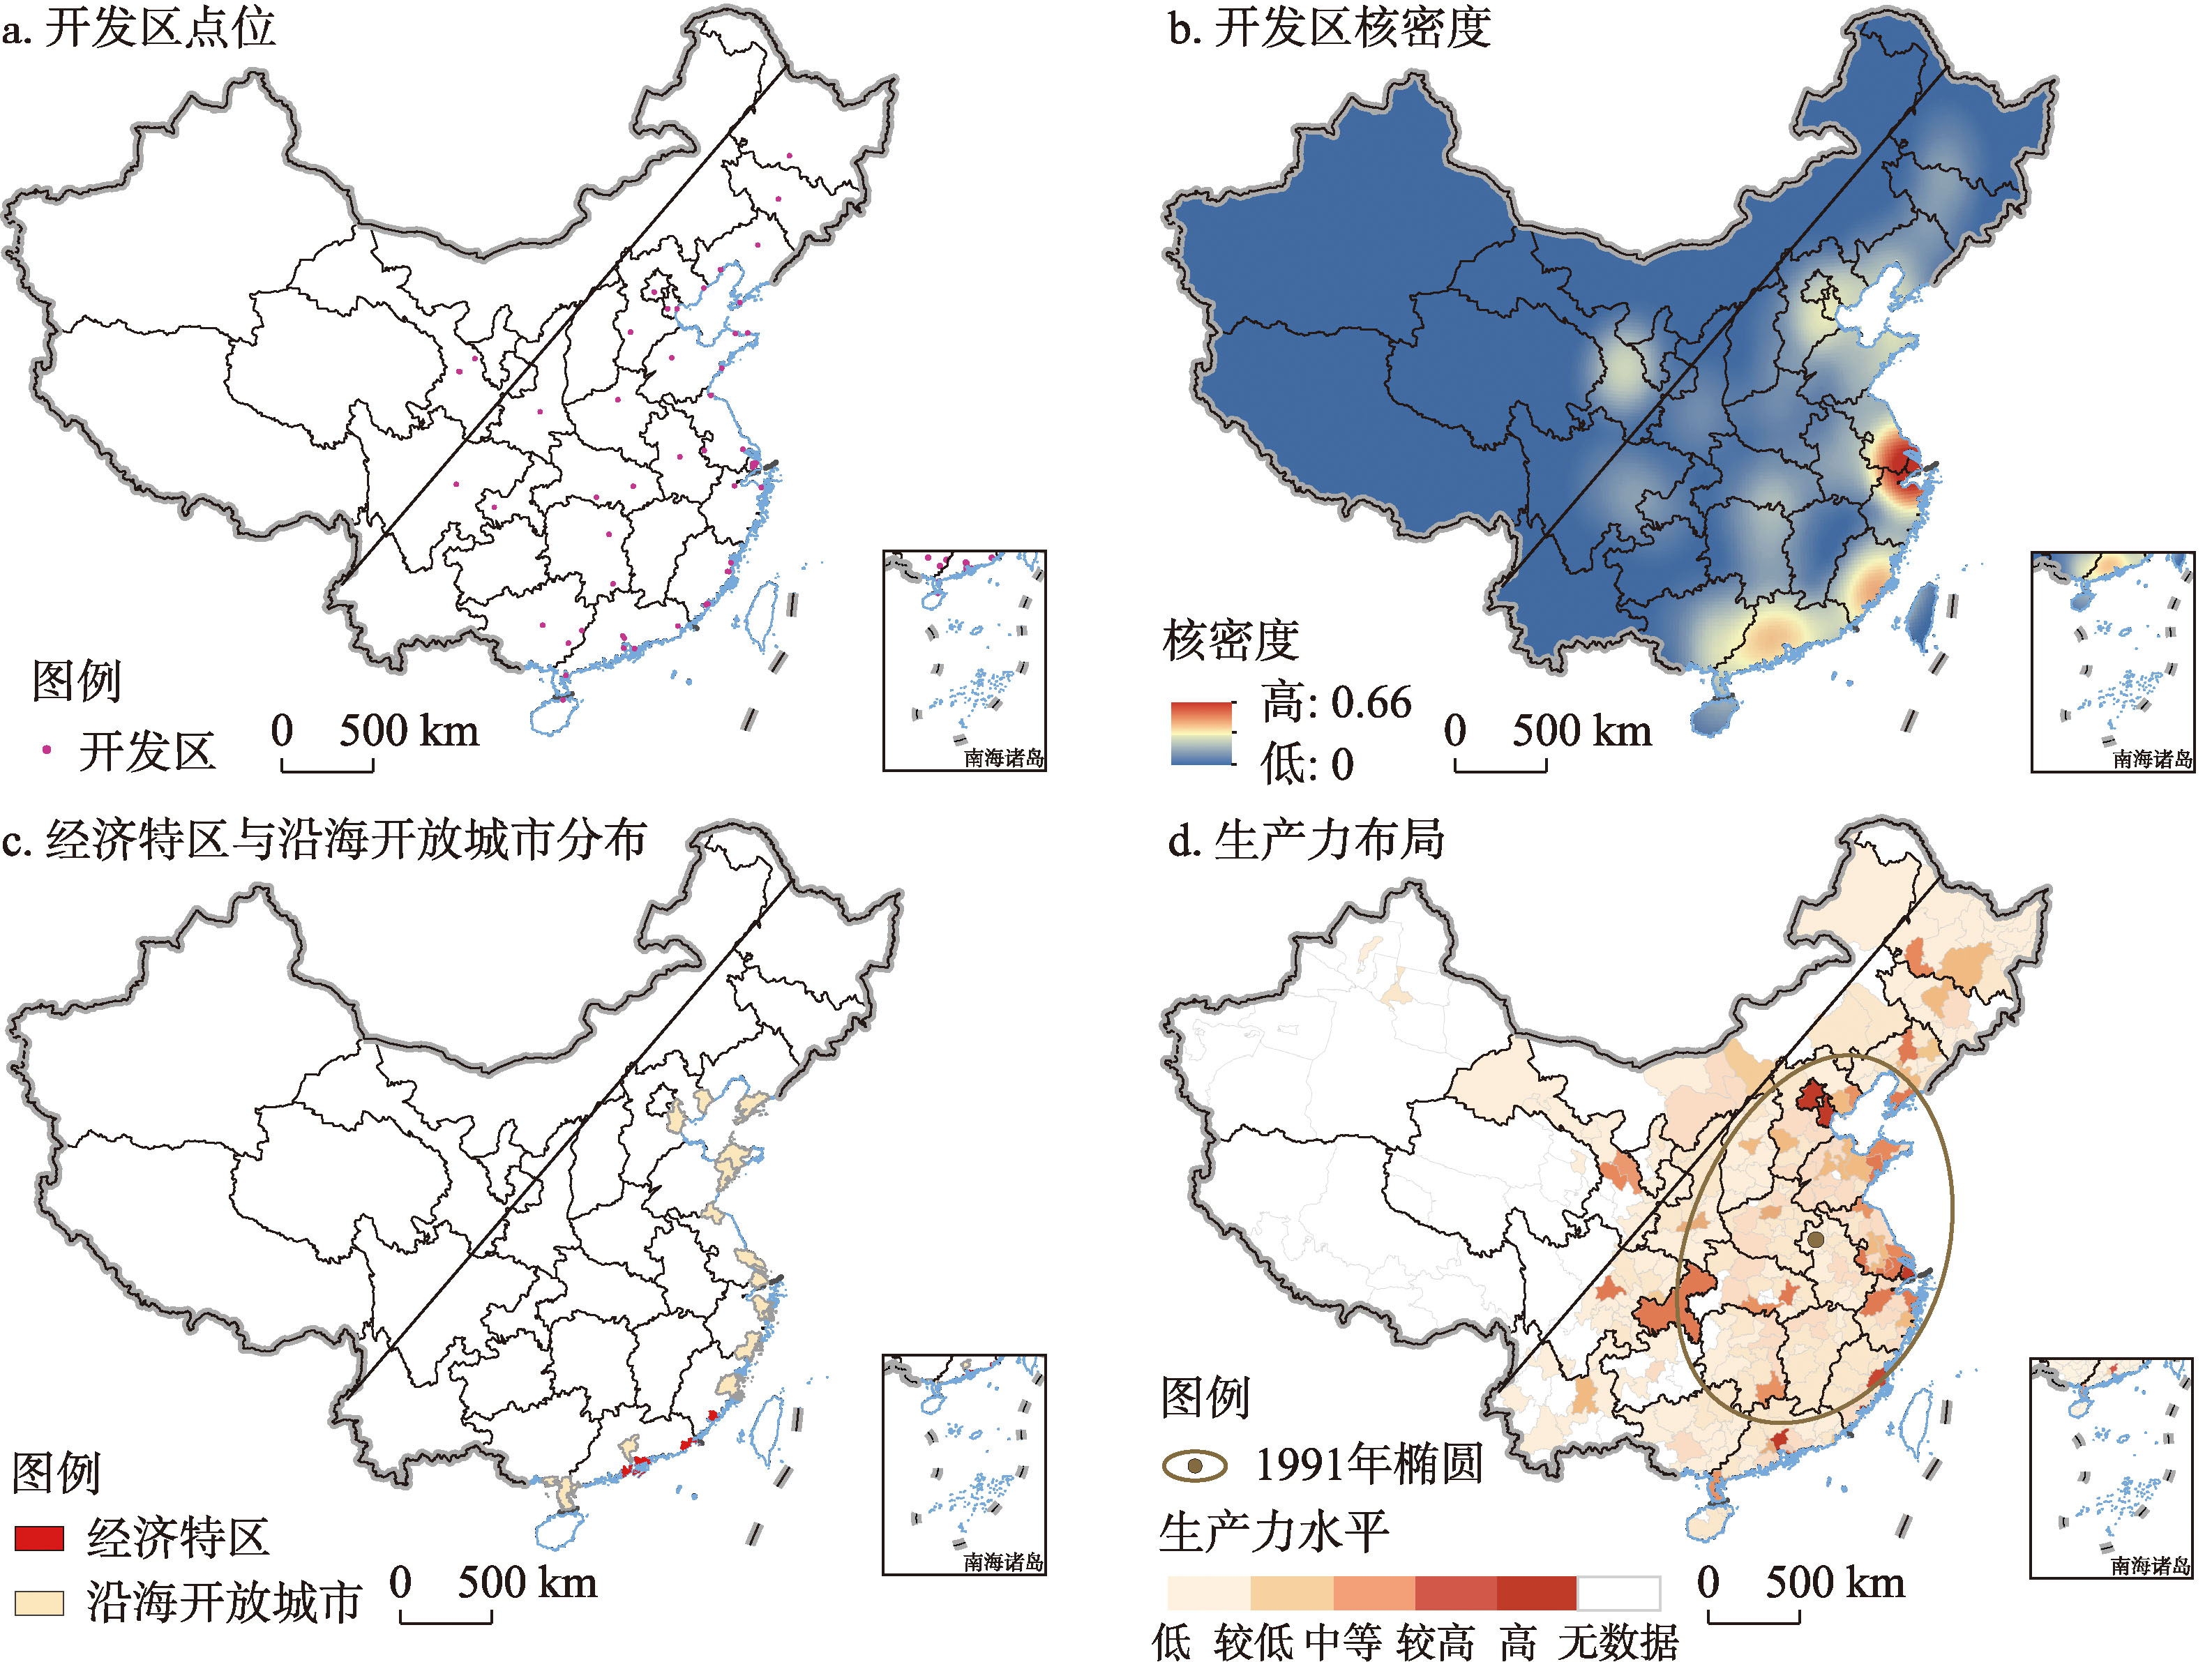
Fig. 3
China's major productive forces layout and its pole-axis space form simulation in 1991
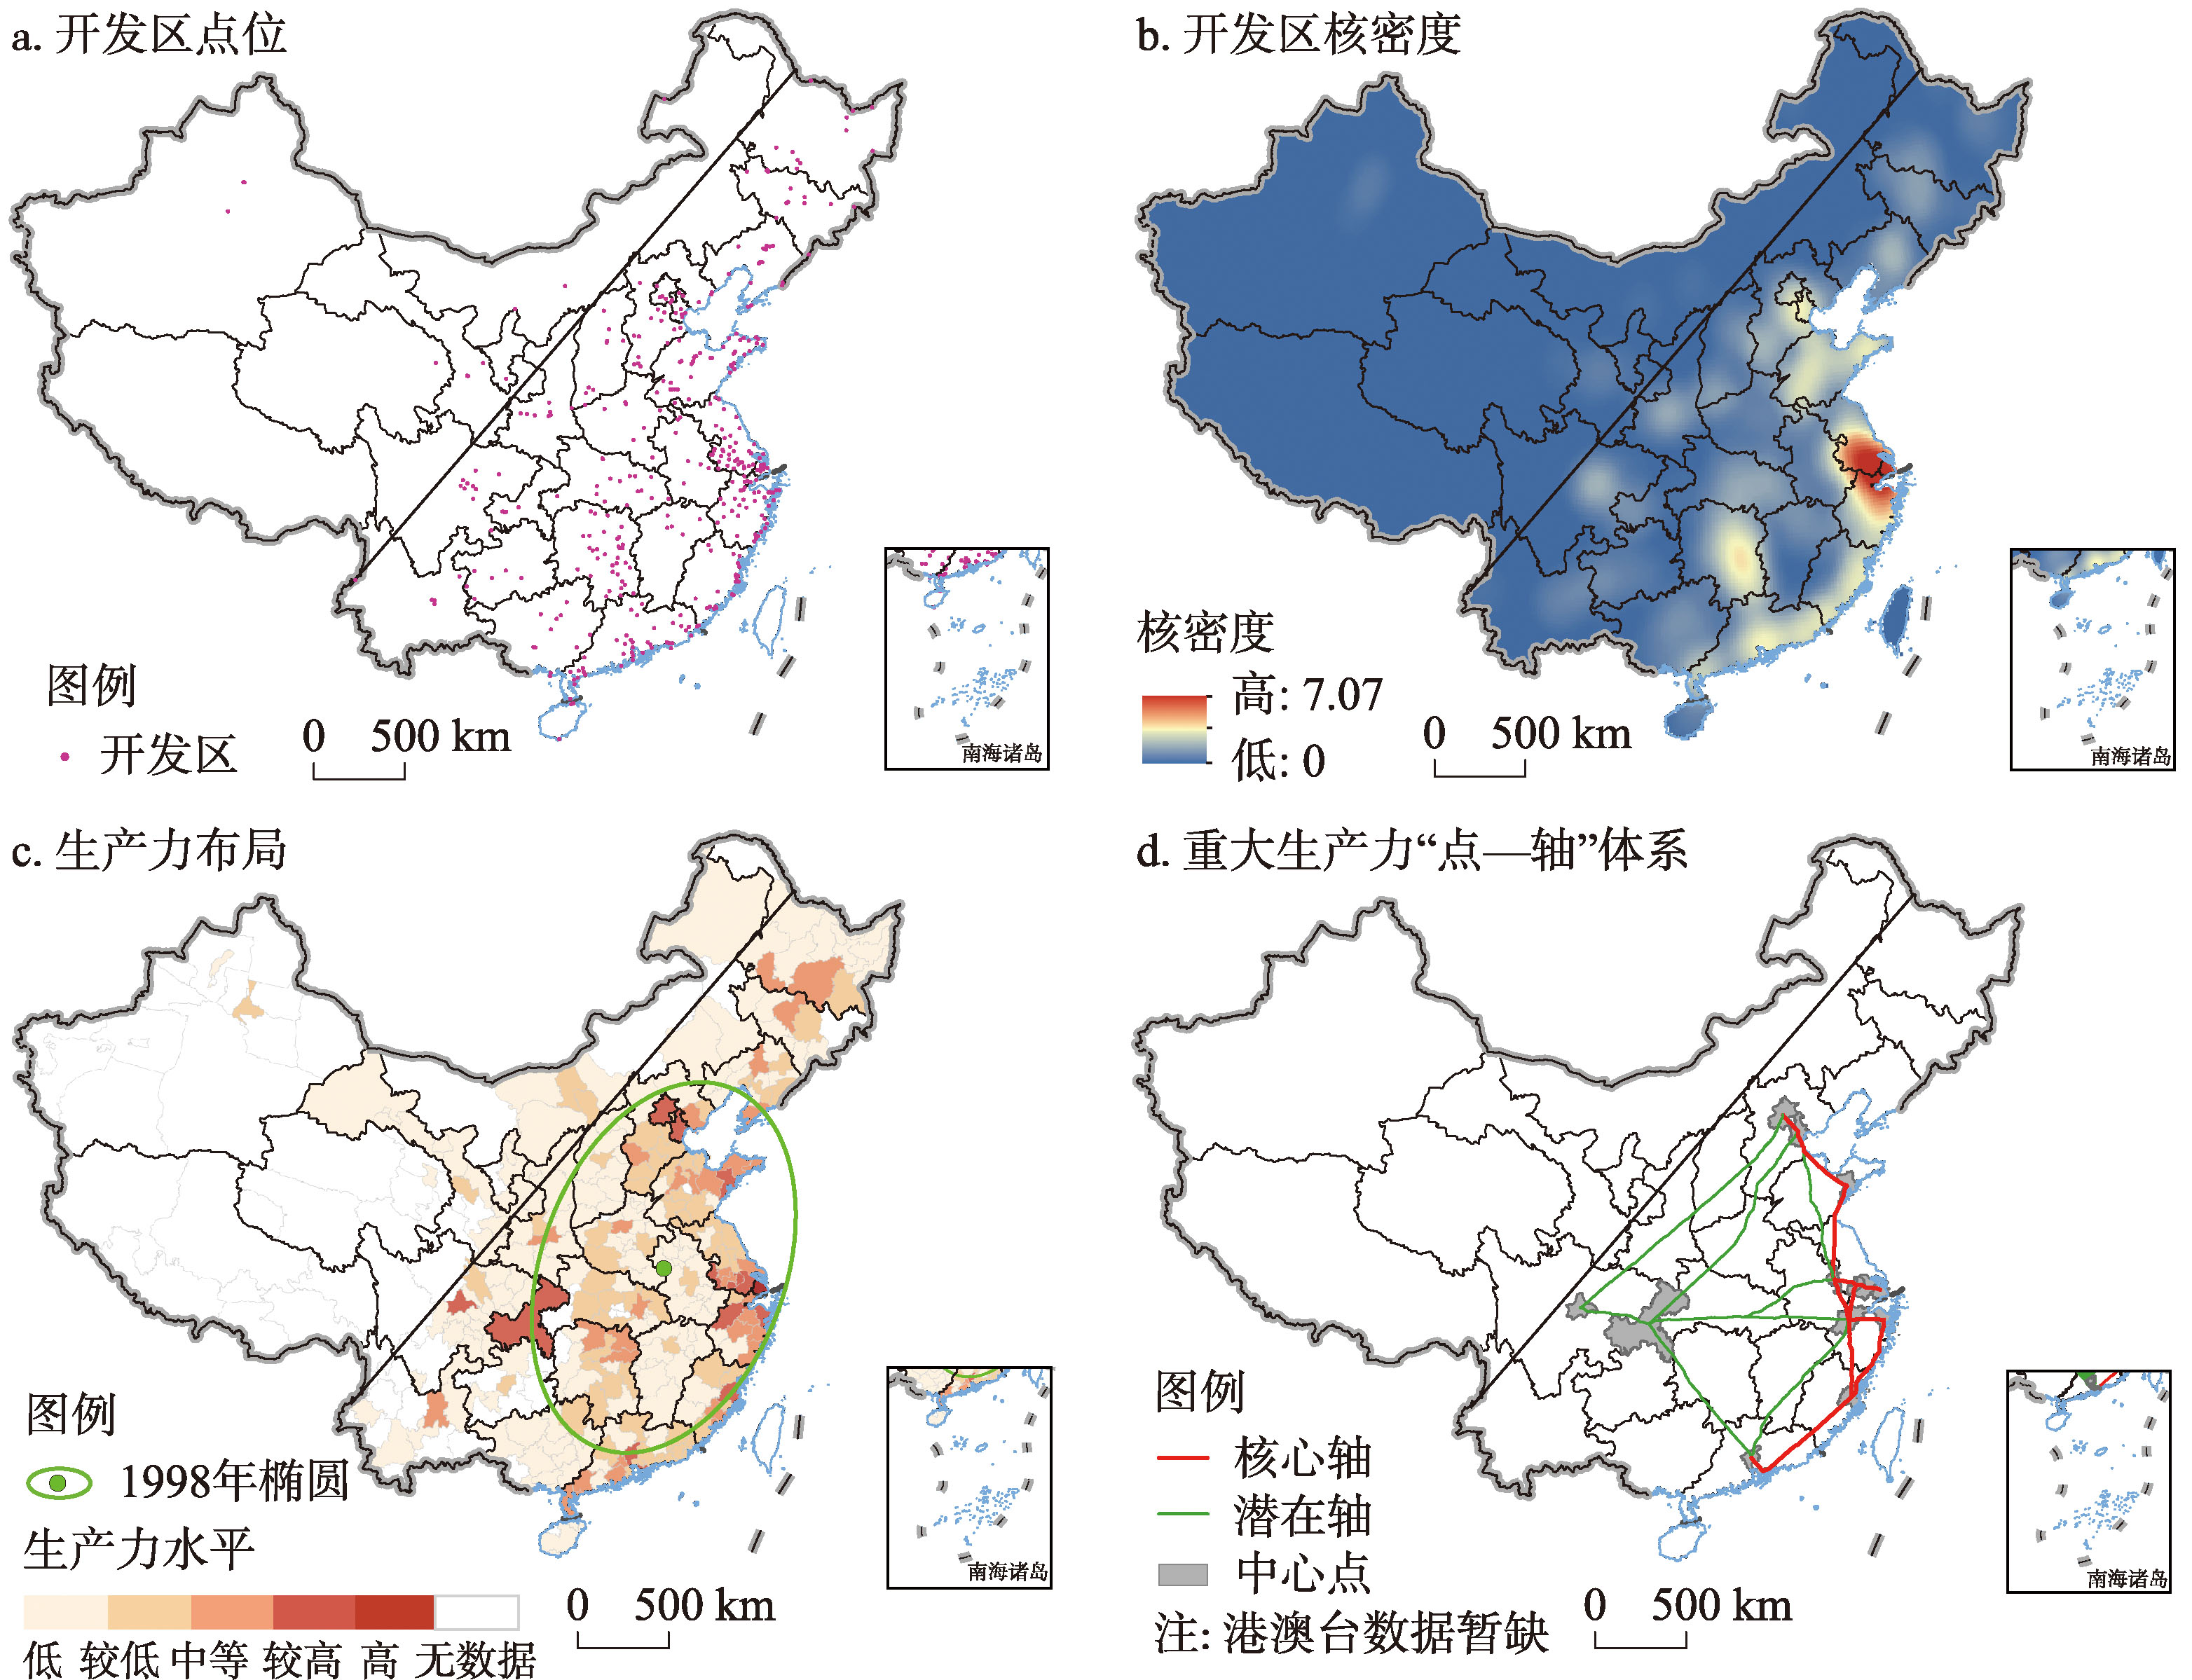
Fig. 4
China's major productive forces layout and its pole-axis space form simulation in 1998
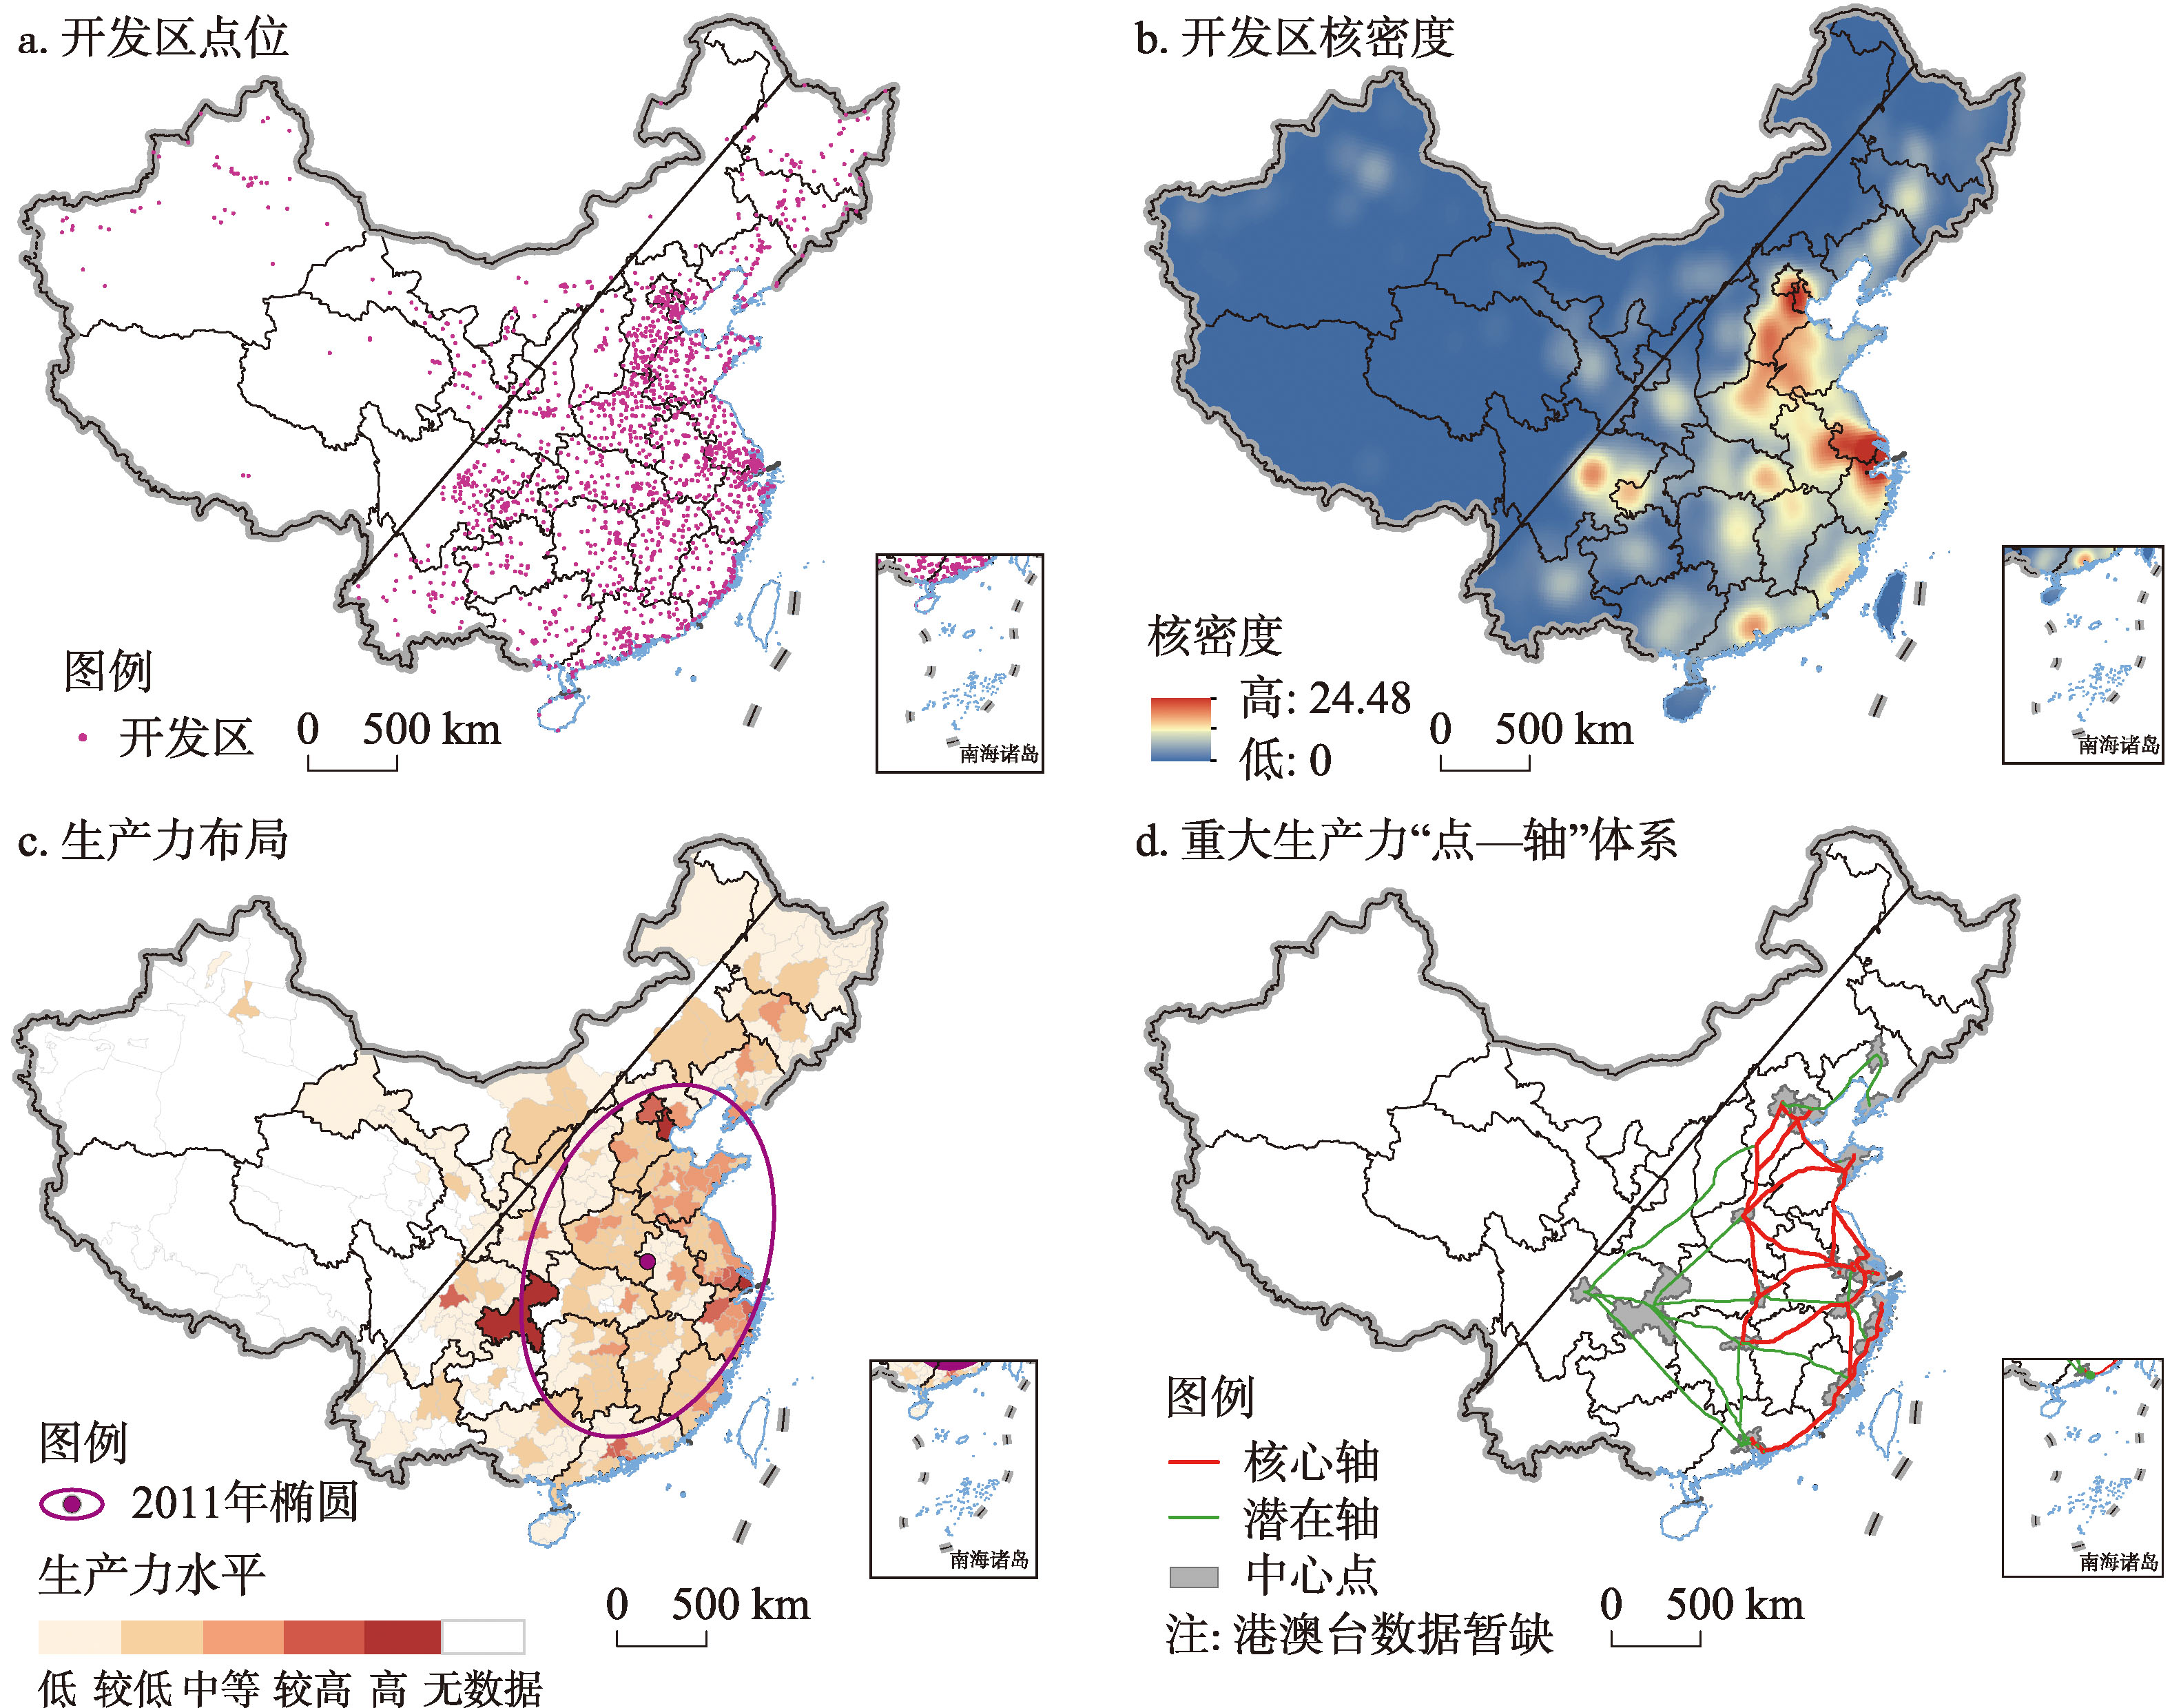
Fig. 5
China's major productive forces layout and its pole-axis space form simulation in 2011
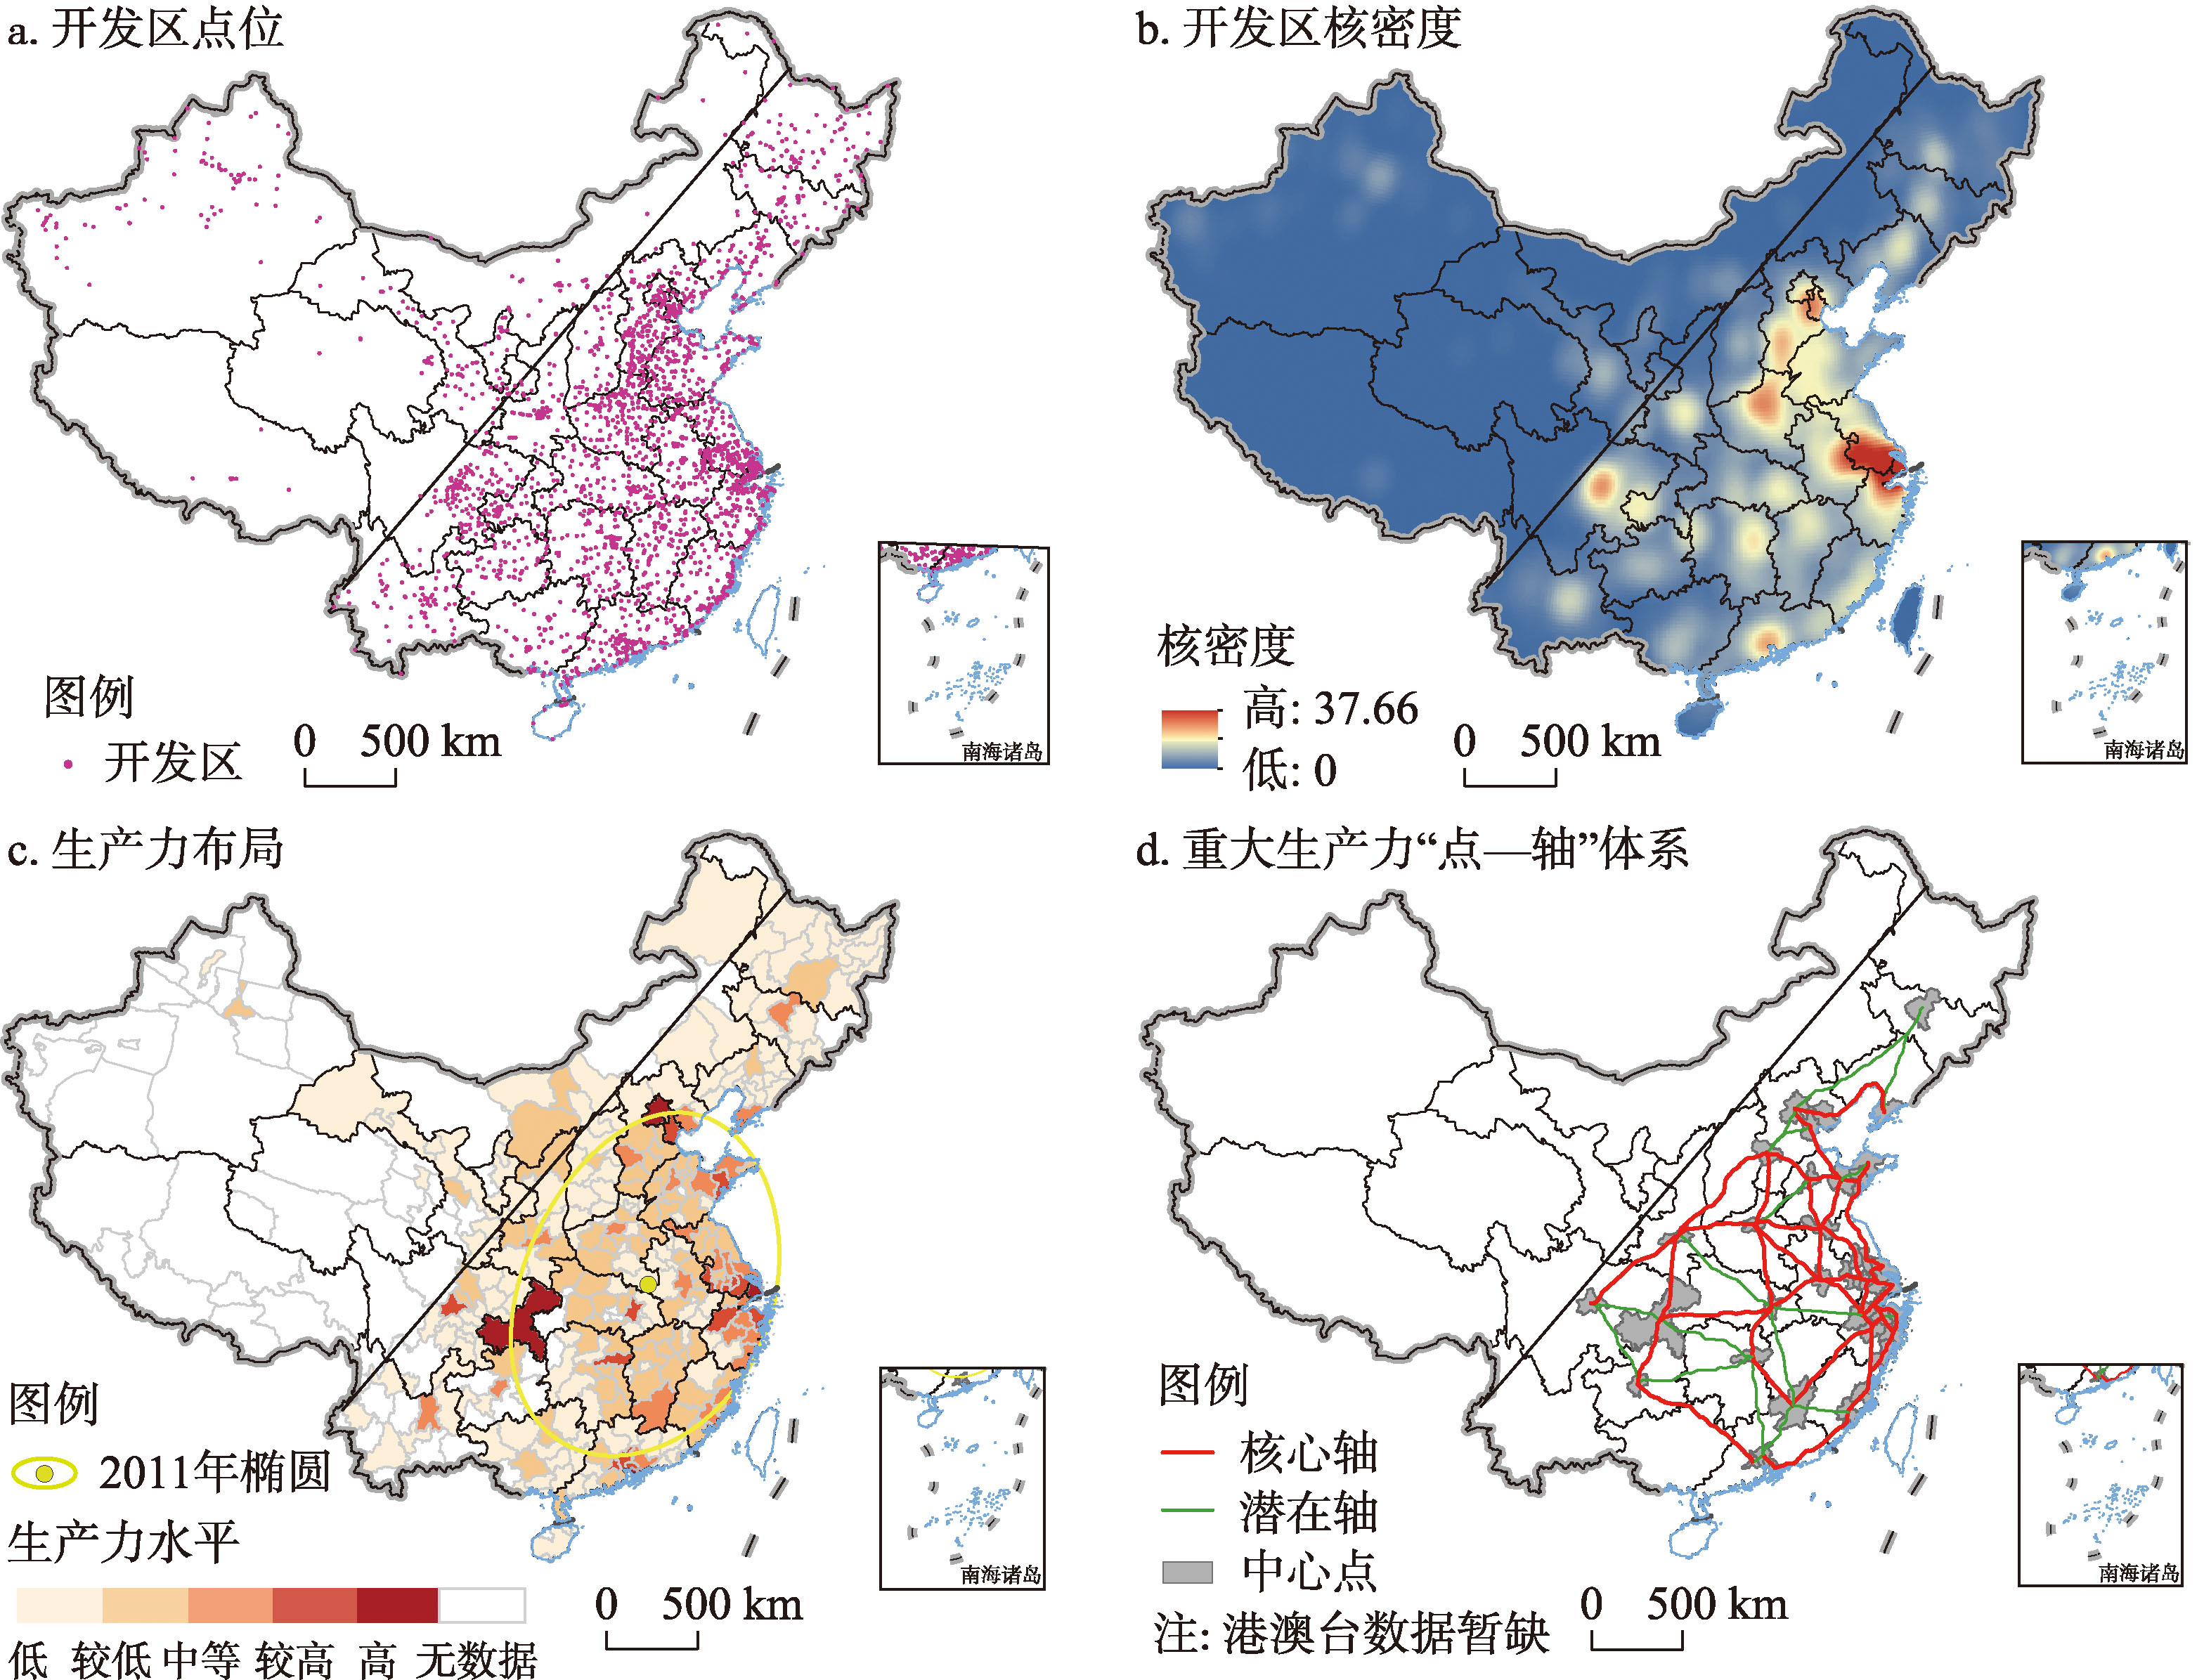
Fig. 6
China's major productive forces layout and its pole-axis space form simulation in 2021
Tab. 4
Layout of major productive forces in China in different stages
Tab. 5
Parameter estimation and test results of GTWR model
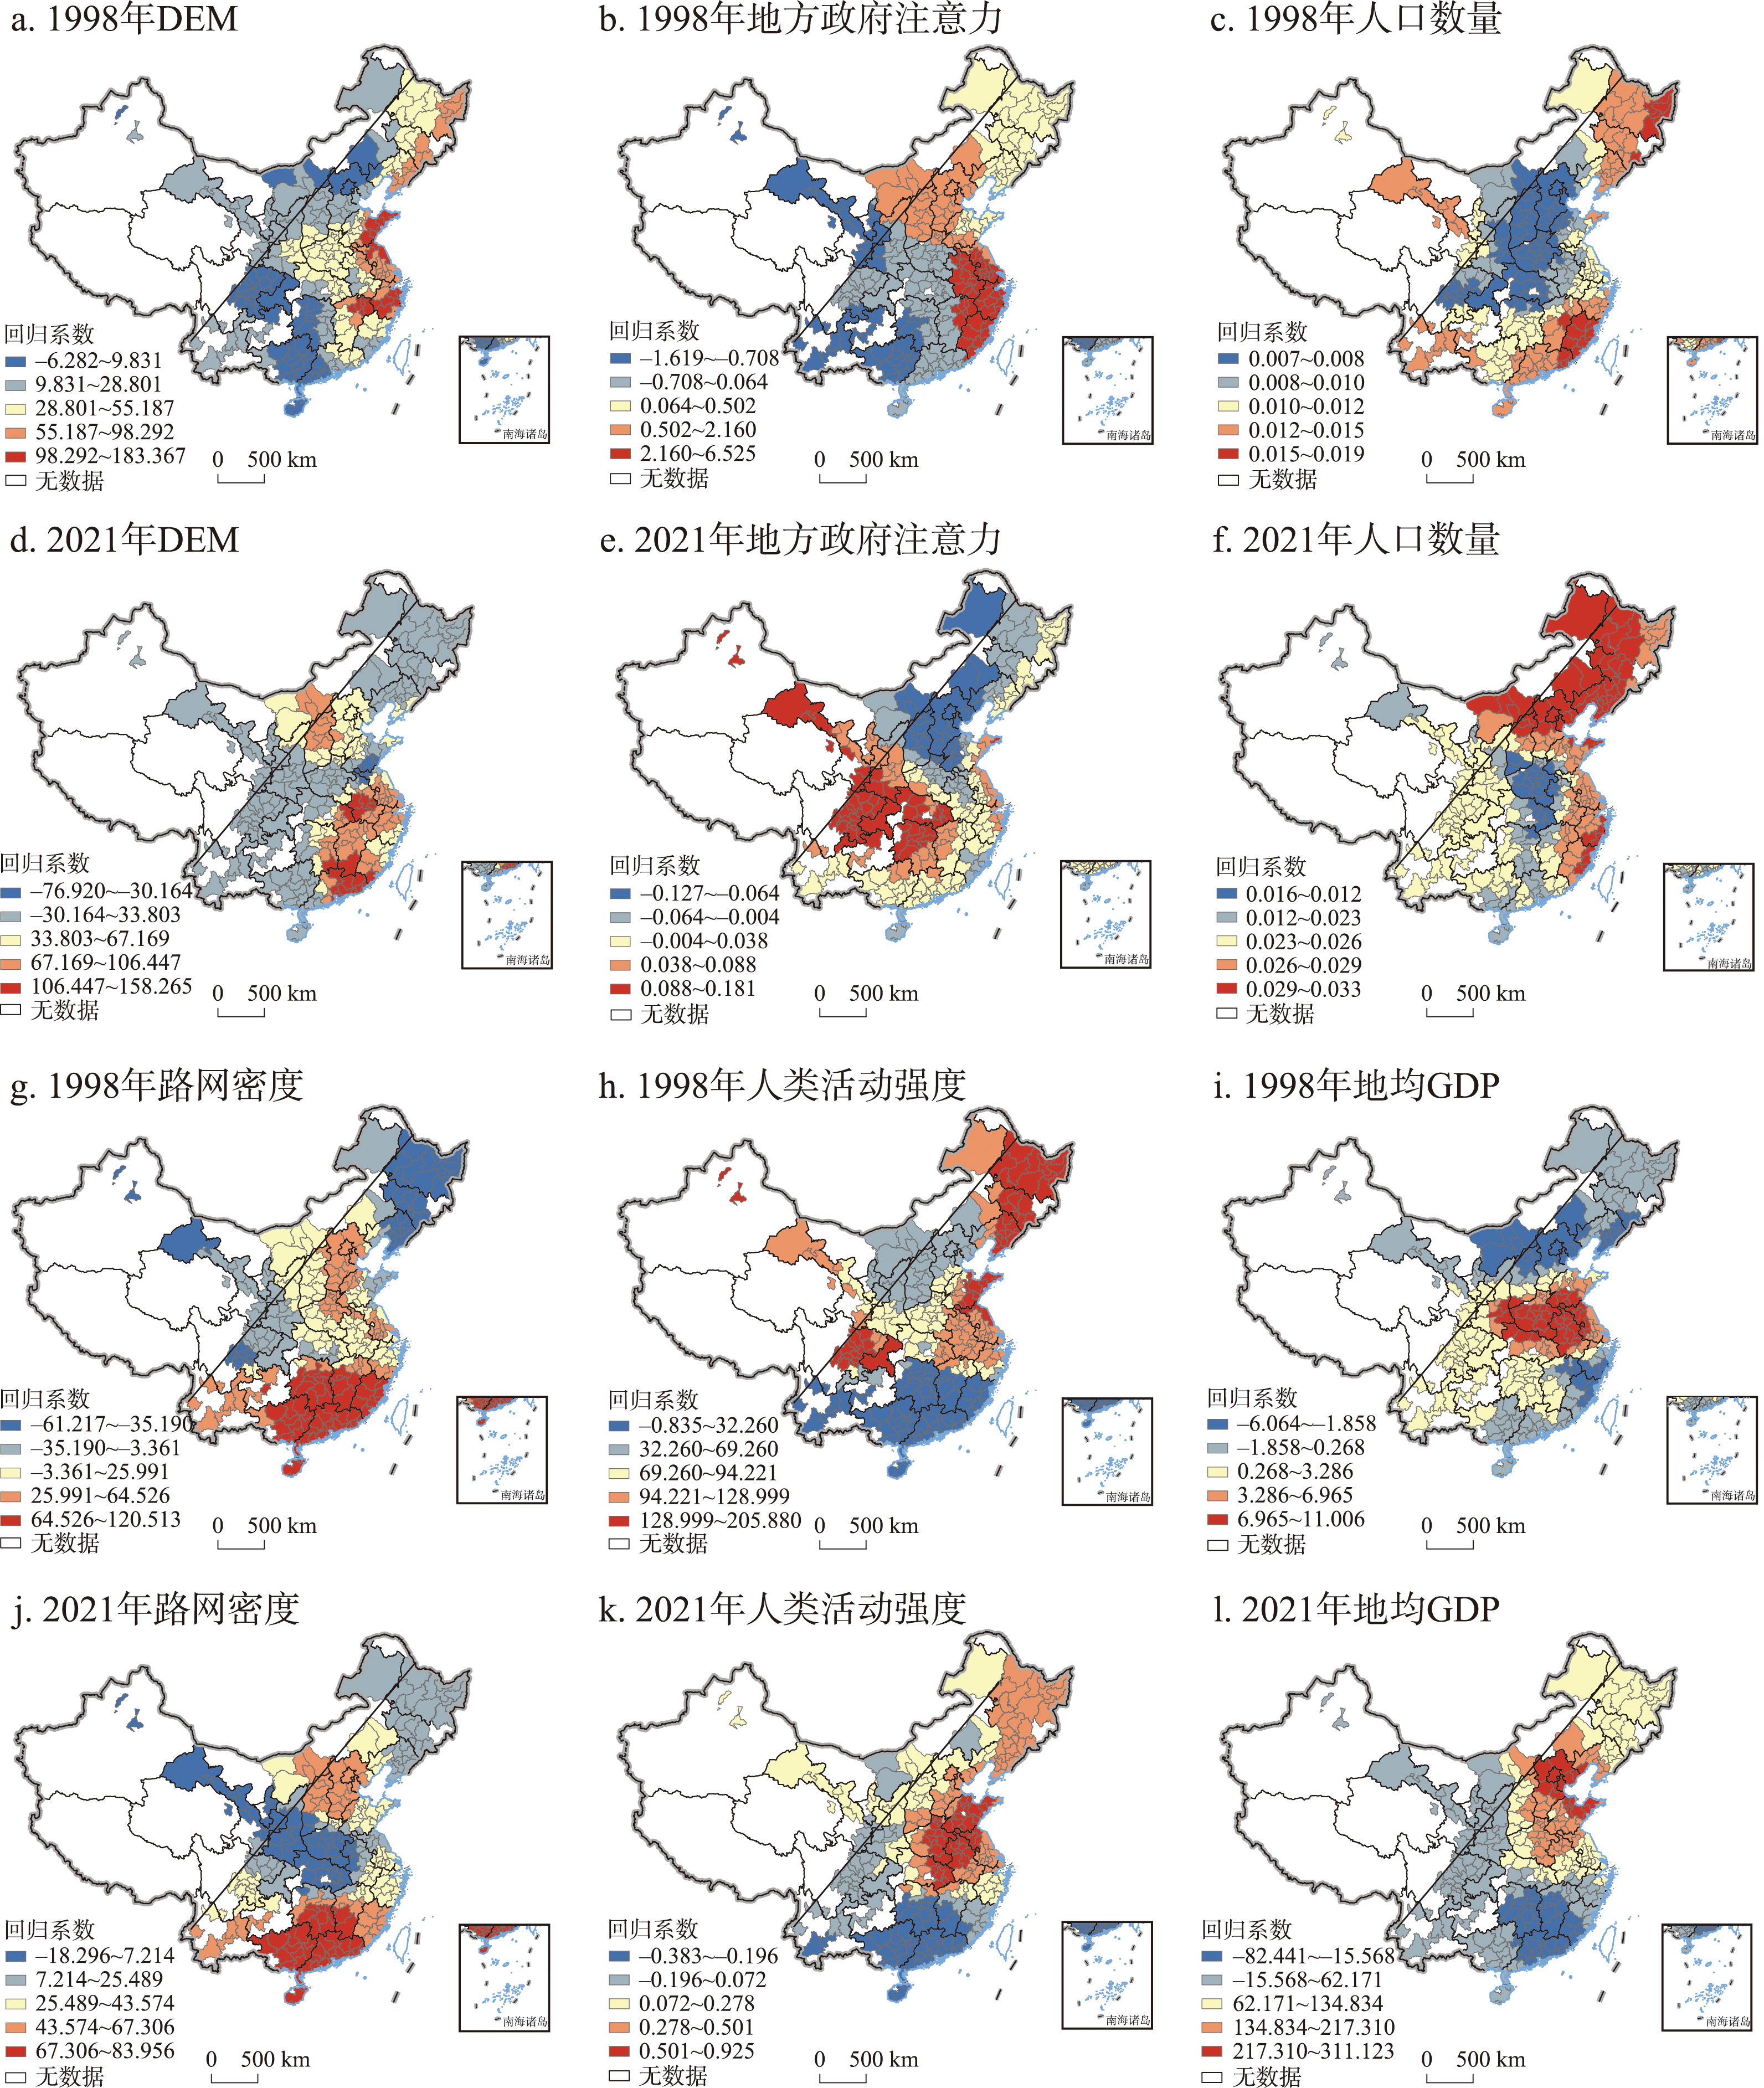
Fig. 7
Impact of related factors on productive forces layout in China in 1998 and 2021
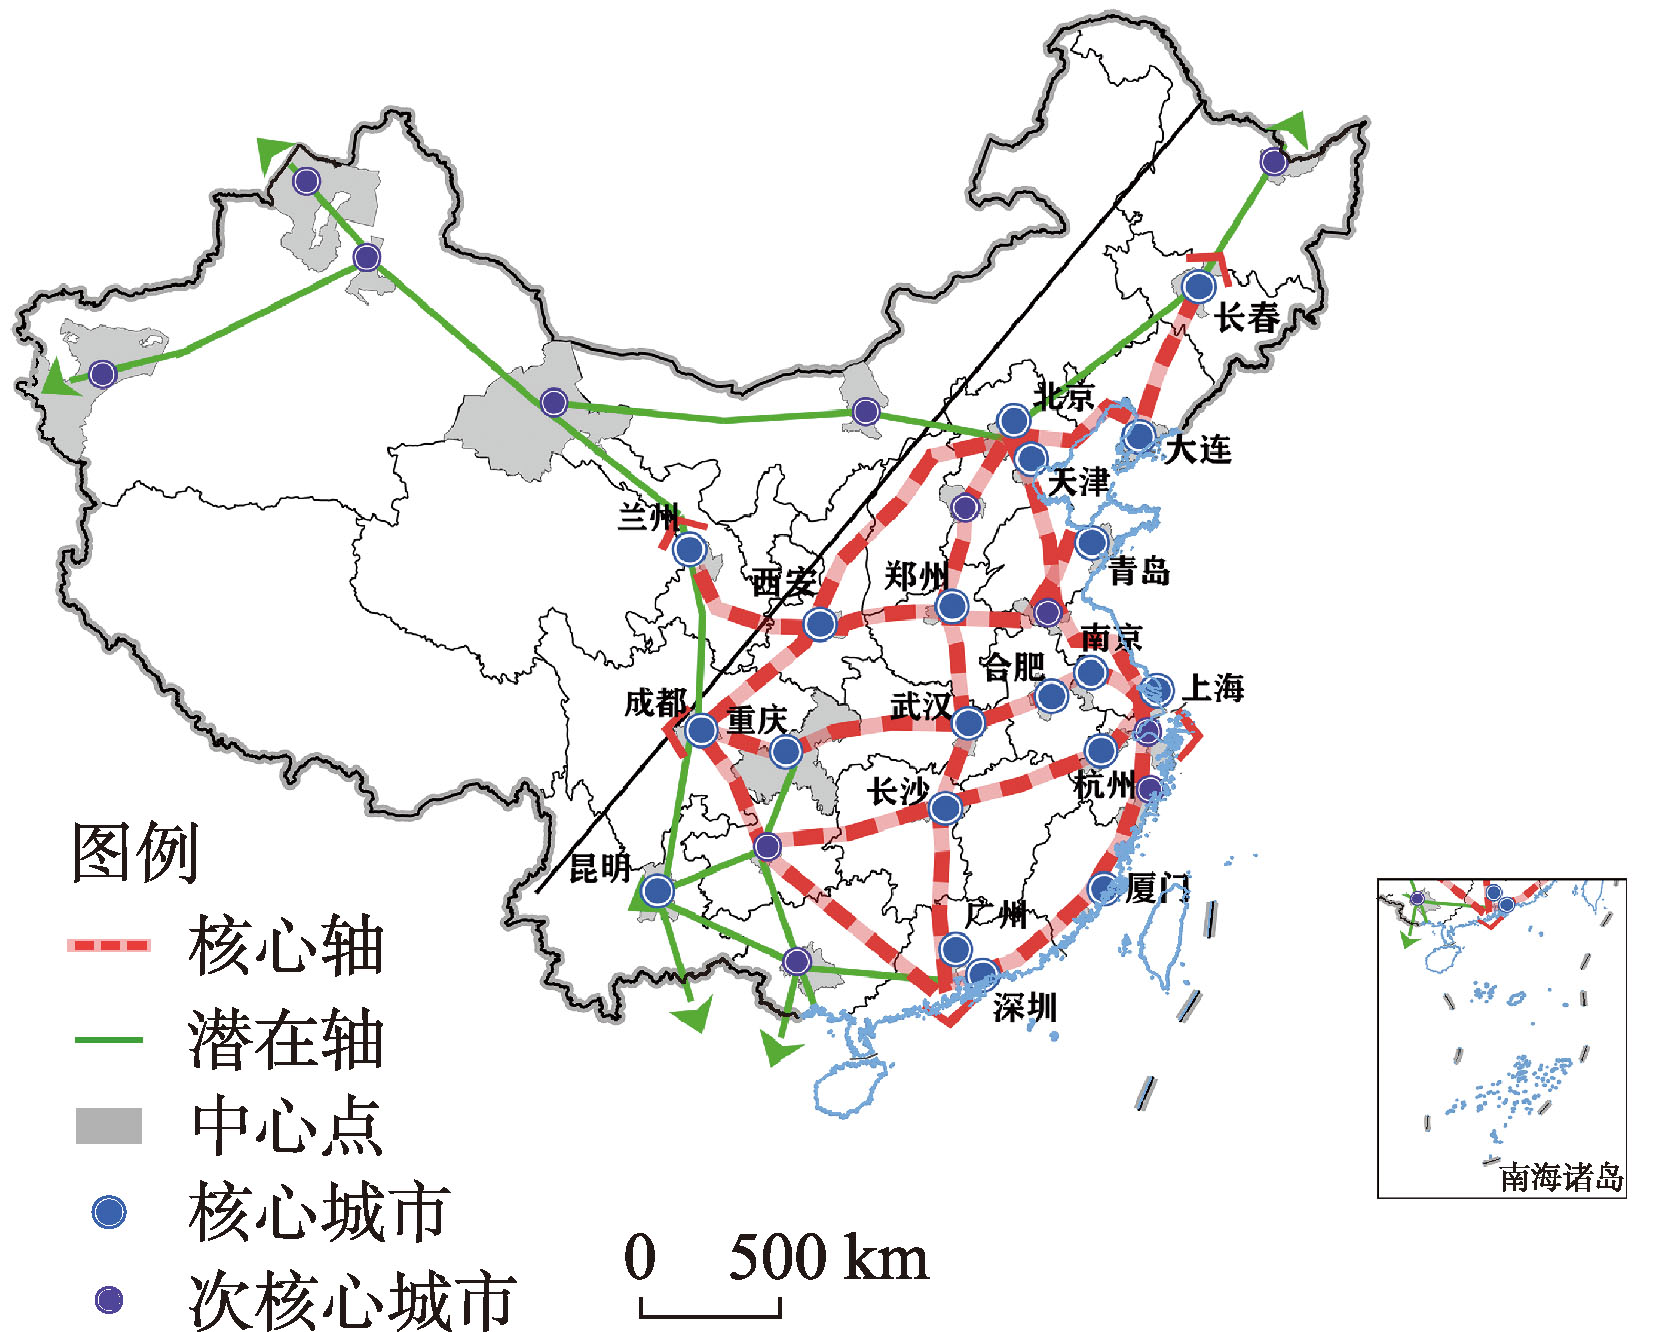
Fig. 8
China's blueprint for major productive forces layout