×
模态框(Modal)标题
在这里添加一些文本
Close
Close
Submit
Cancel
Confirm
×
模态框(Modal)标题
×
Journal
Article
Figure
Search
EN
中文
Home
About Journal
About Journal
Indexed in
Awards
Editorial Board
Guide for Authors
Browse
Current Issue
Online First
Archive
Highlights
Topic
Archive by Subject
Most Viewed
Most Download
Most Cited
E-mail Alert
RSS
Subscribe
Advertisement
Contact us
EN
中文
Figure/Table detail
Impact of urban core areas on county-level human capital in China
XU Haidong, HUANG Xuliang, NI Pengfei
Acta Geographica Sinica
, 2024, 79(
12
): 3177-3196. DOI:
10.11821/dlxb202412016
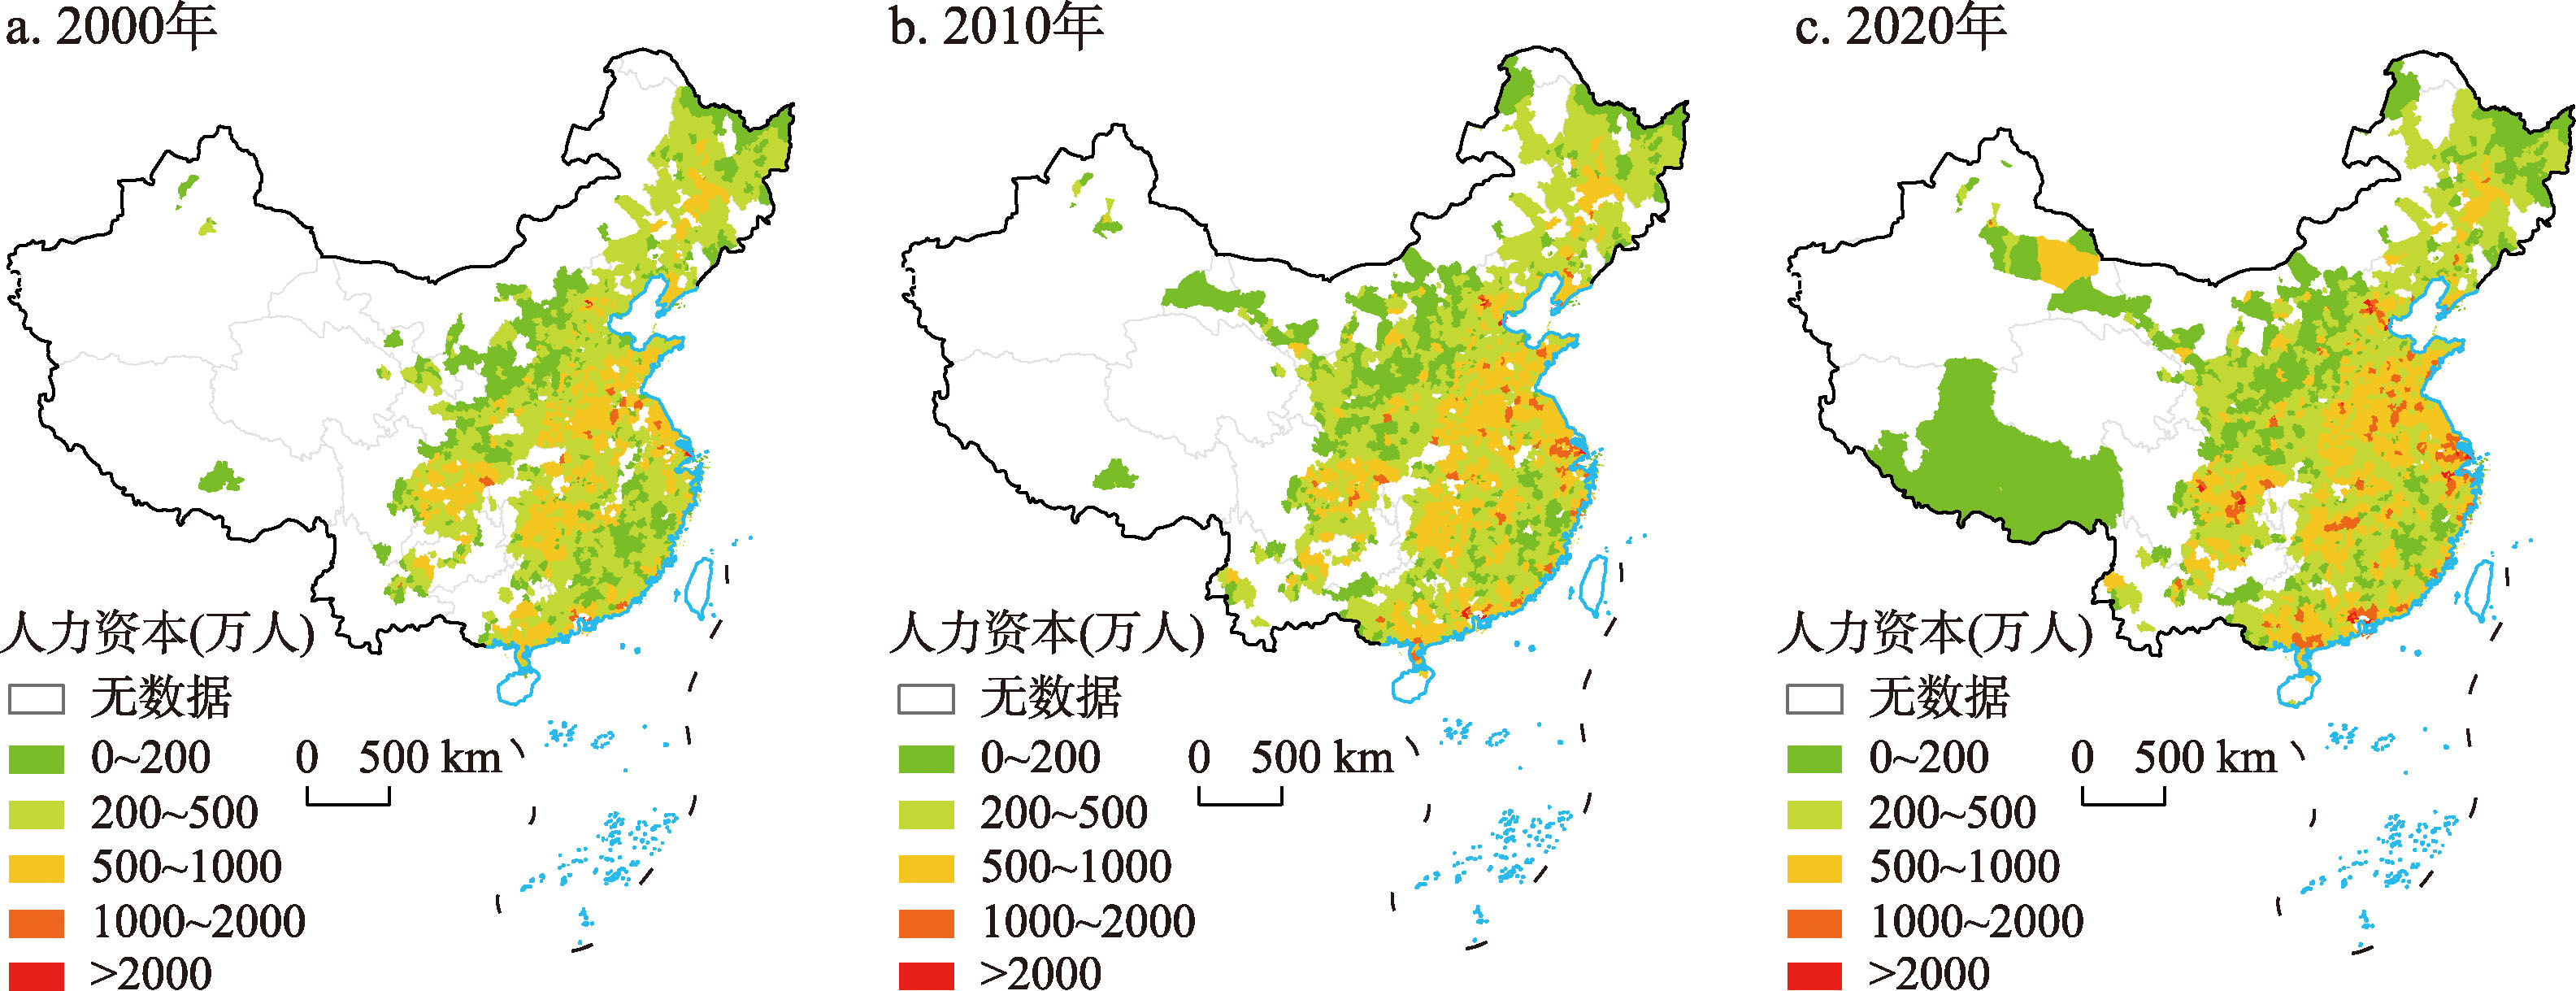
Fig. 2
Spatial distribution of total human capital in China in 2000, 2010 and 2020
Other figure/table from this article
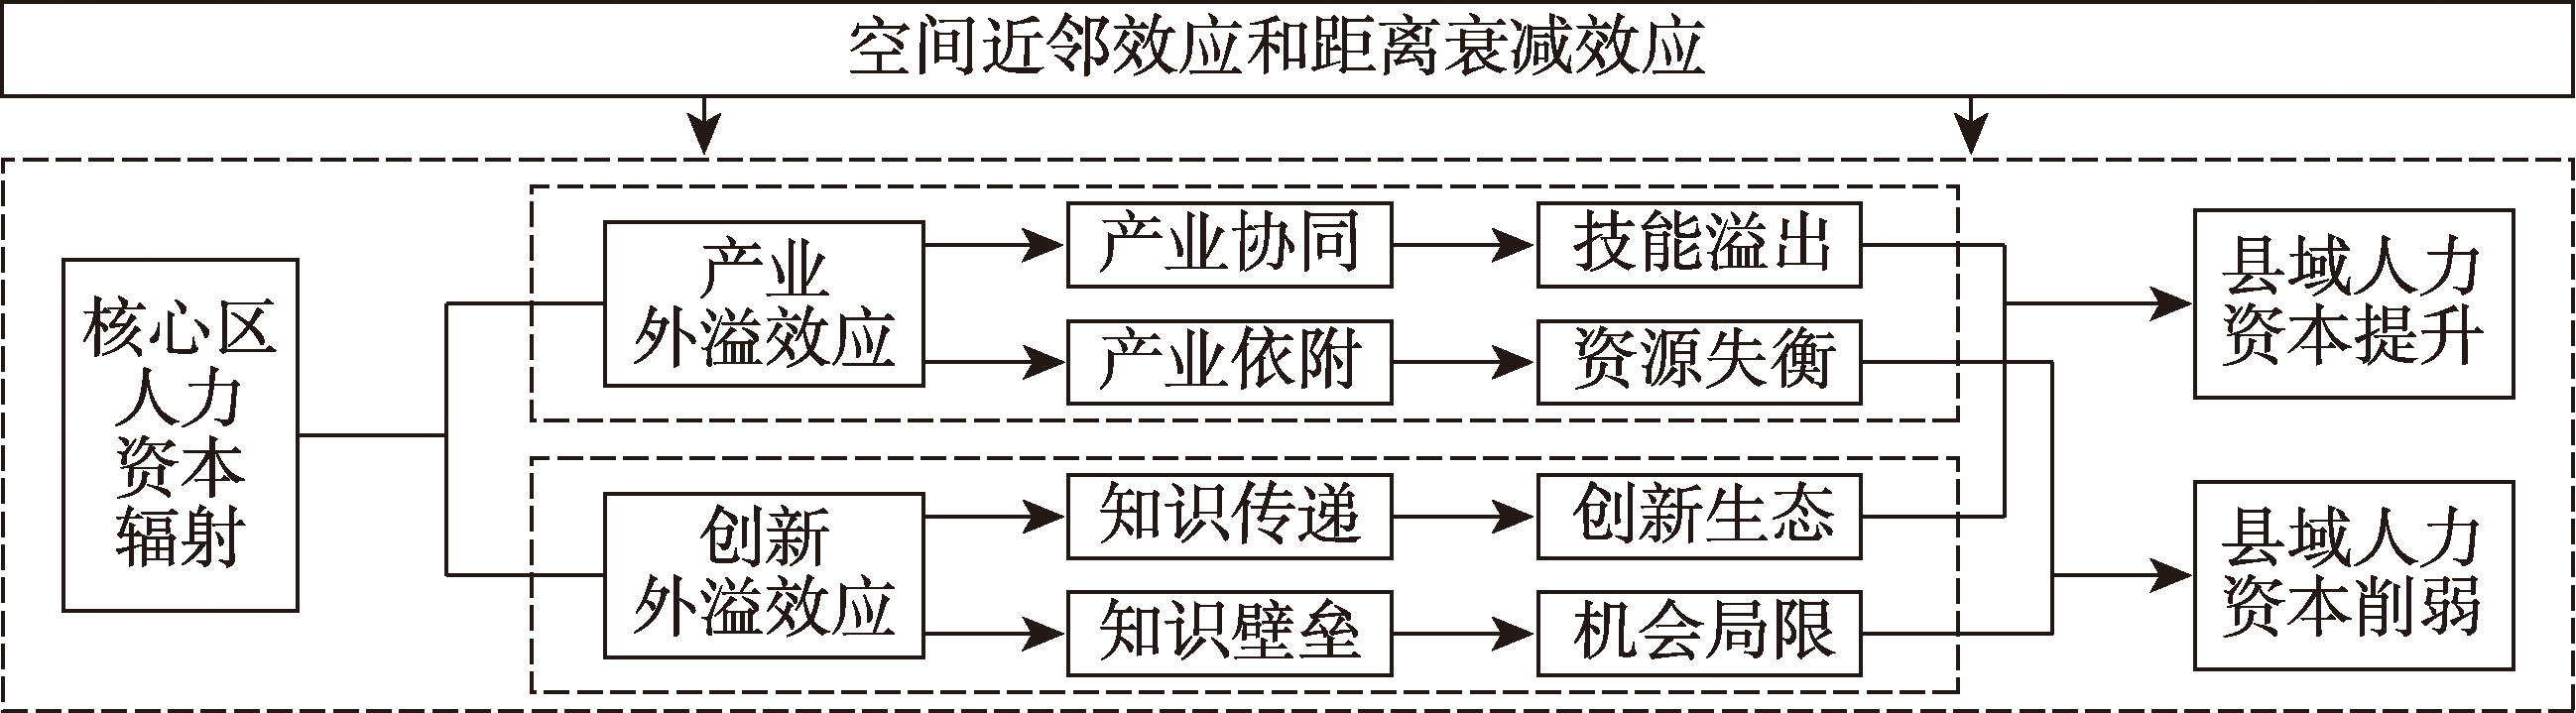
Fig. 1
Research framework on the spillover effect of human capital in core areas
Tab. 1
Total human capital in each regional core area and county, in 2000, 2010 and 2020 (10,000 person)
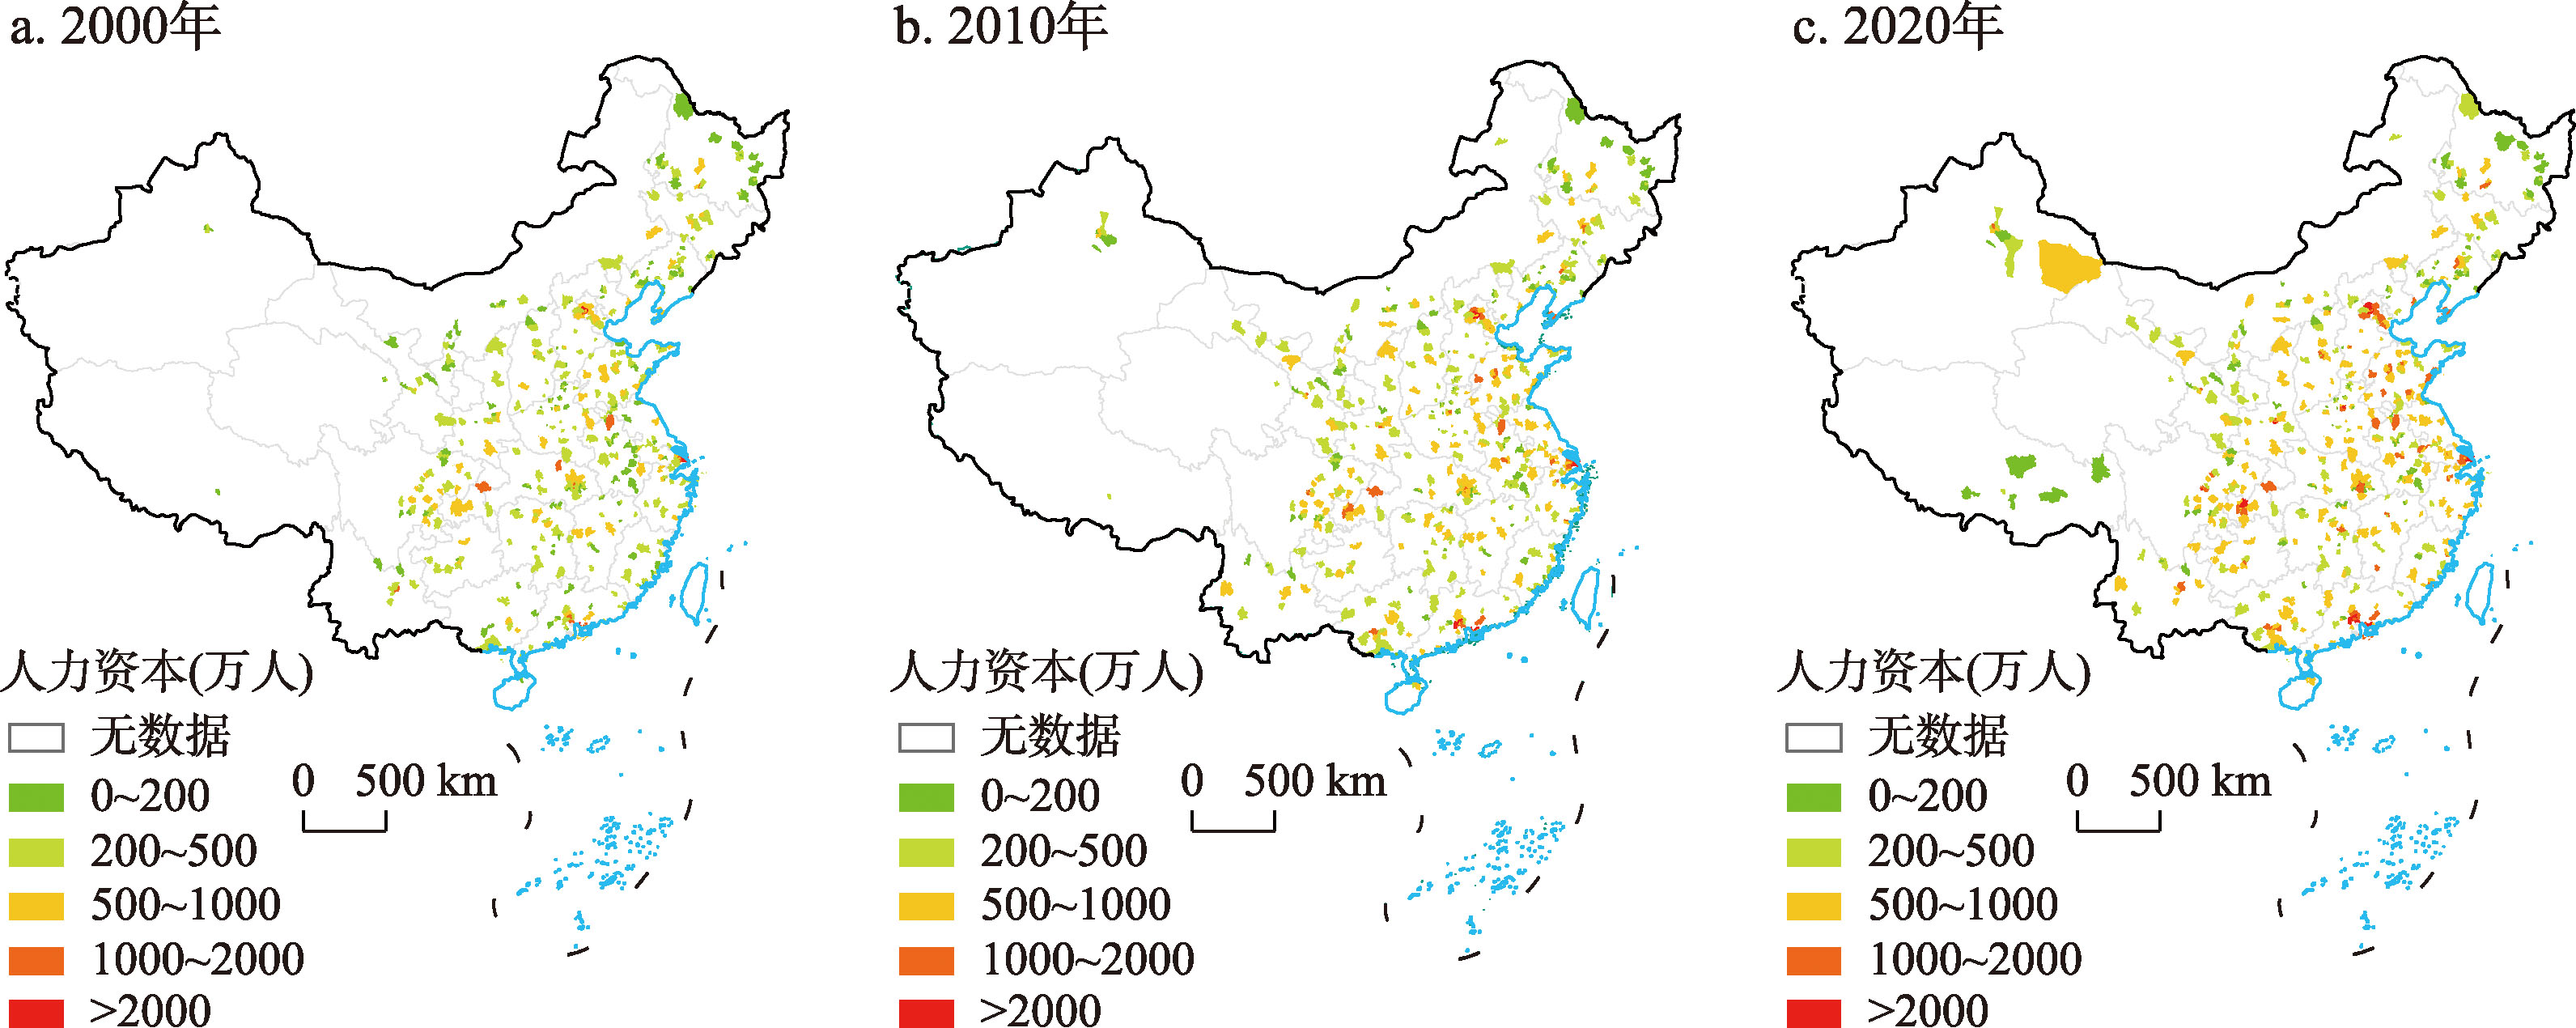
Fig. 3
Spatial distribution of total human capital in core areas in China in 2000, 2010 and 2020
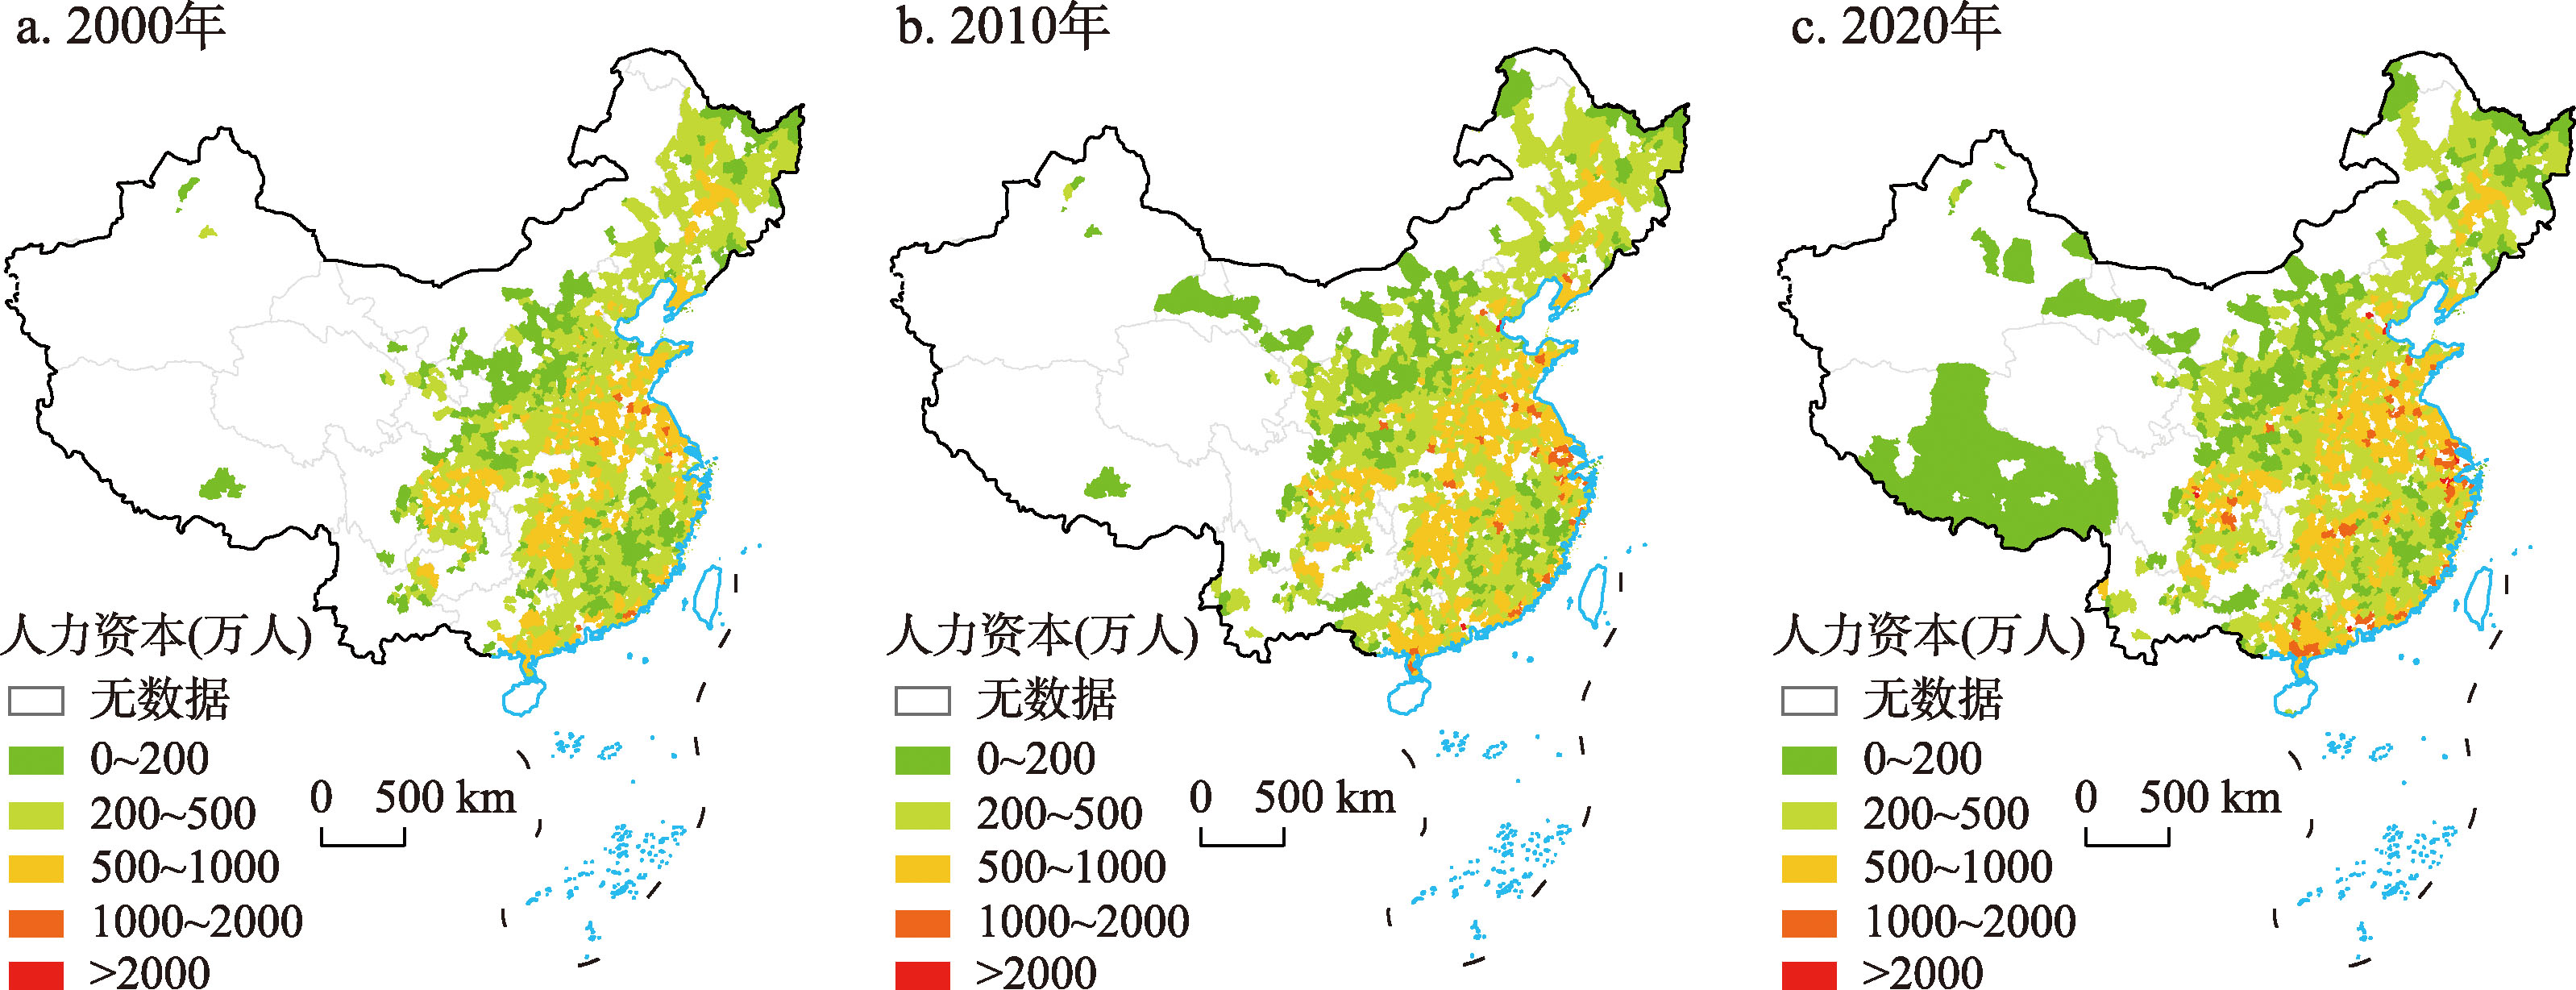
Fig. 4
Spatial distribution of total human capital in China by county in 2000, 2010 and 2020
Tab. 2
Basic regression results of the impact of core area human capital on county-level human capital
Tab. 3
Robust regression results of the impact of core area human capital on county-level human capital
Tab. 4
Probability of core variable significance across sample sizes and significance conditions (%)
Tab. 5
Results of heterogeneity test on the impact of core area human capital on county-level human capital
Tab. 6
Endogeneity test results of the impact of core area human capital on county-level human capital
Tab. 7
Mechanism verification of the impact of core area human capital on county-level human capital
Tab. 8
Variance decomposition: Promotion effect and inhibitory effect of core area on county-level human capital
Tab. 9
Temporal characteristics of the influence of core area human capital on county-level human capital (%)
Fig. 5
Spatio-temporal distribution of the inhibitory effect of core area human capital on county-level human capital in China in 2000, 2010 and 2020
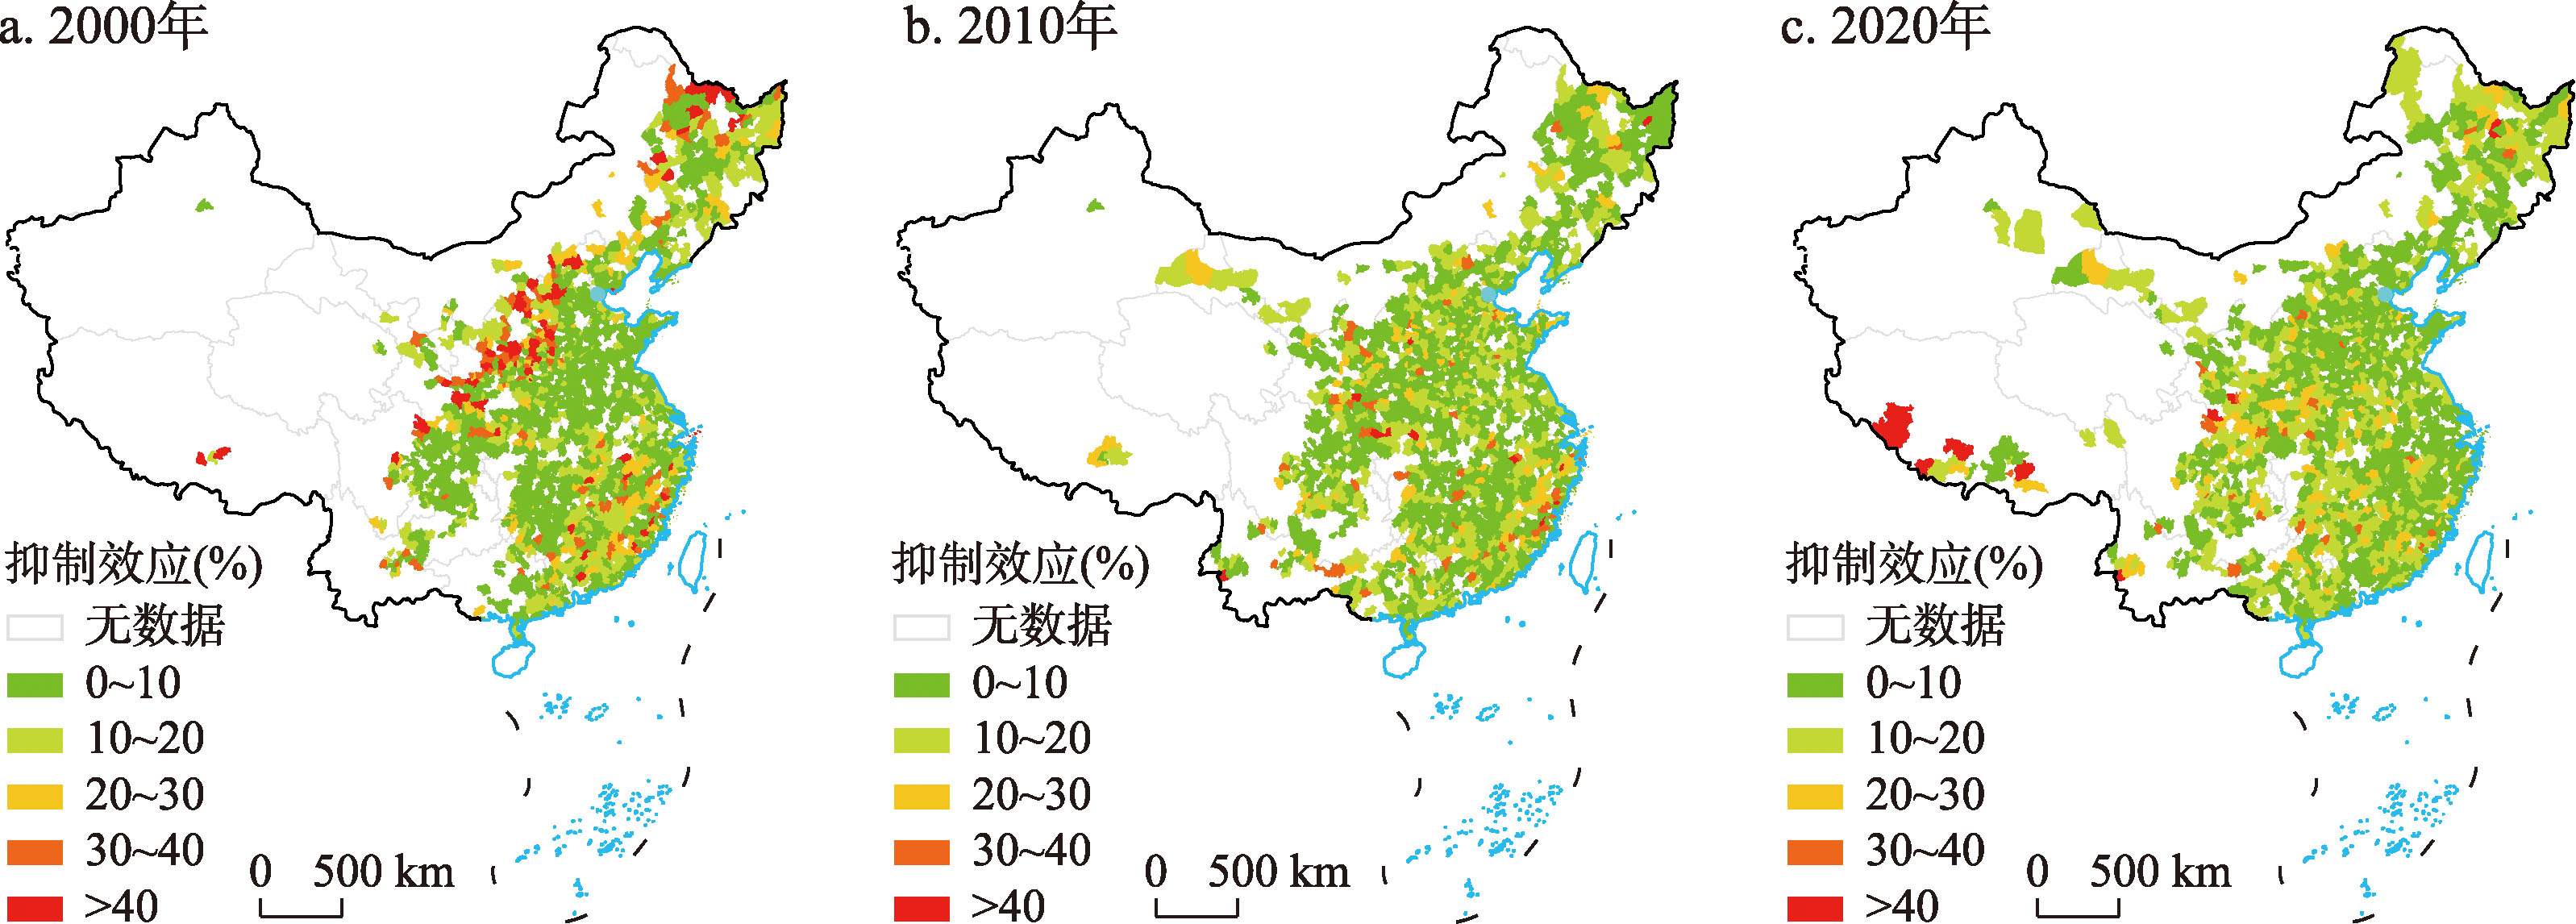
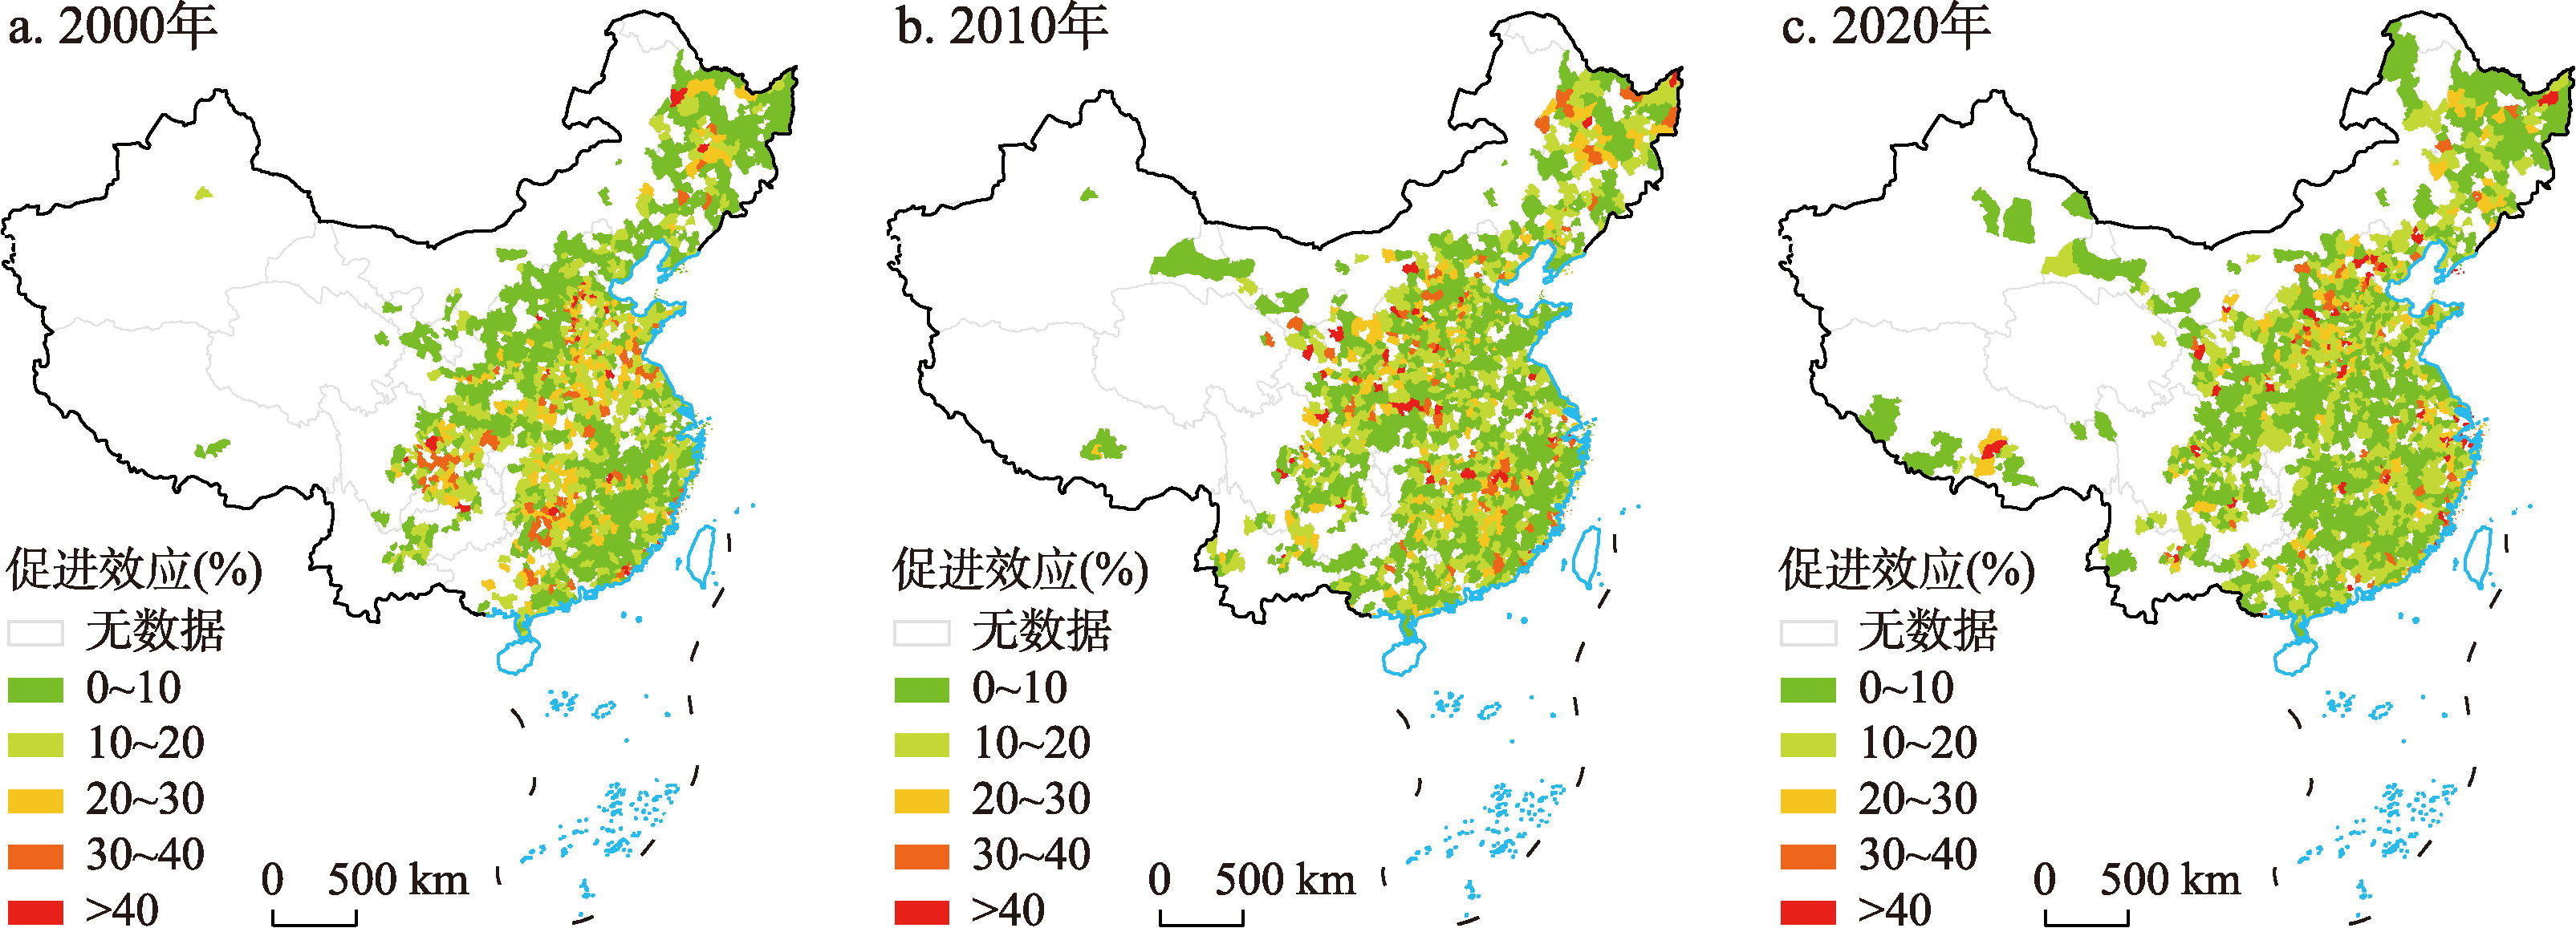
Fig. 6
Spatio-temporal distribution of the promotion effect of core area human capital on county-level human capital in China in 2000, 2010 and 2020
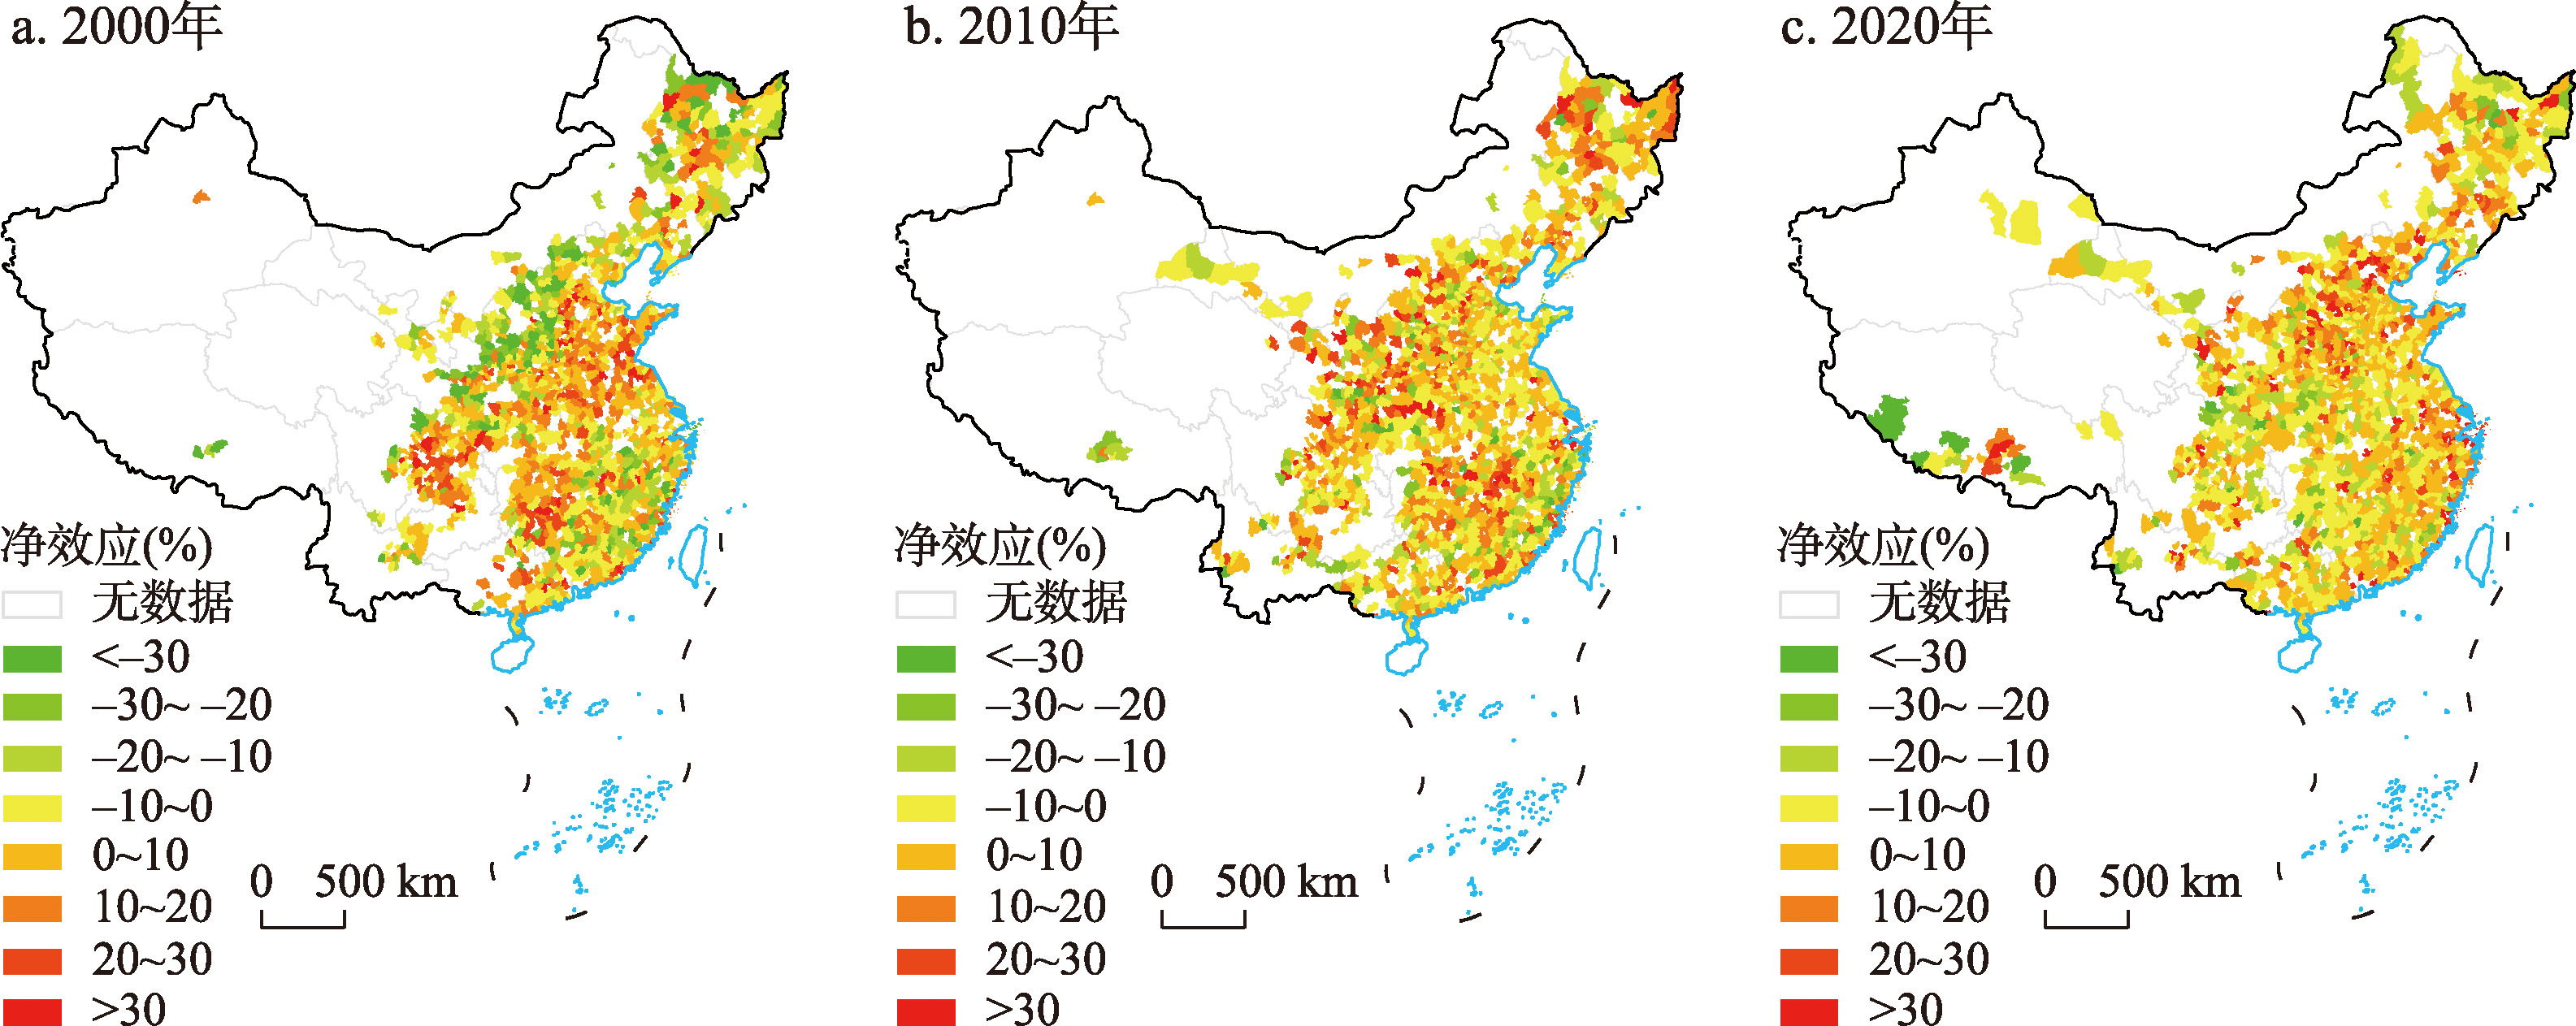
Fig. 7
Spatio-temporal distribution of the net effect of core area human capital on county-level human capital in China in 2000, 2010 and 2020
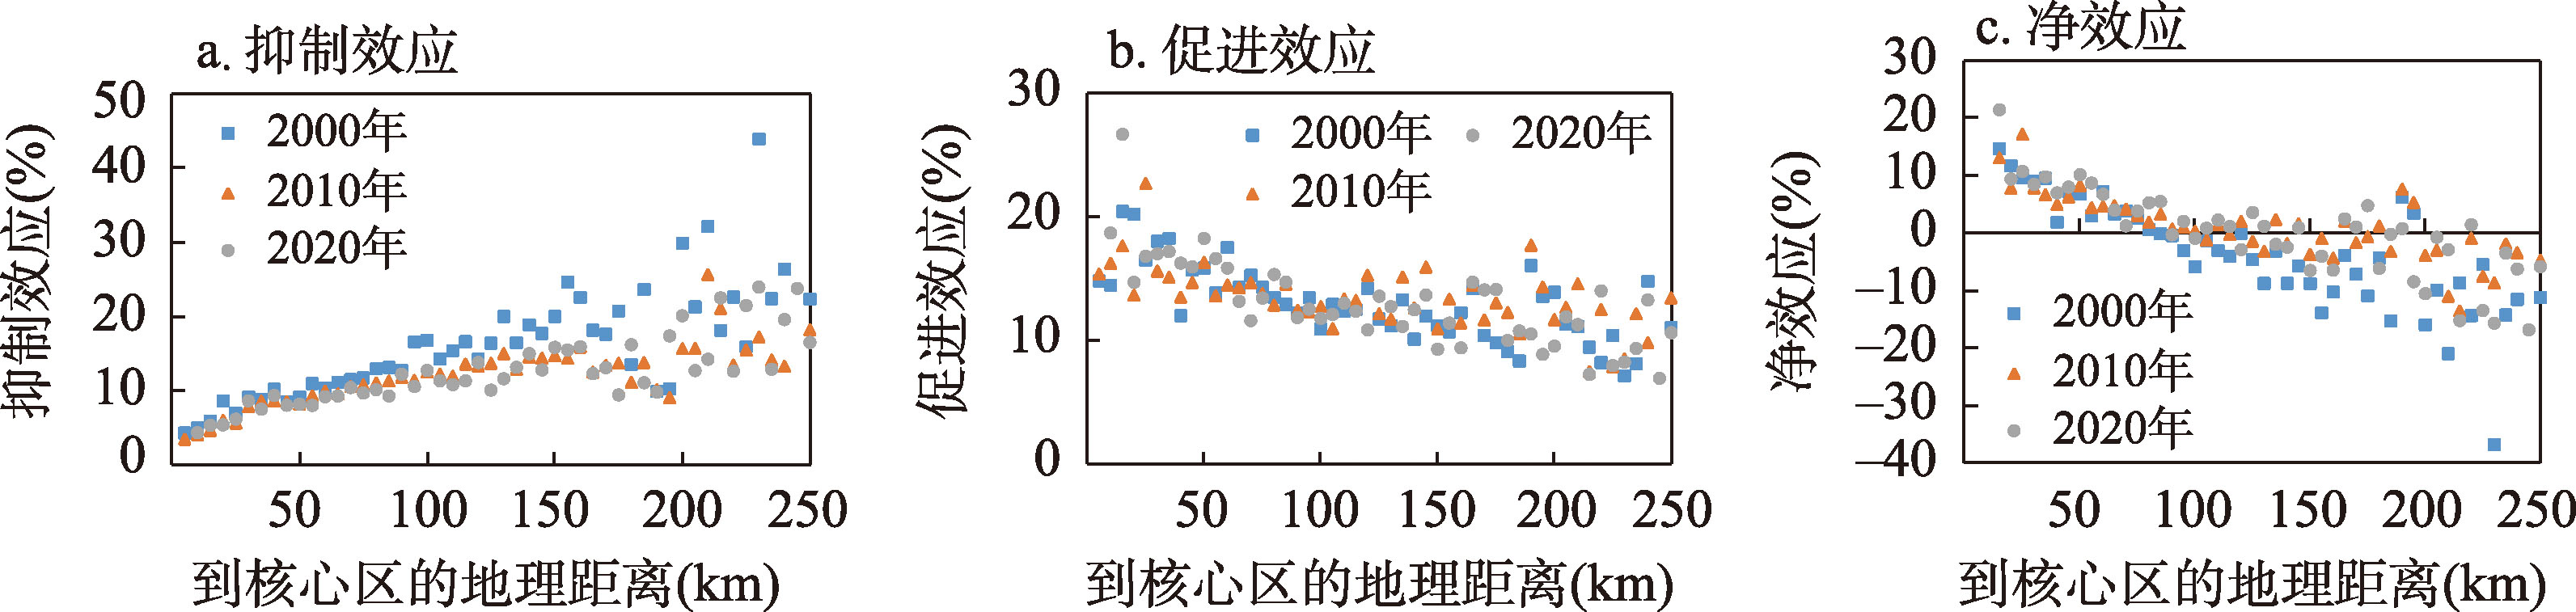
Fig. 8
Scatter plot of promotion effect, inhibitory effect, net effect and geographic distance
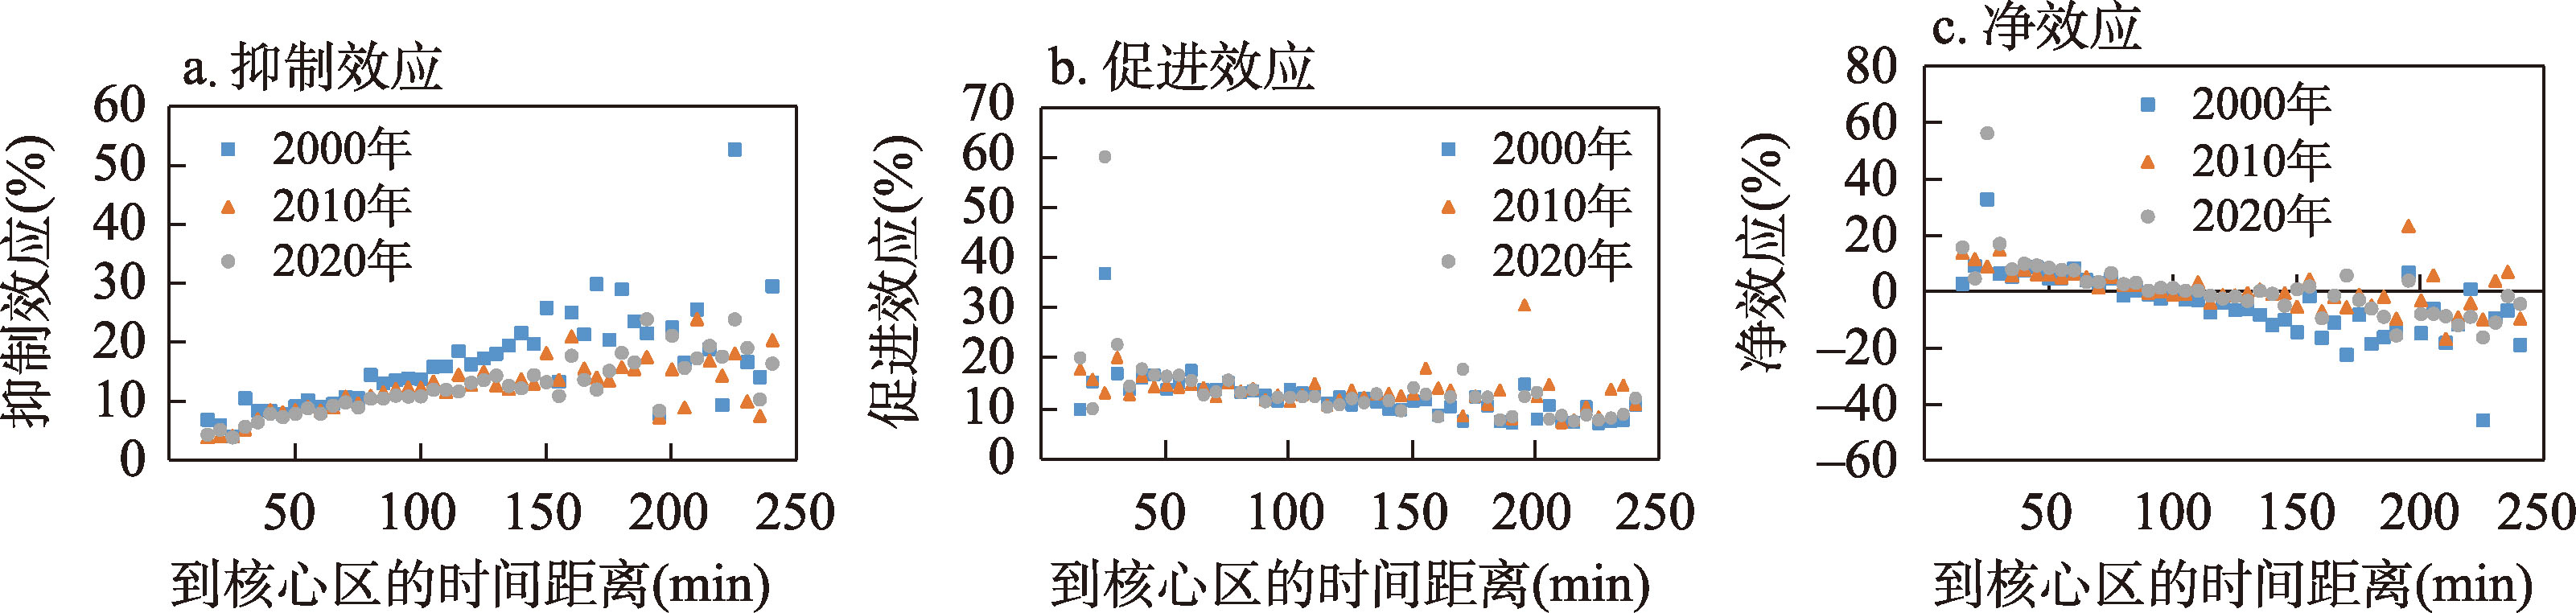
Fig. 9
Scatter plot of promotion effect, inhibitory effect, net effect and time distance
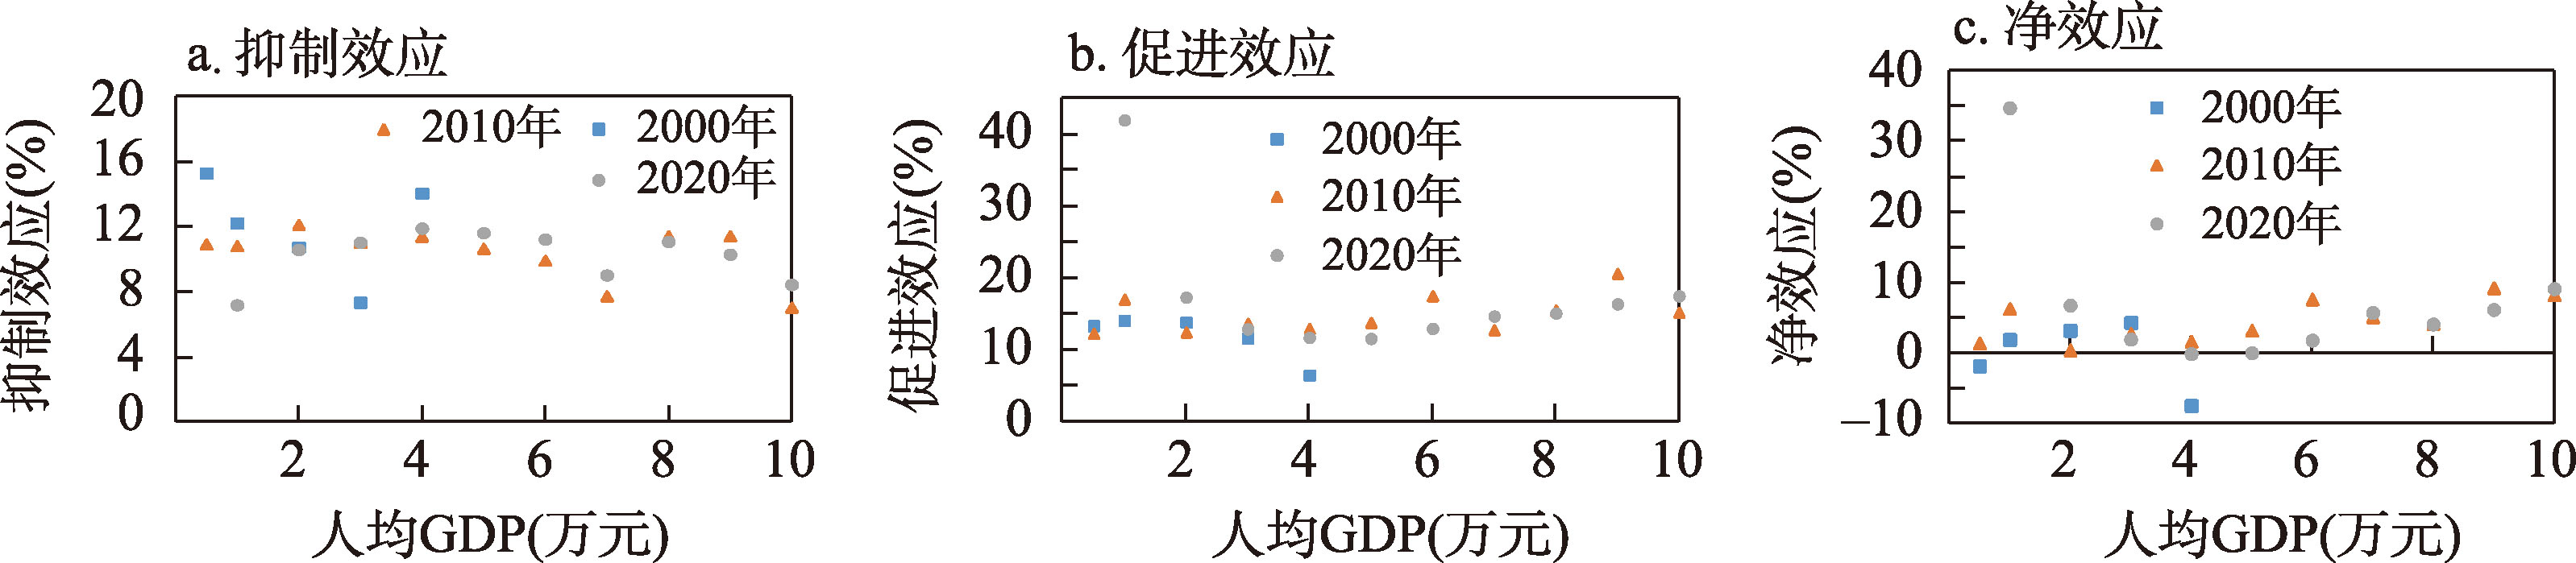
Fig. 10
Scatter plot of promotion effect, inhibitory effect, net effect and economic development level
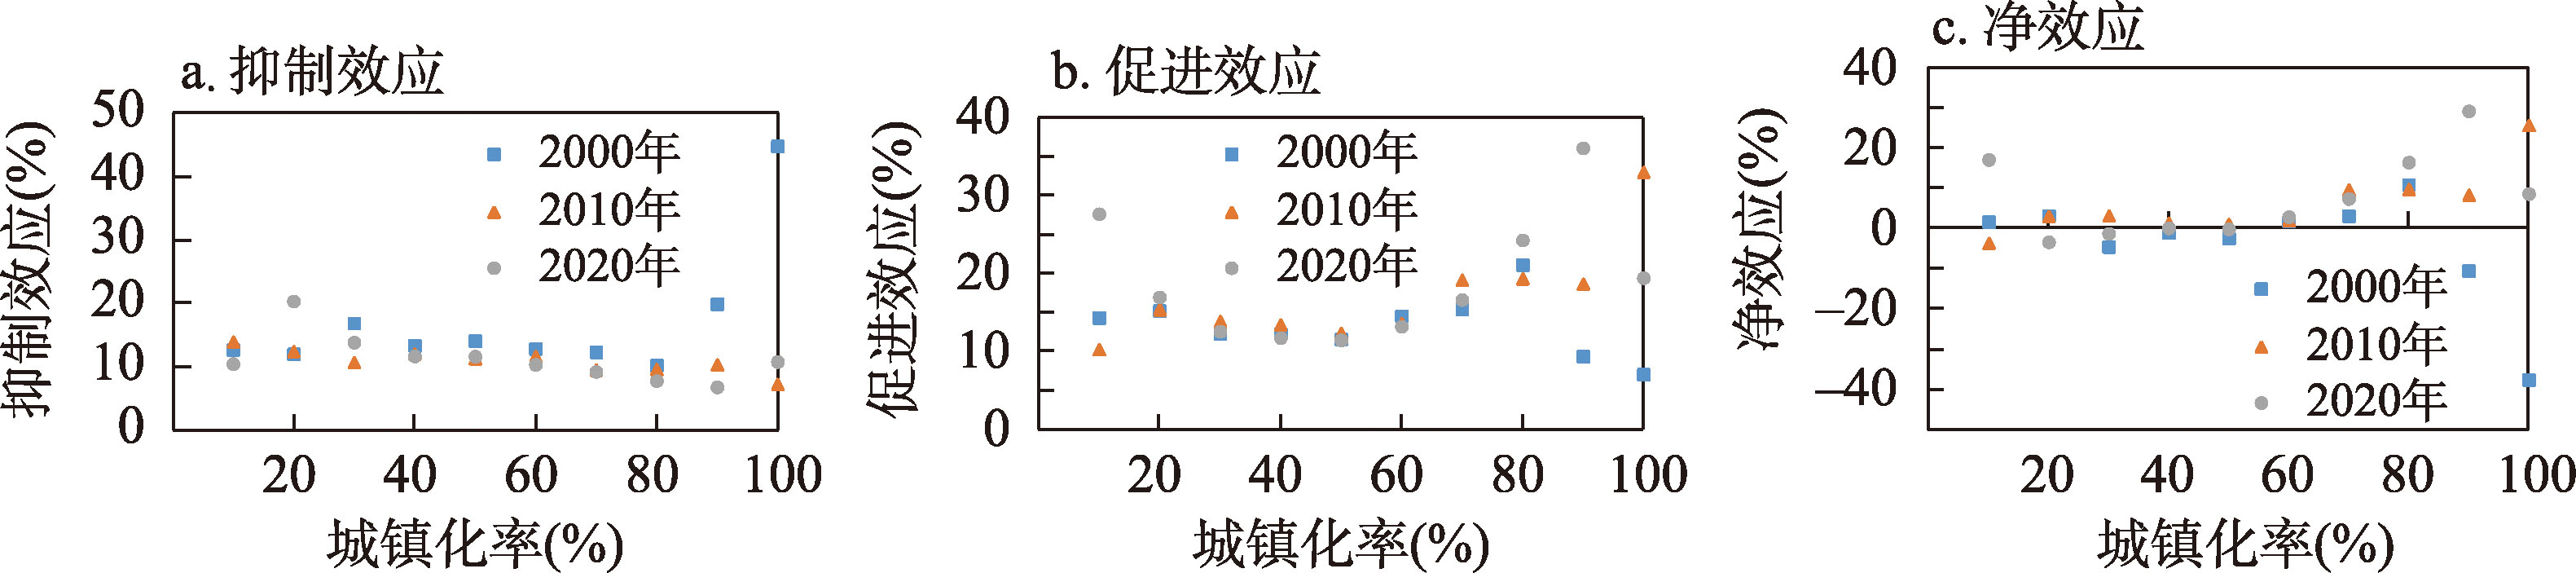
Fig. 11
Scatter plot of promotion effect, inhibitory effect, net effect and urbanization rate
Tab. 10
Bilateral effects of different industry types (%)
Tab. 11
Bilateral effects of different types of innovation (%)