×
模态框(Modal)标题
在这里添加一些文本
Close
Close
Submit
Cancel
Confirm
×
模态框(Modal)标题
×
Journal
Article
Figure
Search
EN
中文
Home
About Journal
Editorial Board
Guide for Authors
Peer review policy
Ethical Guidelines
Copyright transfer agreement
Submission Guidelines
Template article
Requirements for formatting references
Browse
Current Issue
Online First
Archive
Highlights
Topic
Archive by Subject
Most Viewed
Most Download
Most Cited
E-mail Alert
RSS
Subscribe
Advertisement
Contact us
EN
中文
Figure/Table detail
Value distribution, dependency, and drivers of the global energy industry
ZHANG Qiang, DU Debin, XIA Qifan, SUN Suyuan, GUI Qinchang
Acta Geographica Sinica
, 2024, 79(
10
): 2670-2690. DOI:
10.11821/dlxb202410016
输出国(地区)
输入国(地区)
国家(地区)1
国家(地区)2
…
国家(地区)
j
国家(地区)1
T
V
11
T
V
12
…
T
V
1
j
国家(地区)2
T
V
21
T
V
22
…
T
V
2
j
…
…
…
…
…
国家(地区)
i
T
V
i
1
T
V
i
2
…
T
V
i
j
Tab. 2
Decomposition of import and export values
Other figure/table from this article
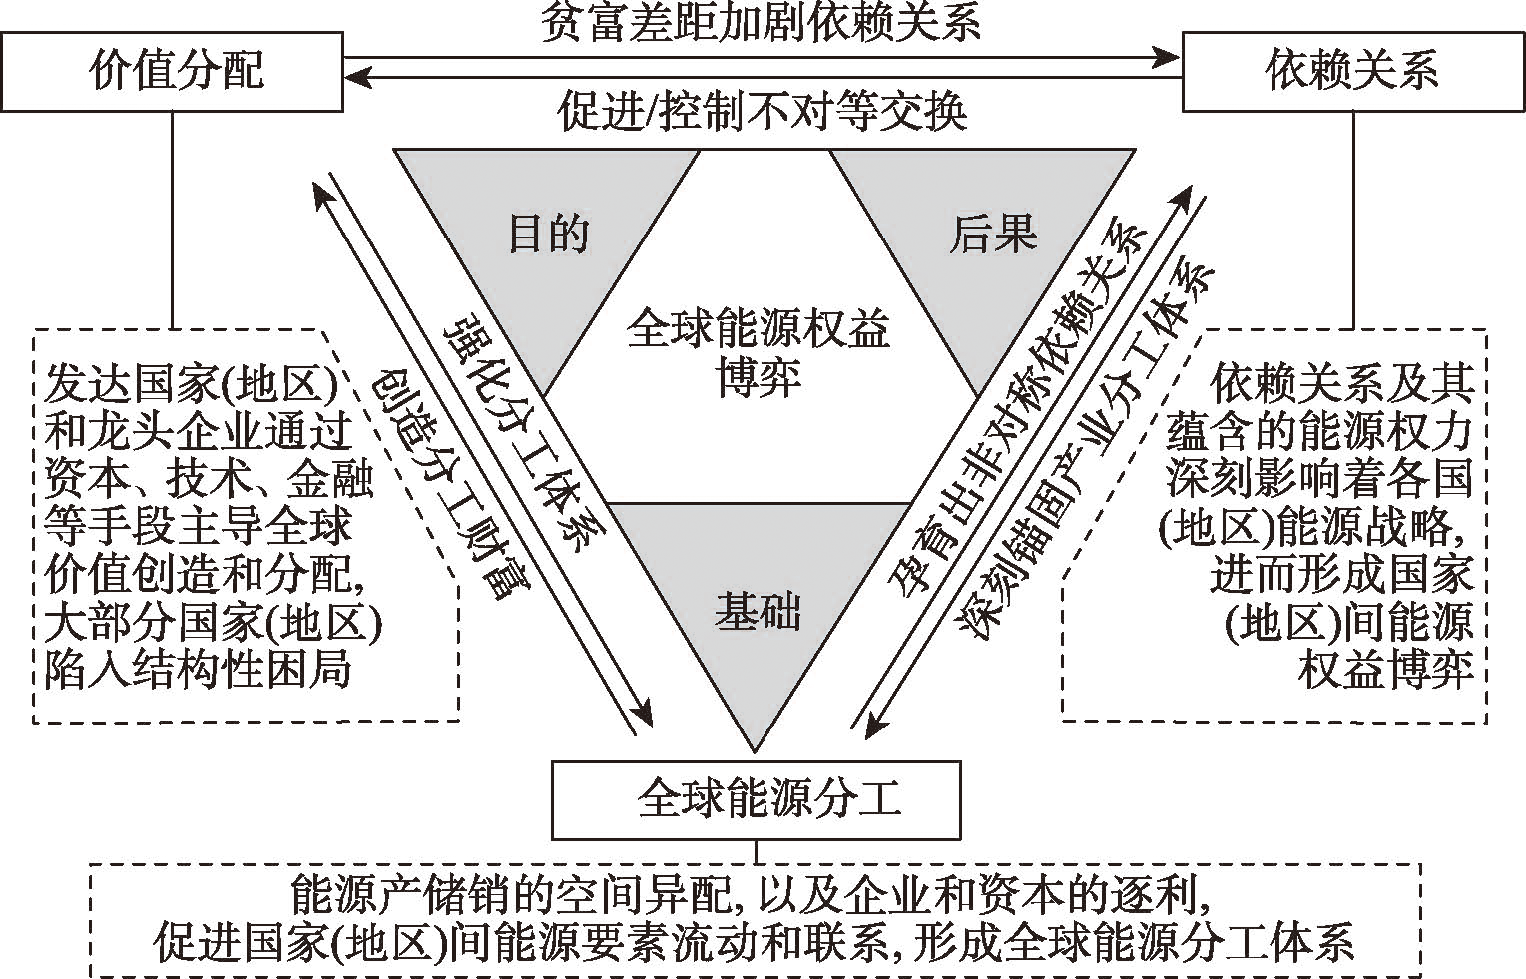
Fig. 1
The framework of global energy rights and interests game theory
Tab. 1
Transnational input-output table
Tab. 3
Key drivers for inter-country dependence on energy industry
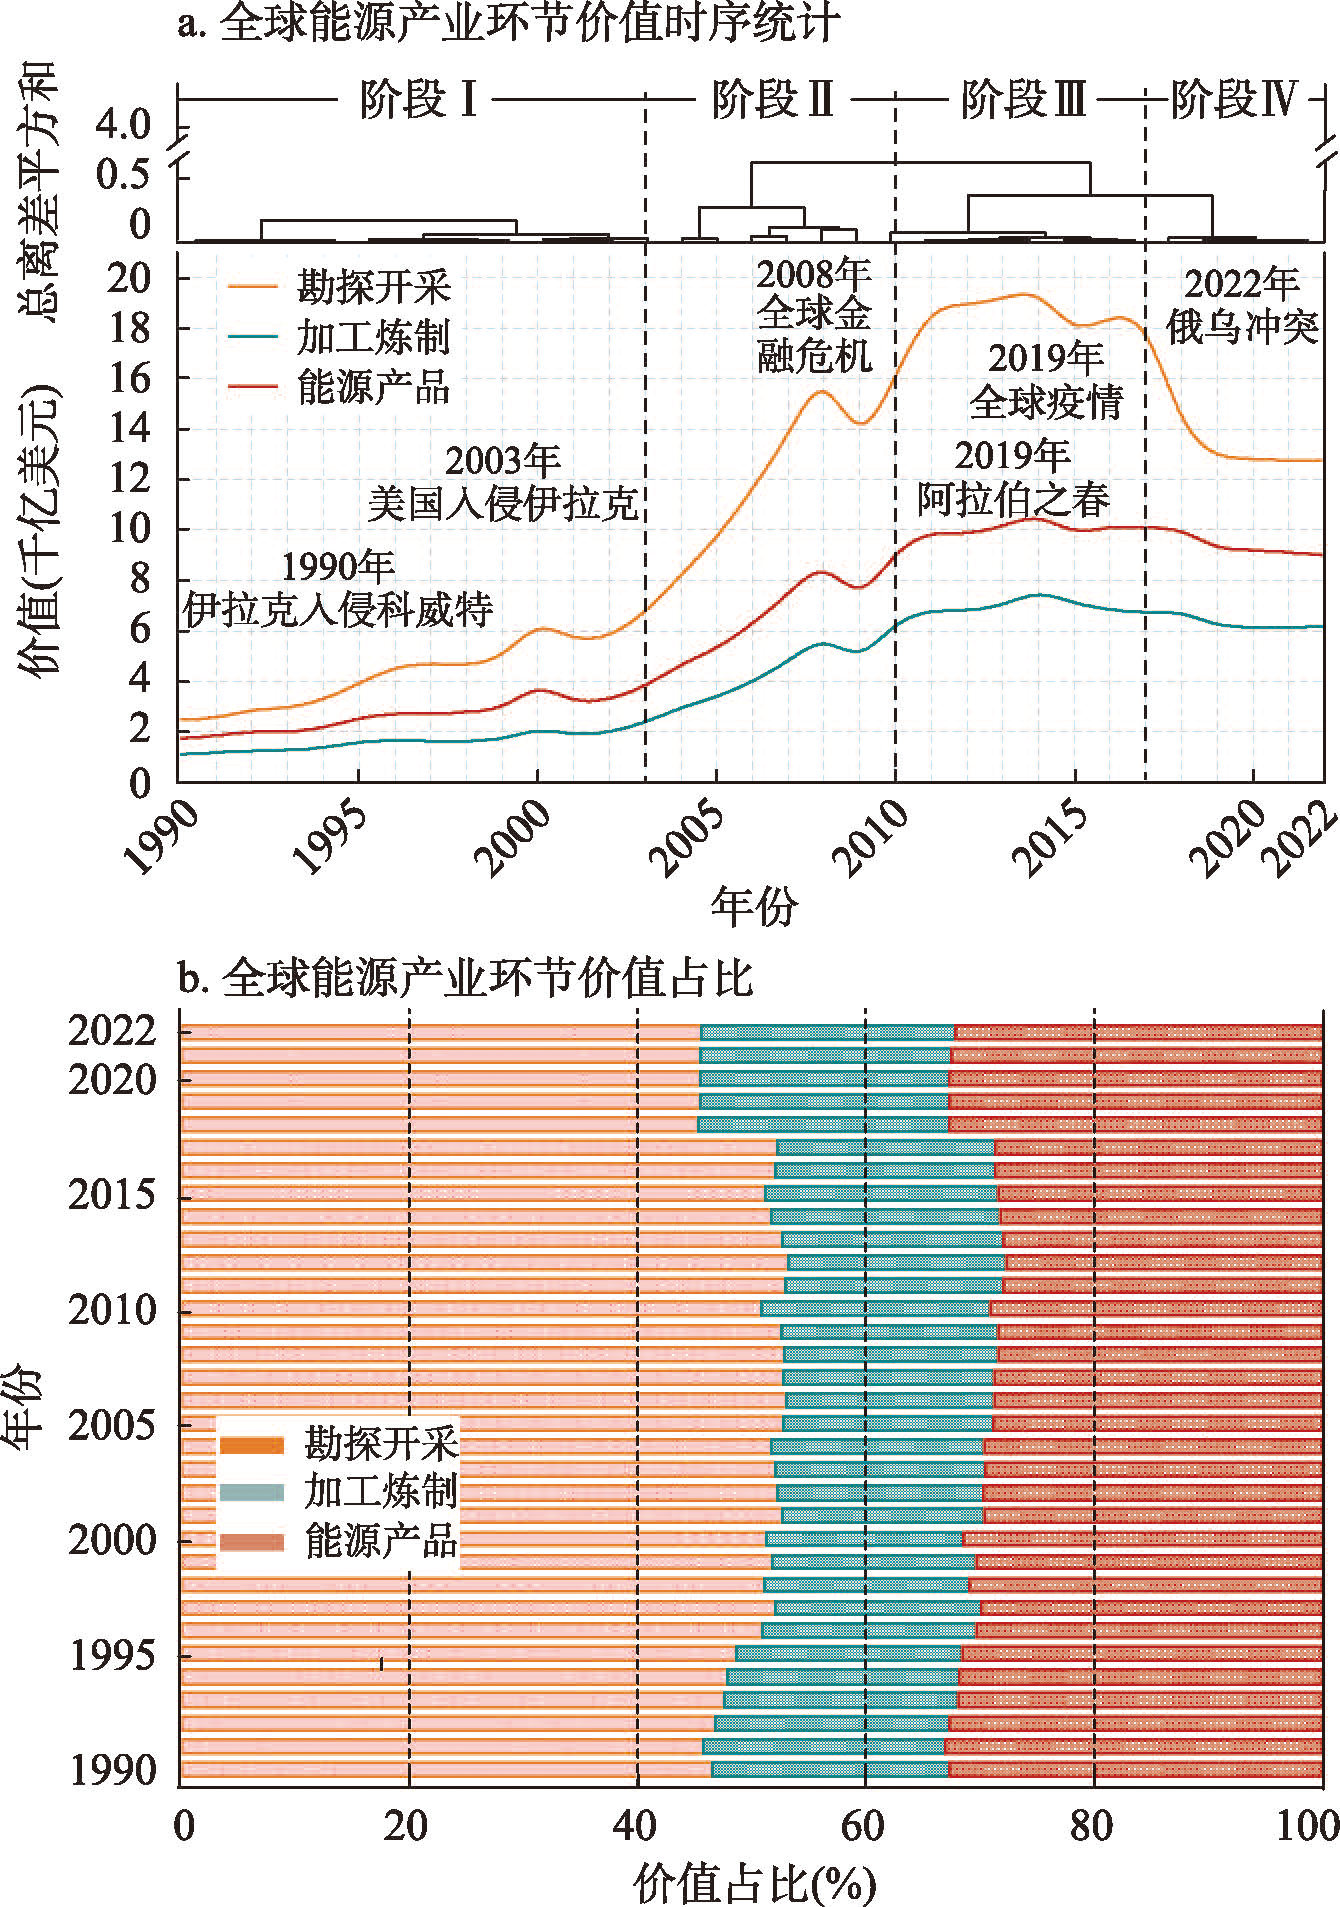
Fig. 2
Changes in the value of the global energy industry, 1990-2022
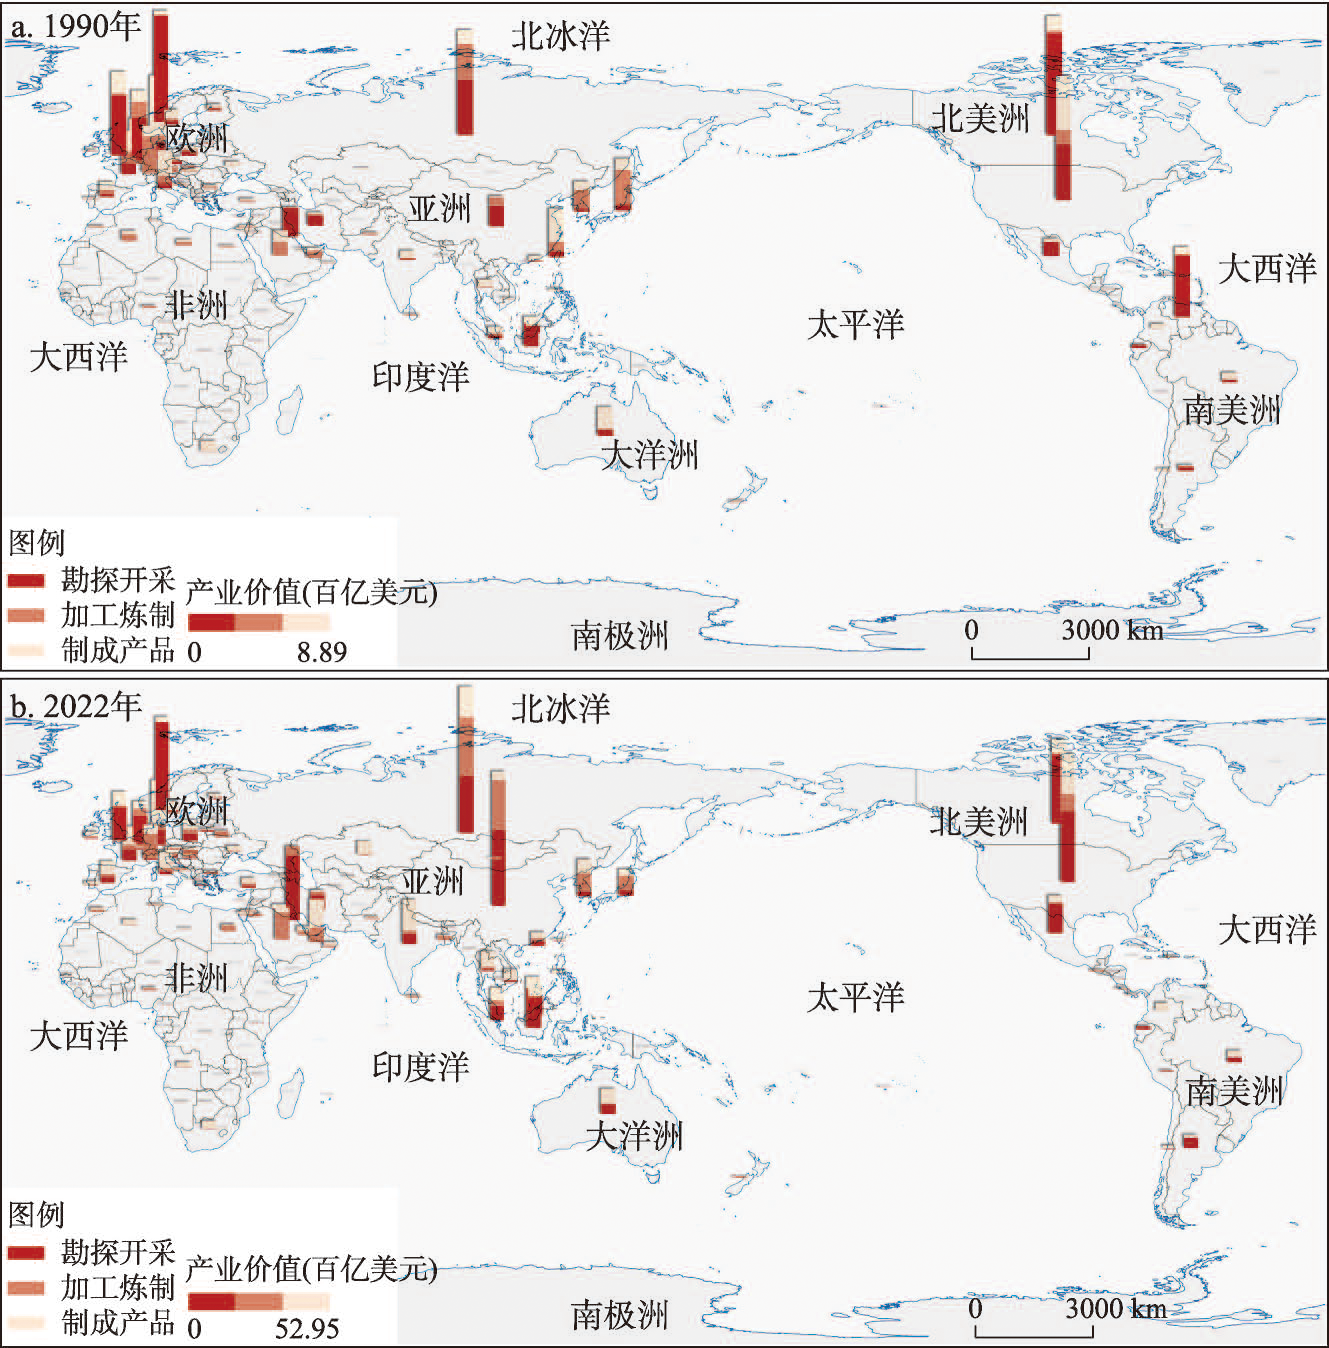
Fig. 3
Spatial pattern of value distribution of the global energy industry in 1990 and 2022
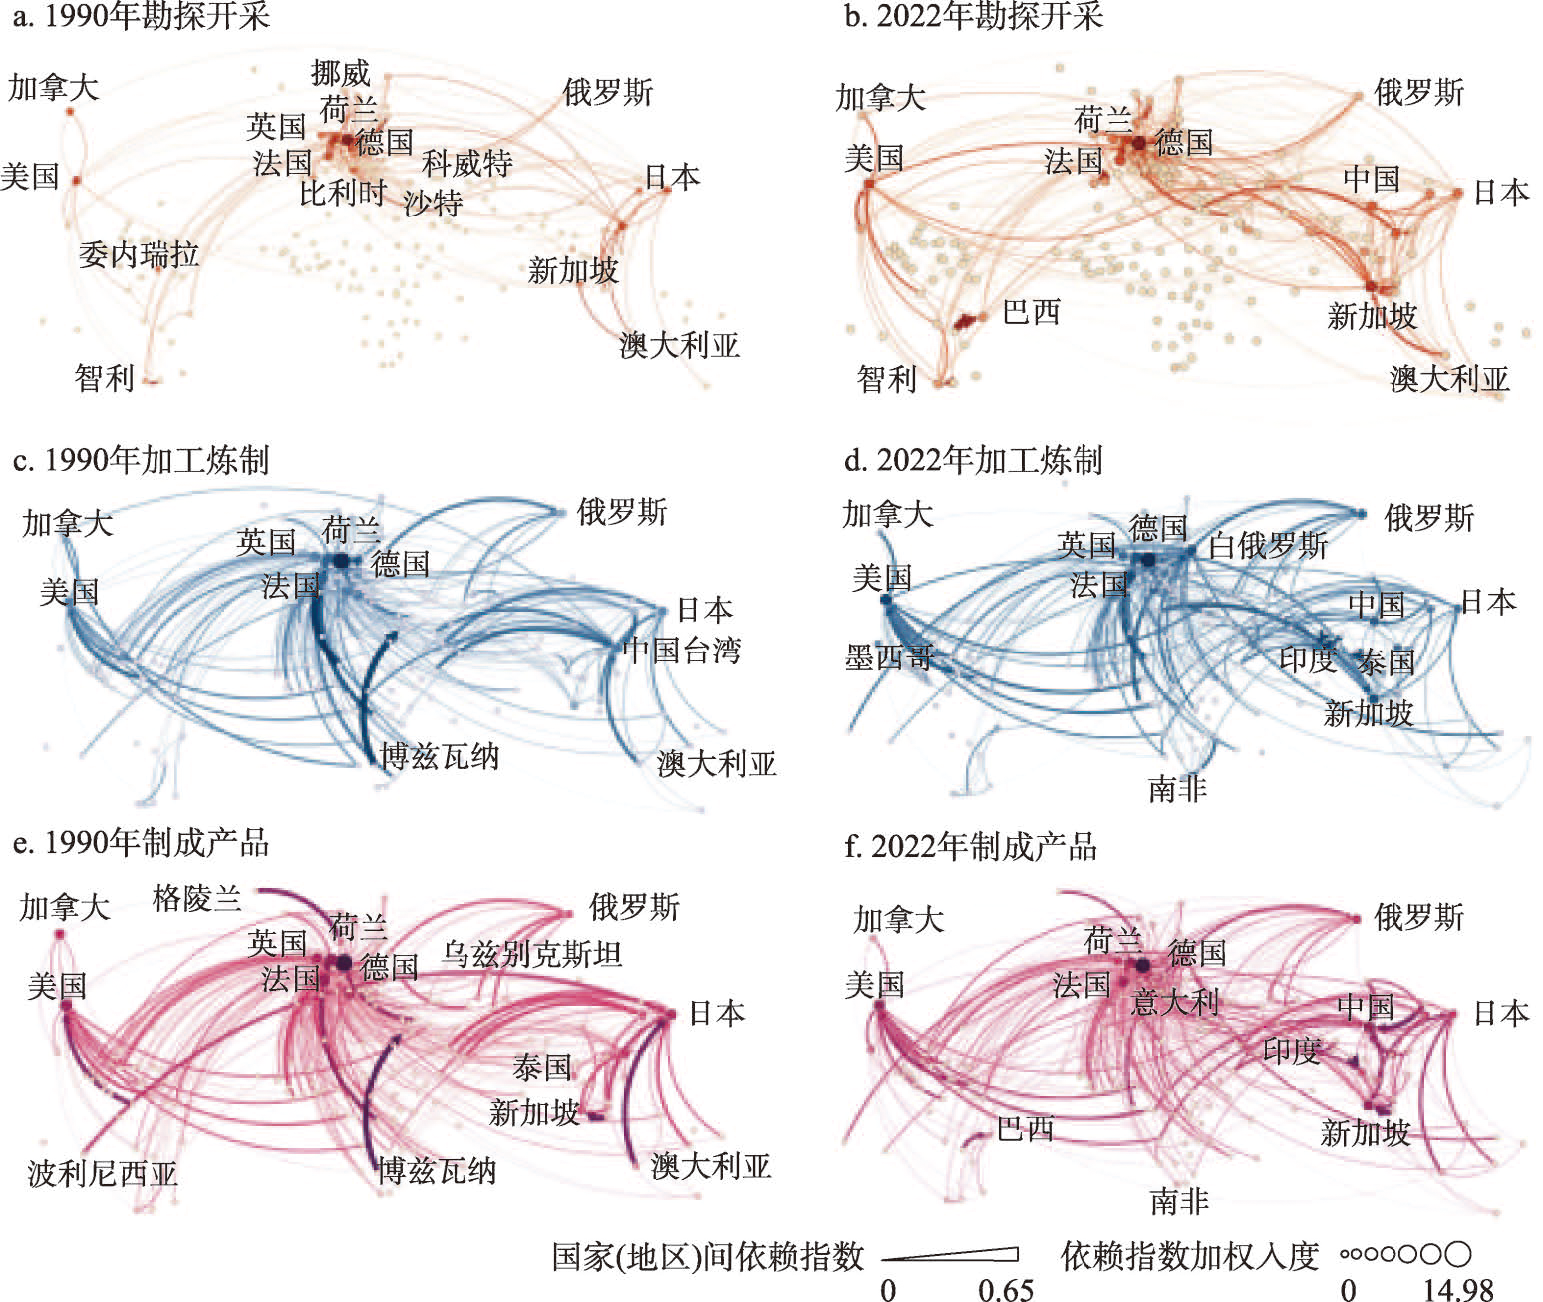
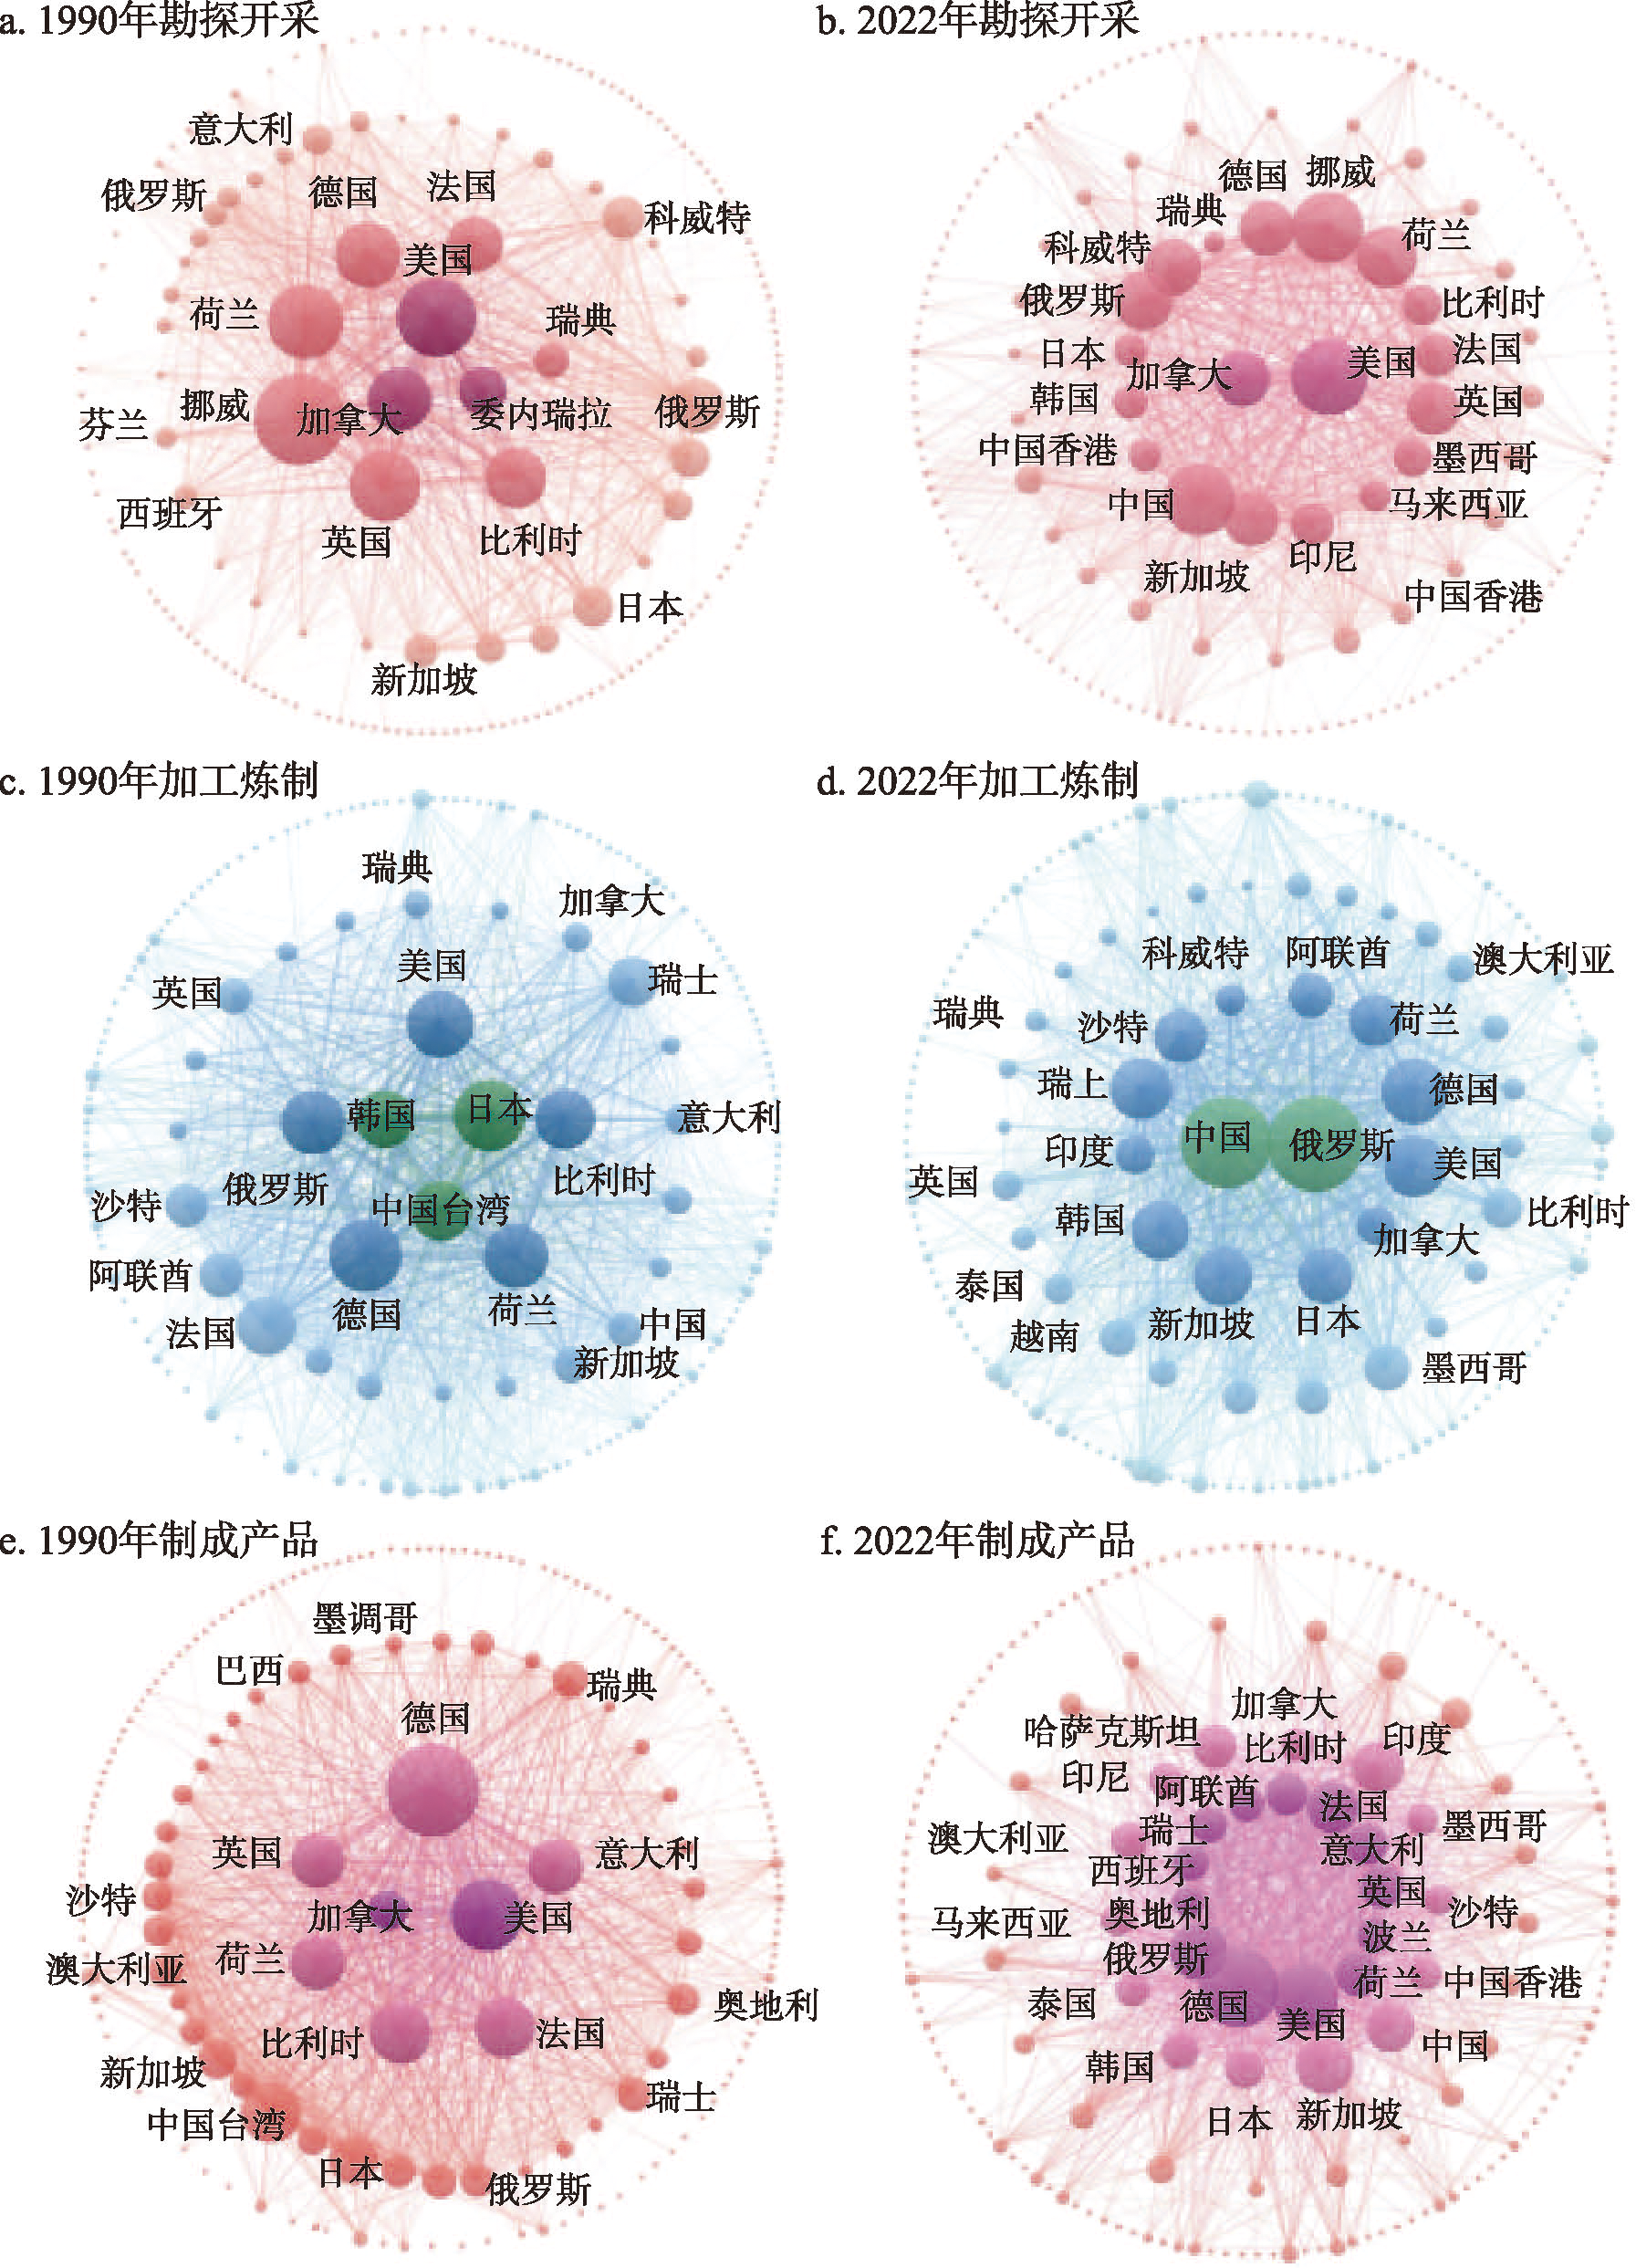
Fig. 4
Interdependence network of the global energy industry in 1990 and 2022
Tab. 4
Dependencies of energy industries between major energy countries in 1990 and 2022
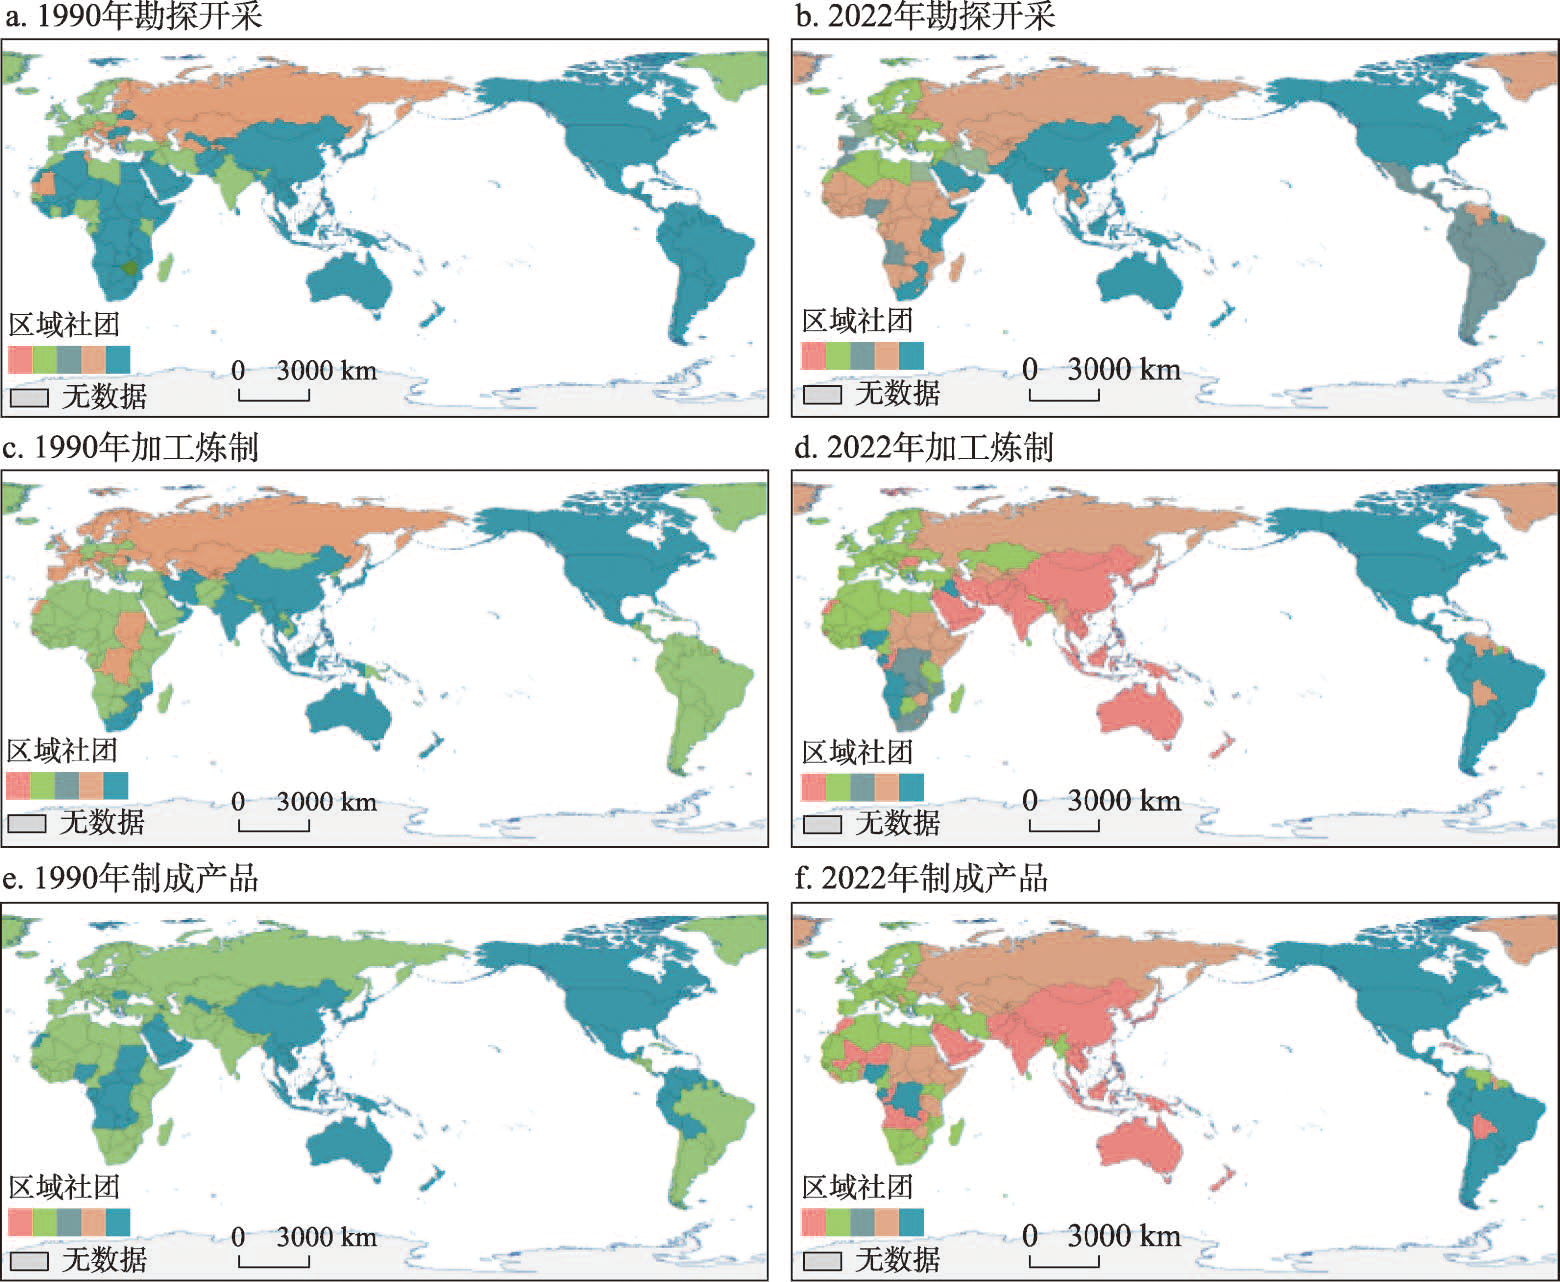
图5
1990年和2022年全球能源产业的社团划分
注:基于自然资源部标准地图服务网站审图号为GS2016(1666)号的标准地图制作,底图边界无修改;区域社团是指依赖关系更为紧密的国家(地区)组合。
Fig. 5
Division of regional cooperatives in the global energy industry in 1990 and 2022
Fig. 6
The "core-periphery" structure of global energy powers in 1990 and 2022
Tab. 5
Regression results of energy industry dependency relationship
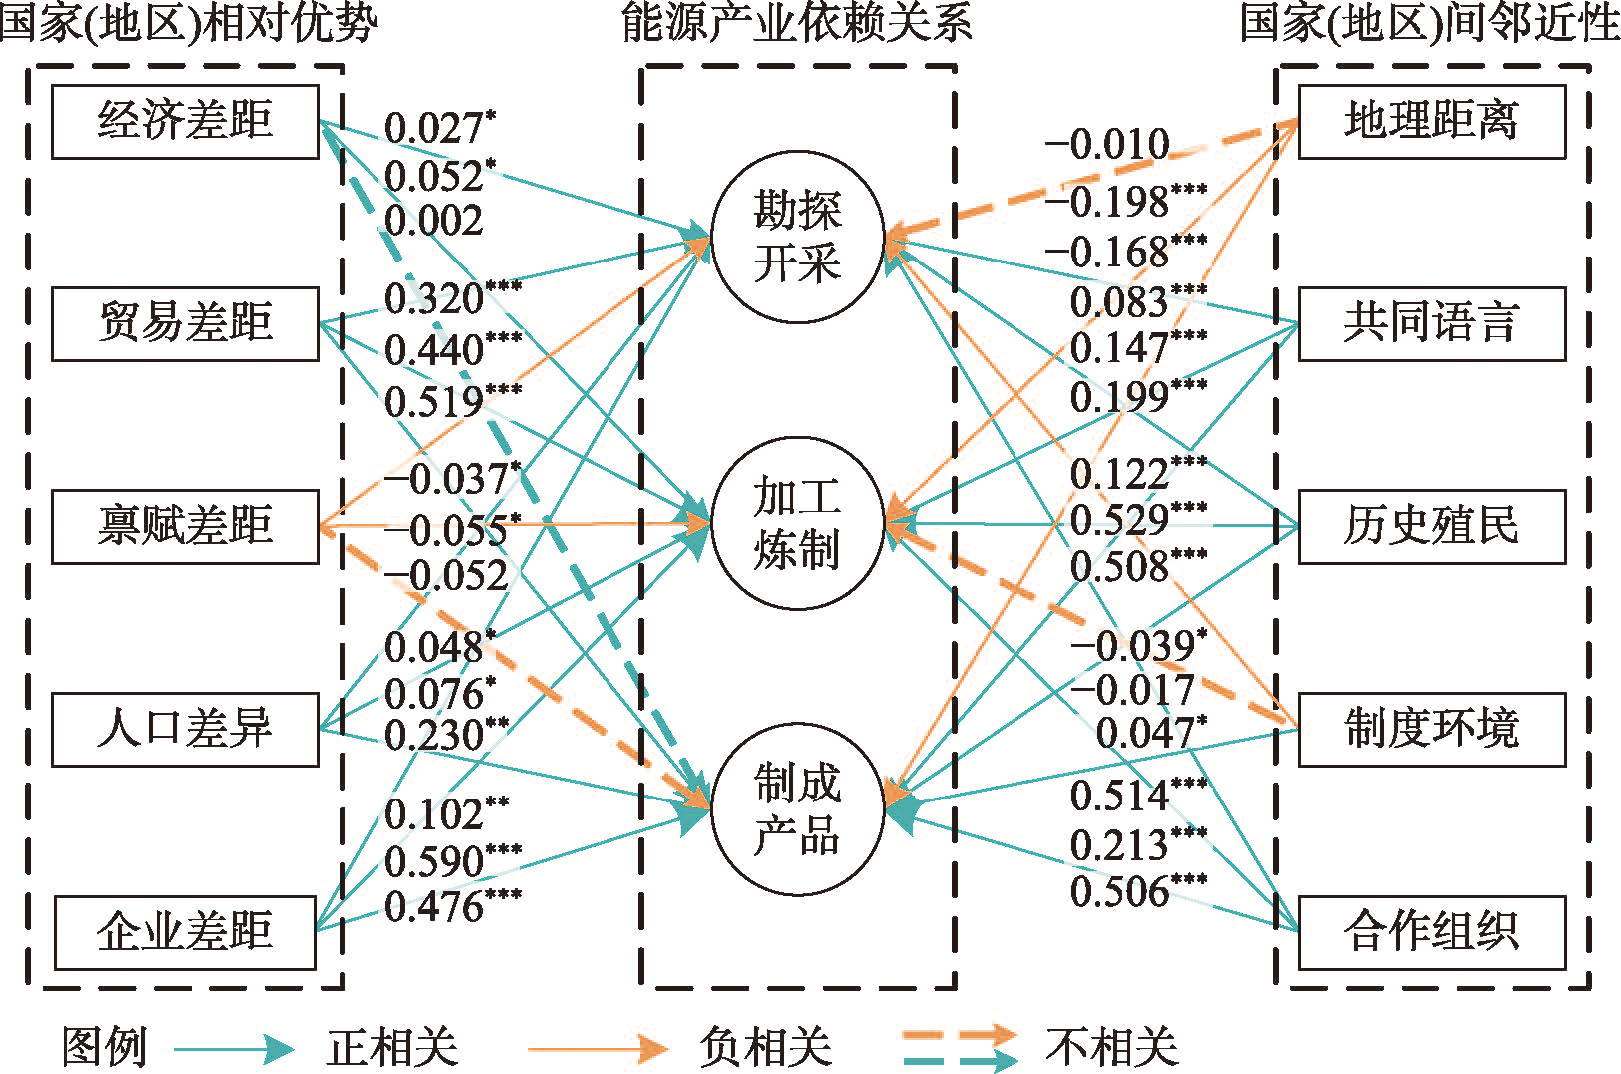
Fig. 7
Impact mechanisms of energy industry dependency relationship