×
模态框(Modal)标题
在这里添加一些文本
Close
Close
Submit
Cancel
Confirm
×
模态框(Modal)标题
×
Journal
Article
Figure
Search
EN
中文
Home
About Journal
About Journal
Indexed in
Awards
Editorial Board
Guide for Authors
Browse
Current Issue
Online First
Archive
Highlights
Topic
Archive by Subject
Most Viewed
Most Download
Most Cited
E-mail Alert
RSS
Subscribe
Advertisement
Contact us
EN
中文
Figure/Table detail
Examining the impacts of network position on urban carbon emissions efficiency in China
SHENG Kerong, LI Xiaorui, SUN Wei, WANG Chuanyang
Acta Geographica Sinica
, 2023, 78(
11
): 2864-2882. DOI:
10.11821/dlxb202311014
(1)
(2)
(3)
(4)
(5)
(6)
Degree
0.0467
***
(0.013)
0.0394
**
(0.016)
Between
0.0197
***
(0.007)
0.0159
**
(0.008)
Eigen
0.0039
***
(0.001)
0.0037
***
(0.001)
控制变量
否
是
否
是
否
是
Tab. 4
Robustness test results for replacing carbon emissions efficiency measurement methods
Other figure/table from this article
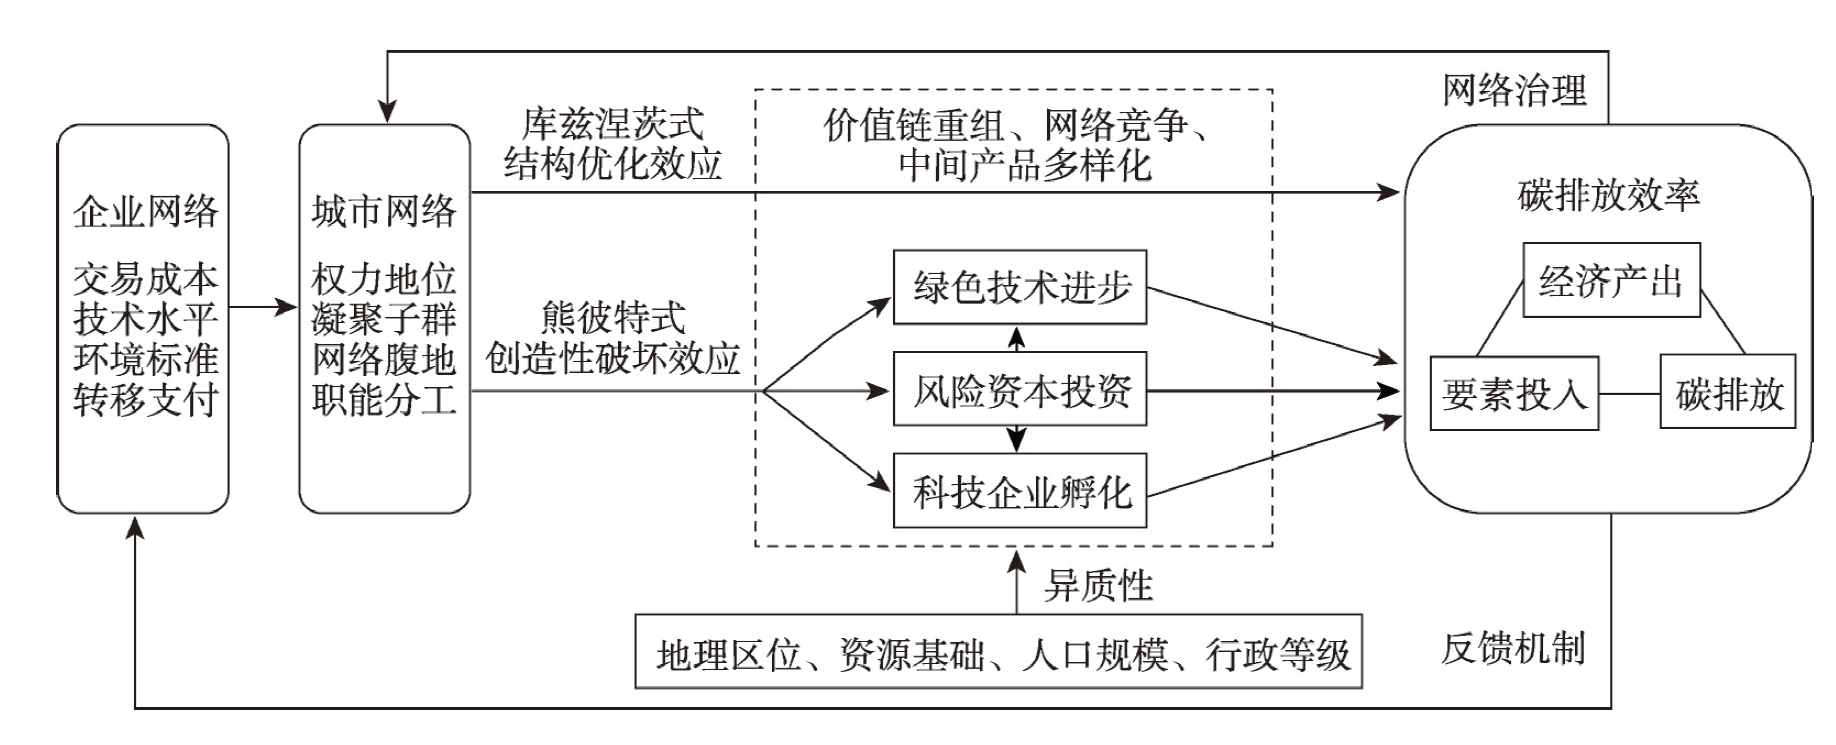
Fig. 1
Mechanisms and characteristics of network position affecting urban carbon emissions efficiency
Tab. 1
Indicators for measuring the total factor carbon emissions efficiency of cities
Tab. 2
Control variables and their definition methods
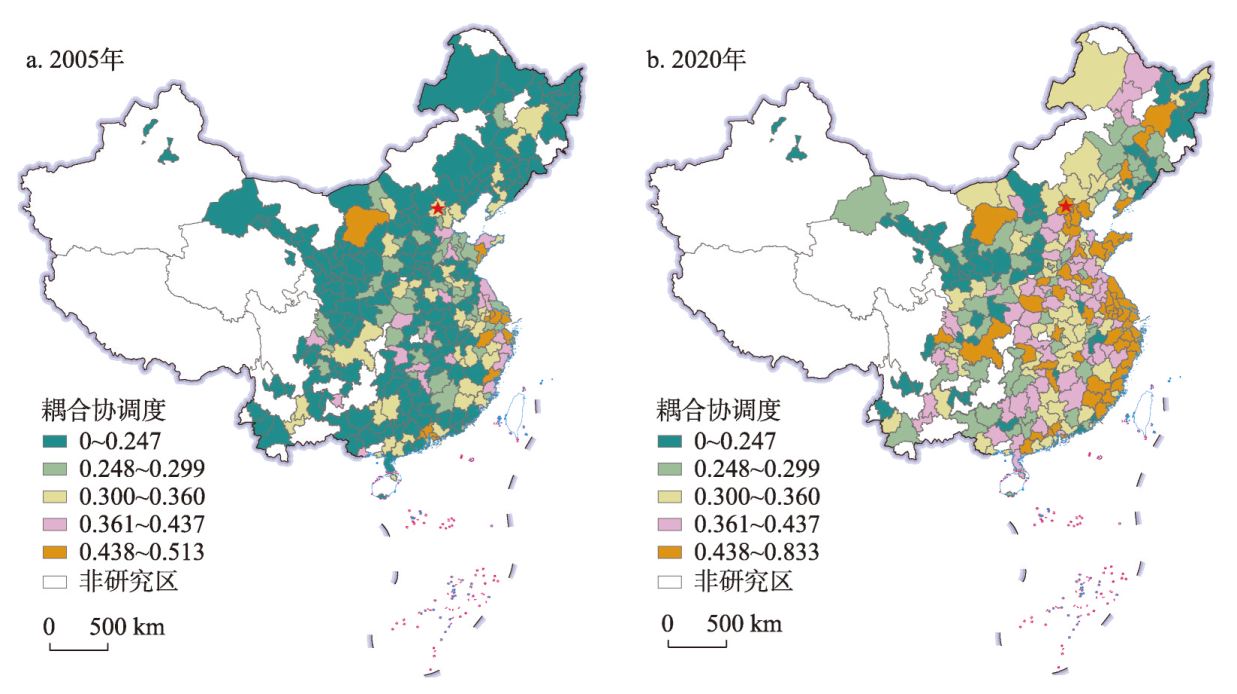
Fig. 2
The coupling patterns of carbon emissions efficiency and degree centralities of Chinese cities in 2005 and 2020
Tab. 3
The baseline regression results of panel Tobit model
Tab. 5
Robustness test results of spatial lag models
Tab. 6
Robustness test results of lagged variable models
Tab. 7
Robustness test results of two-step IV-Tobit models
Tab. 8
Test results of chain multiple mediation models
Tab. 9
Results of spatial heterogeneity test
Tab. 10
Results of type heterogeneity test