
The roundabout path of national export industrial upgrading driven by trade network embeddedness
Received date: 2024-01-17
Revised date: 2025-09-12
Online published: 2026-02-05
Supported by
National Natural Science Foundation of China(42171169)
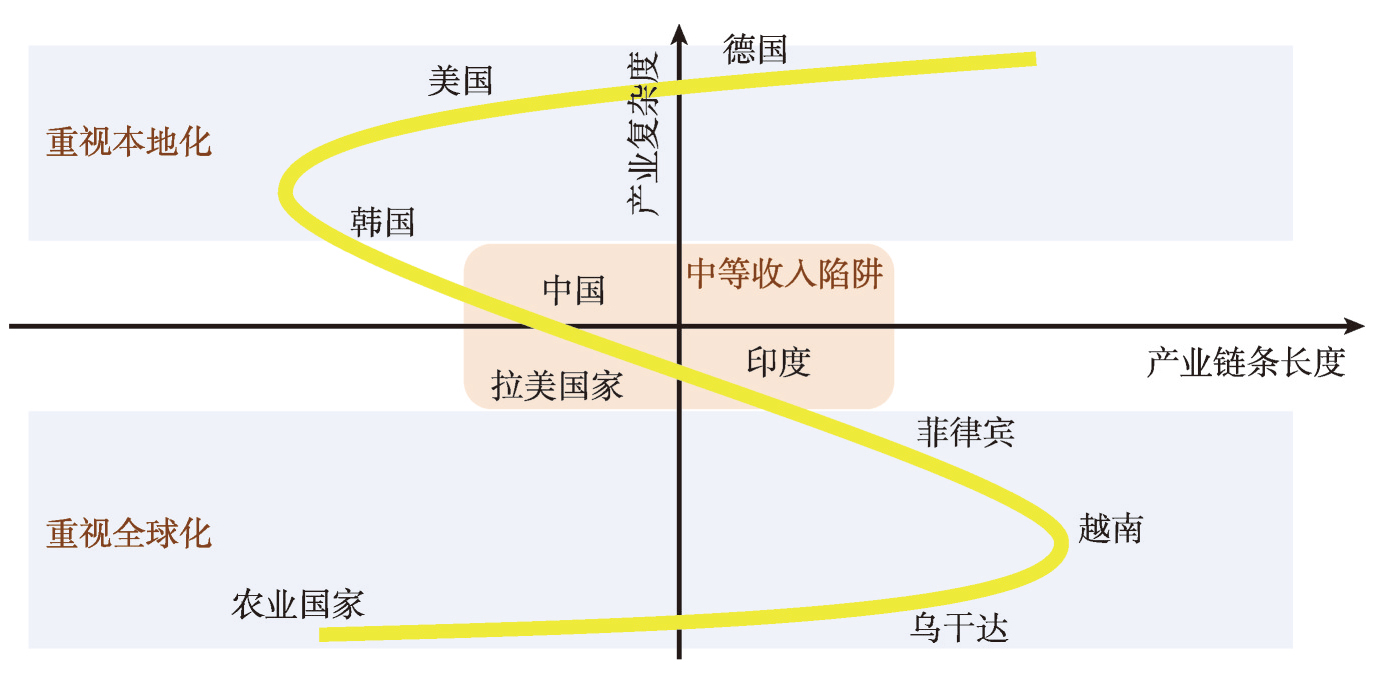
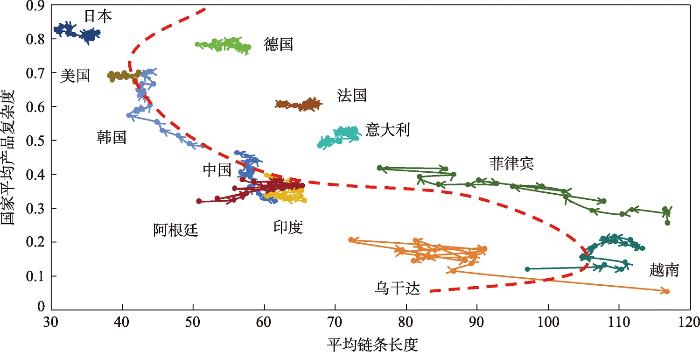
As trade globalization rises, its impact on industrial upgrading in latecomer countries is uncertain, with coexisting low-end lock-in and upgrading phenomena. Using 6-digit BACI-CEPII trade data from 2001 to 2019, this paper explores how a country's trade network embeddedness affects export industry upgrading, considering technological and organizational coordination difficulties, measured by industrial technological complexity and chain length. Key findings: (1) High trade network embeddedness positively impacts export industry upgrading, with distinct paths; latecomers initially develop short-chain industries, shifting to long-chain as they reach middle/high-income stages, while developed countries focus on long-chain upgrading. (2) Trade network embedding facilitates upgrading by expanding niche markets and accessing high-quality intermediates. (3) China currently favors short-chain industry development, relying less on the global trade network than other developing countries. Based on the empirical results, this study concludes that the S-shaped meandering upgrading pattern further improves the theory of globalization and regional industrial upgrading, and at the same time proposes a development path strategy for China's high-quality development from the perspective of international industries.
WANG Wenyu , HE Canfei , LI Zhibin . The roundabout path of national export industrial upgrading driven by trade network embeddedness[J]. Acta Geographica Sinica, 2026 , 81(2) : 472 -490 . DOI: 10.11821/dlxb202602010
表1 变量描述Tab. 1 Variable description |
| 类型 | 变量名 | 描述 |
|---|---|---|
| 被解释变量 | Entry | 高端新产品进入,基于产品复杂度衡量高端程度,取中位数作为是否高端产品的衡量。此变量是0和1变量,若该产品成为一国的比较优势产品,则为1,反之为0 |
| 解释变量 | EC | 特征向量中心性,代表一个国家在贸易网络的地位和嵌入程度 |
| Chain | 产业链条长度,根据产业空间算法计算,取百分位数作为产业链条关联的衡量,取对数处理 | |
| 控制变量 | RCA | 该产业在该国的比较优势 |
| lnGDP | 该国GDP的对数 | |
| lnpcGDP | 该国人均GDP的对数 | |
| 中介变量 | Rtmnm | 每个国家每个产业路径出口到优势市场(具有比较优势的市场)占总出口的比例 |
| Rtint | 每个国家每个2位数进口产品中,中间产品在该产品总进口的比例 |
表2 基准回归Tab. 2 Benchmark regression |
| 变量 | 全样本 | 低收入 | 中低收入 | 中高收入 | 高收入 | |||
|---|---|---|---|---|---|---|---|---|
| (1) | (2) | (3) | (4) | (5) | (6) | (7) | ||
| EC | 0.177*** (0.009) | 0.177*** (0.009) | 0.191*** (0.010) | 0.139*** (0.021) | 0.145*** (0.017) | 0.293*** (0.023) | 0.197*** (0.026) | |
| Chain | < -0.001 (0.000) | < 0.001 (0.000) | < -0.001*** (0.000) | < -0.001*** (0.000) | < 0.001*** (0.000) | < 0.001** (0.000) | ||
| EC_Chain | -0.021*** (0.005) | 0.023*** (0.004) | 0.083*** (0.005) | 0.053*** (0.006) | ||||
| RCA | < 0.001*** (0.000) | < 0.001*** (0.000) | 0.001*** (0.000) | < 0.001*** (0.000) | < 0.001*** (0.000) | |||
| lnGDP | < -0.001 (0.001) | -0.014*** (0.003) | 0.020*** (0.002) | -0.003 (0.002) | 0.005*** (0.001) | |||
| lnpcGDP | < -0.001 (0.001) | -0.014*** (0.003) | 0.020*** (0.002) | -0.003 (0.002) | 0.005*** (0.001) | |||
| 常数项 | 0.016*** (0.001) | 0.016*** (0.001) | 0.020 (0.012) | 0.271*** (0.058) | -0.278*** (0.036) | 0.049 (0.037) | -0.033** (0.017) | |
| 国家 | Yes | Yes | Yes | Yes | Yes | Yes | Yes | |
| 产品 | Yes | Yes | Yes | Yes | Yes | Yes | Yes | |
| 年份 | Yes | Yes | Yes | Yes | Yes | Yes | Yes | |
| N | 7104739 | 7104739 | 6847934 | 1189118 | 1817375 | 1785911 | 2055530 | |
| F | 296.869 | 295.876 | 307.316 | 70.243 | 130.634 | 107.130 | 157.078 | |
| R2 | 0.012 | 0.012 | 0.013 | 0.010 | 0.015 | 0.011 | 0.013 | |
| p | < 0.001 | < 0.001 | < 0.001 | < 0.001 | < 0.001 | < 0.001 | < 0.001 | |
注:显著水平:*:p < 0.1,**:p < 0.05,***:p < 0.01;括号内数值为标准误。 |
表3 贸易网络嵌入作用机制检验Tab. 3 Testing the embeddedness mechanism in trade networks |
| 变量 | Rtmnm | Rtint | Entry | |||
|---|---|---|---|---|---|---|
| (1) | (2) | (3) | (4) | (5) | ||
| EC | 3.420***(0.038) | 0.086***(0.005) | -0.014(0.027) | 0.161***(0.027) | -0.004(0.027) | |
| Rtmnm | 0.055***(0.000) | 0.053***(0.000) | ||||
| Rtint | 0.010***(0.003) | 0.006**(0.003) | ||||
| Chain | 0.009***(0.000) | 0.008***(0.000) | ||||
| EC_Chain | 0.640***(0.006) | |||||
| Rtmnm_Chain | 0.006***(0.000) | |||||
| Rtint_Chain | 0.066***(0.001) | |||||
| 常数项 | -1.627***(0.047) | 0.066***(0.006) | 0.594***(0.033) | 0.471***(0.033) | 0.565***(0.033) | |
| 控制变量 | Yes | Yes | Yes | Yes | Yes | |
| 国家 | Yes | Yes | Yes | Yes | Yes | |
| 产品 | Yes | Yes | Yes | Yes | Yes | |
| 年份 | Yes | Yes | Yes | Yes | Yes | |
| N | 2988757 | 2988757 | 2988757 | 2988757 | 2988757 | |
| F | 4592.289 | 74094.772 | 2961.414 | 2958.246 | 2996.894 | |
| R2 | 0.255 | 0.847 | 0.182 | 0.182 | 0.186 | |
| p | < 0.001 | < 0.001 | < 0.001 | < 0.001 | < 0.001 |
注:显著水平:*:p < 0.1,**:p < 0.05,***:p < 0.01;括号内数值为标准误。 |
表4 贸易网络嵌入作用机制地区异质性Tab. 4 Regional heterogeneity in the embeddedness mechanism of trade networks |
| 变量 | 全样本 | 发达国家 | 发展中国家 | 金砖国家 | 东亚国家 |
|---|---|---|---|---|---|
| (1) | (2) | (3) | (4) | (5) | |
| EC | -0.005(0.027) | -0.053**(0.022) | 1.353***(0.304) | 0.182(1.256) | 10.445*(6.332) |
| Rtmnm | 0.056***(0.000) | 0.058***(0.000) | 0.038***(0.002) | -0.006(0.004) | 0.059***(0.008) |
| Rtint | 0.018***(0.003) | 0.021***(0.003) | 0.008(0.020) | 0.329***(0.040) | 0.011(0.120) |
| Rtmnm_CHN | 0.130***(0.010) | 0.127***(0.008) | 0.121***(0.016) | 0.146***(0.013) | 0.043***(0.016) |
| Rtint_CHN | 1.774***(0.113) | 1.796***(0.093) | 1.009***(0.179) | 1.578***(0.163) | 0.026(0.263) |
| 常数项 | 0.585***(0.033) | 0.617***(0.029) | 2.748***(0.302) | -7.728***(0.976) | -10.367**(4.120) |
| 控制变量 | Yes | Yes | Yes | Yes | Yes |
| 国家 | Yes | Yes | Yes | Yes | Yes |
| 产品 | Yes | Yes | Yes | Yes | Yes |
| 年份 | Yes | Yes | Yes | Yes | Yes |
| N | 2988757 | 2491565 | 515014 | 89091 | 53466 |
| F | 2937.497 | 1325.182 | 2553.690 | 722.933 | 1320.798 |
| R2 | 0.182 | 0.096 | 0.235 | 0.236 | 0.471 |
| p | < 0.001 | < 0.001 | < 0.001 | < 0.001 | < 0.001 |
注:显著水平:*:p < 0.1,**:p < 0.05,***:p < 0.01;括号内数值为标准误。 |
表5 升级模式对比Tab. 5 Comparative analysis of upgrading models |
| 变量 | X=中国 | X=巴西、阿根廷等 | X=韩国 | |||||
|---|---|---|---|---|---|---|---|---|
| (1) | (2) | (3) | (4) | (5) | (6) | |||
| EC | 0.187***(0.010) | 0.167***(0.010) | 0.187***(0.010) | 0.187***(0.010) | 0.212**(0.094) | 0.213**(0.094) | ||
| Chain | -0.000***(0.000) | -0.000***(0.000) | -0.000***(0.000) | -0.000***(0.000) | 0.000***(0.000) | 0.000**(0.000) | ||
| X | 0.031***(0.003) | 0.132***(0.009) | 0.014***(0.002) | 0.014***(0.004) | 0.011**(0.005) | 0.025***(0.009) | ||
| EC_X | -5.198***(0.413) | 0.029(0.180) | -0.740**(0.368) | |||||
| Chain_X | -0.002***(0.000) | 0.003***(0.000) | 0.001*(0.001) | |||||
| 常数项 | 0.055***(0.012) | 0.055***(0.012) | 0.055***(0.012) | 0.055***(0.012) | -0.140(0.096) | -0.154(0.096) | ||
| 控制变量 | Yes | Yes | Yes | Yes | Yes | Yes | ||
| 国家 | Yes | Yes | Yes | Yes | Yes | Yes | ||
| 产品 | Yes | Yes | Yes | Yes | Yes | Yes | ||
| 年份 | Yes | Yes | Yes | Yes | Yes | Yes | ||
| N | 5808240 | 5808240 | 5808240 | 5808240 | 1039694 | 1039694 | ||
| F | 248.566 | 247.370 | 248.566 | 247.171 | 1140.889 | 1123.666 | ||
| R2 | 0.011 | 0.011 | 0.011 | 0.011 | 0.125 | 0.125 | ||
| p | < 0.001 | < 0.001 | < 0.001 | < 0.001 | < 0.001 | < 0.001 | ||
注:显著水平:*:p < 0.1,**:p < 0.05,***:p < 0.01;括号内数值为标准误。 |
| [1] |
[贺灿飞, 李志斌. 论中国式现代化进程中的区域高质量发展. 社会科学辑刊, 2023(2): 112-119.]
|
| [2] |
[王文宇, 贺灿飞. 关系经济地理学与贸易网络研究进展. 地理科学进展, 2022, 41(3): 461-476.]
|
| [3] |
|
| [4] |
[刘逸, 张一帆, 黄凯旋, 等. 全球化下产业升级的区域模式与演化路径. 地理学报, 2023, 78(2): 351-370.]
|
| [5] |
[刘卫东, 刘红光, 唐志鹏, 等. 出口对中国区域经济增长和产业结构转型的影响分析. 地理学报, 2010, 65(4): 407-415.]
|
| [6] |
|
| [7] |
|
| [8] |
|
| [9] |
[贺灿飞, 陈航航. 参与全球生产网络与中国出口产品升级. 地理学报, 2017, 72(8): 1331-1346.]
|
| [10] |
|
| [11] |
|
| [12] |
|
| [13] |
|
| [14] |
|
| [15] |
|
| [16] |
|
| [17] |
|
| [18] |
|
| [19] |
|
| [20] |
|
| [21] |
[刘庆林, 高越, 韩军伟. 国际生产分割的生产率效应. 经济研究, 2010, 45(2): 32-43, 108.]
|
| [22] |
|
| [23] |
[刘维刚, 倪红福, 夏杰长. 生产分割对企业生产率的影响. 世界经济, 2017, 40(8): 29-52.]
|
| [24] |
[李优树, 张坤. 价值链长度、 国内大循环与经济增长: 基于我国制造业的实证分析. 商业研究, 2022(1): 25-33.]
|
| [25] |
|
| [26] |
[吕越, 陈帅, 盛斌. 嵌入全球价值链会导致中国制造的“低端锁定”吗? 管理世界, 2018, 34(8): 11-29.]
|
| [27] |
|
| [28] |
[郑江淮, 郑玉. 新兴经济大国中间产品创新驱动全球价值链攀升: 基于中国经验的解释. 中国工业经济, 2020(5): 61-79.]
|
| [29] |
|
| [30] |
|
| [31] |
|
| [32] |
|
| [33] |
|
| [34] |
|
| [35] |
[吕越, 黄艳希, 陈勇兵. 全球价值链嵌入的生产率效应: 影响与机制分析. 世界经济, 2017, 40(7): 28-51.]
|
| [36] |
|
| [37] |
|
| [38] |
|
| [39] |
|
| [40] |
|
| [41] |
|
/
| 〈 |
|
〉 |