
Spatiotemporal differentiation and evolutionary mechanism of ecological resilience in the middle reaches of the Yangtze River urban agglomeration
Received date: 2024-04-30
Revised date: 2025-03-17
Online published: 2025-06-13
Supported by
National Natural Science Foundation of China(42201230)
Natural Science Foundation of Hunan Province(2024JJ5060)
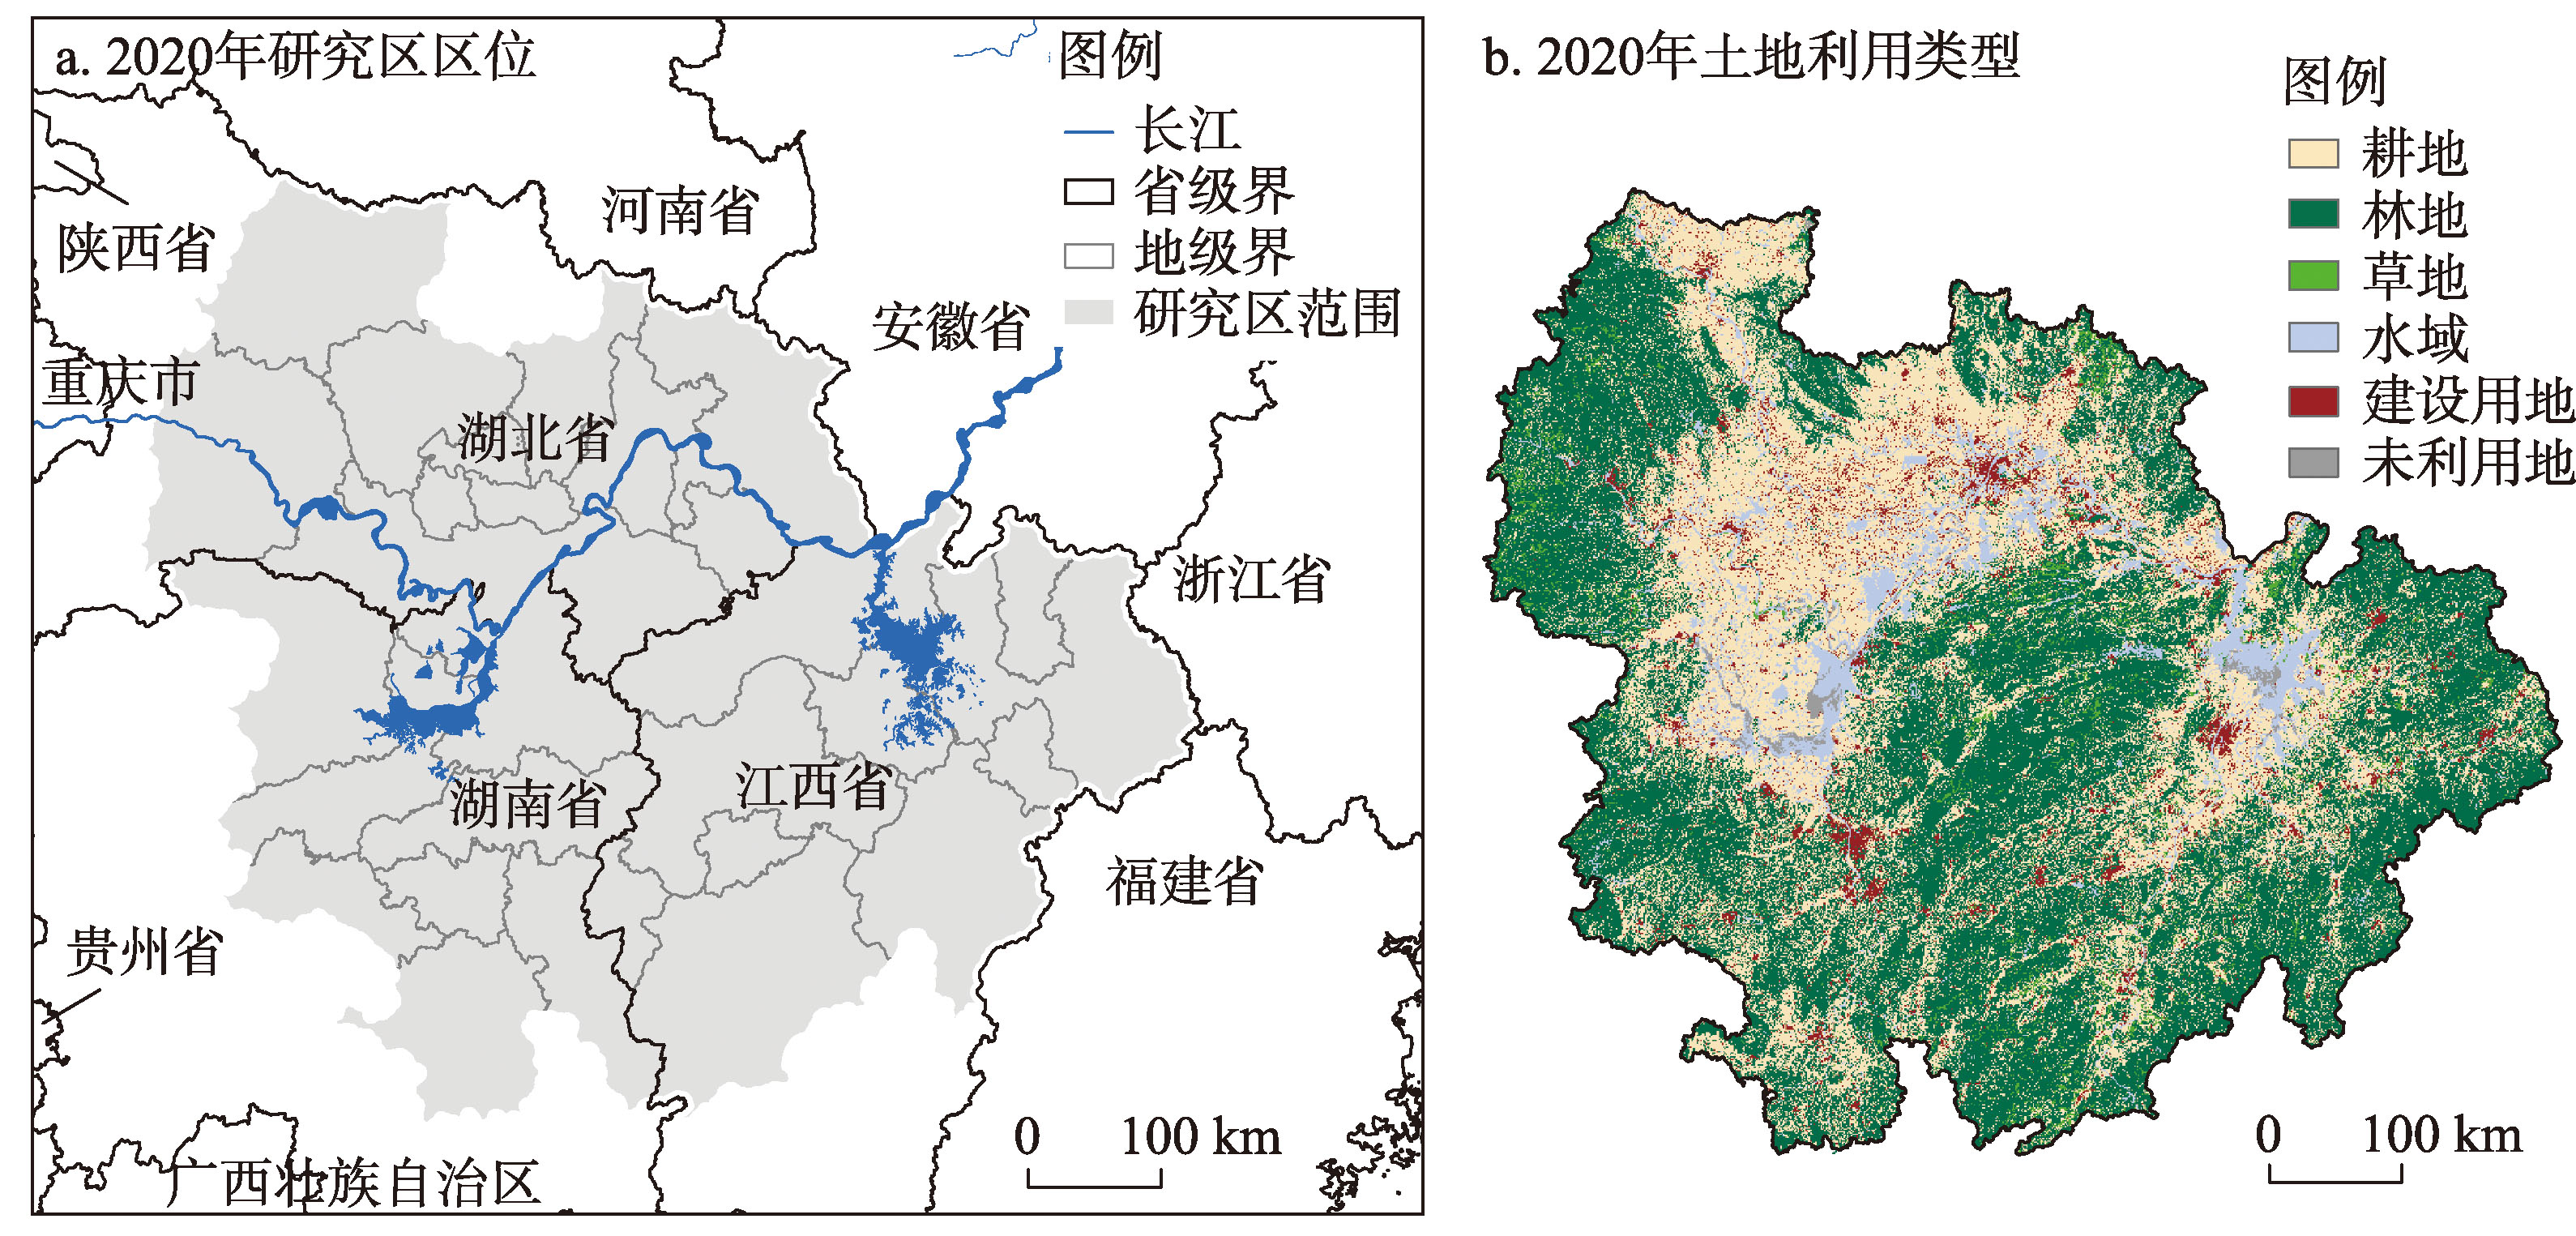
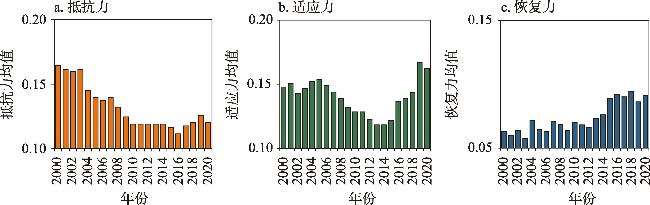
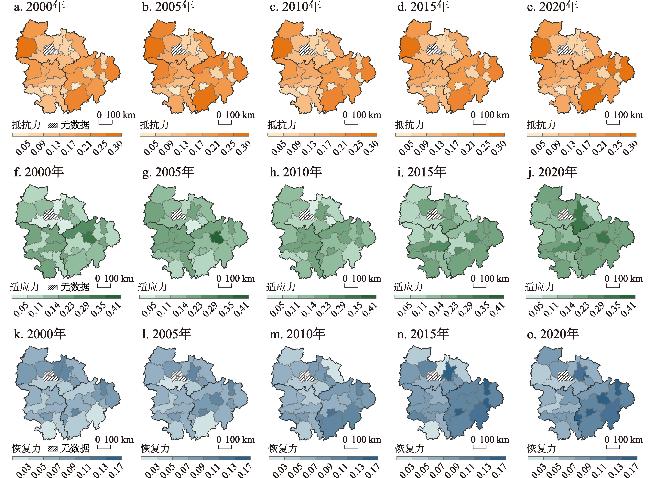
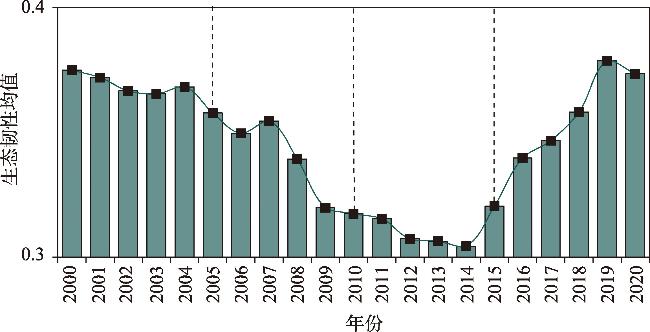
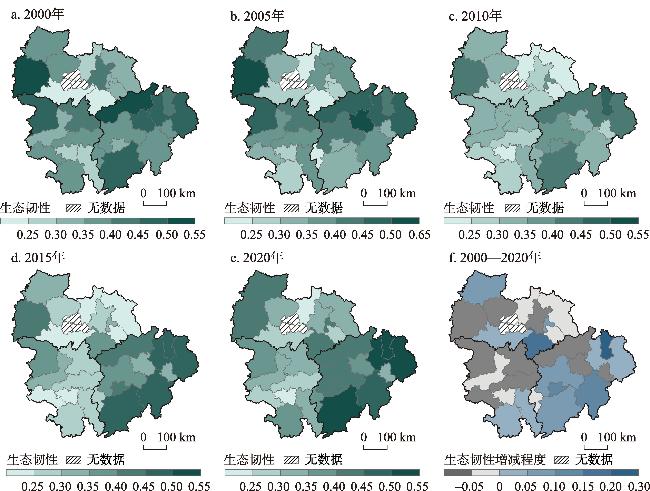
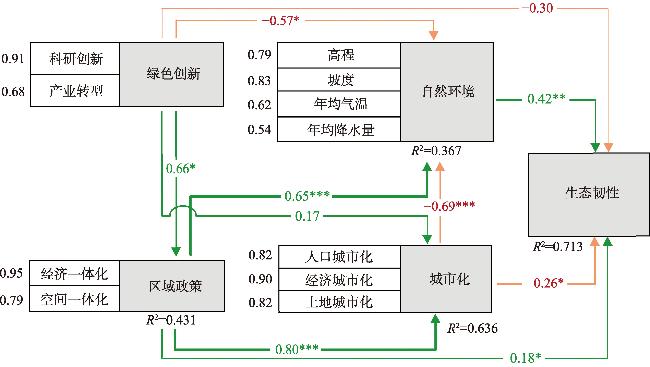
Ecological resilience refers to an urban agglomeration's ability to resist, adapt, and recover from external disturbances. Enhancing ecological resilience is crucial for promoting high-quality development in the modern era. However, few studies have evaluated the ecological resilience of urban agglomerations from the perspective of human-land interactions or explored its evolutionary mechanism. This study assesses the interannual variation of ecological resilience in the middle reaches of the Yangtze River urban agglomeration, focusing on resistance, adaptation, and recovery. The Least Squares Structural Equation Model is employed to analyze the impact degree and pathways through which human-land interactions affect ecological resilience. The results indicate that from 2000 to 2020, resistance, adaptability, and recoverability exhibited fluctuating trends over time and an unbalanced spatial distribution. Ecological resilience initially decreased but later improved, with significant spatial heterogeneity, forming a "higher in the southeast and lower in the northwest" pattern. Natural environment improvement (coefficient: 0.42) and regional policies (coefficient: 0.18) had significant positive direct effects on ecological resilience, while urbanization exerted a significant negative effect (coefficient: -0.26). Although green innovation had no significant direct effect, it exhibited significant indirect influence, with the most significant pathway being green innovation→regional policy→natural environment→ecological resilience (coefficient: 0.18). This study enhances our understanding of how the natural environment, green innovation, and regional policies shape ecological resilience, providing a scientific reference for urban agglomeration development that fosters harmony between humans and nature.
OUYANG Xiao , CHEN Jian , WEI Xiao , XIE Hualin , HUANG Tuofu , CHEN Siyun . Spatiotemporal differentiation and evolutionary mechanism of ecological resilience in the middle reaches of the Yangtze River urban agglomeration[J]. Acta Geographica Sinica, 2025 , 80(6) : 1572 -1584 . DOI: 10.11821/dlxb202506009
表1 生态韧性评价指标体系Tab. 1 Ecological resilience evaluation index system |
| 子系统 | 指标 | 单位 |
|---|---|---|
| 抵抗力 | 粮食产量 | kJ |
| 生境质量 | - | |
| 碳储量 | t | |
| 土壤保持 | t | |
| 适应力 | 环境污染治理投资额 | 万元 |
| 污水集中处理率 | % | |
| 生活垃圾集中处理率 | % | |
| 空气质量良好的天数百分比 | % | |
| 恢复力 | 建成区植被覆盖率 | % |
| 土地利用优化率 | - | |
| 人均公园绿地面积 | m2/人 |
表2 指标权重Tab. 2 Indicator weights |
| 年份 | 粮食 产量 | 生境 质量 | 碳 储量 | 土壤 保持 | 环境污染 治理投资额 | 污水集中处理率 | 生活垃圾 集中处理率 | 空气质量良好的天数百分比 | 建成区植被 覆盖率 | 土地利用 优化率 | 人均公园 绿地面积 |
|---|---|---|---|---|---|---|---|---|---|---|---|
| 2000 | 0.07 | 0.07 | 0.07 | 0.10 | 0.14 | 0.12 | 0.10 | 0.09 | 0.06 | 0.10 | 0.08 |
| 2001 | 0.07 | 0.07 | 0.07 | 0.10 | 0.16 | 0.11 | 0.11 | 0.08 | 0.06 | 0.10 | 0.08 |
| 2002 | 0.07 | 0.07 | 0.07 | 0.10 | 0.21 | 0.10 | 0.08 | 0.05 | 0.06 | 0.10 | 0.09 |
| 2003 | 0.07 | 0.08 | 0.06 | 0.09 | 0.23 | 0.09 | 0.07 | 0.06 | 0.05 | 0.10 | 0.09 |
| 2004 | 0.08 | 0.08 | 0.07 | 0.09 | 0.22 | 0.09 | 0.06 | 0.07 | 0.06 | 0.11 | 0.08 |
| 2005 | 0.08 | 0.08 | 0.07 | 0.10 | 0.19 | 0.09 | 0.07 | 0.07 | 0.06 | 0.11 | 0.08 |
| 2006 | 0.08 | 0.08 | 0.07 | 0.10 | 0.19 | 0.09 | 0.05 | 0.08 | 0.07 | 0.11 | 0.08 |
| 2007 | 0.08 | 0.08 | 0.07 | 0.09 | 0.20 | 0.08 | 0.05 | 0.08 | 0.06 | 0.11 | 0.09 |
| 2008 | 0.07 | 0.08 | 0.07 | 0.10 | 0.21 | 0.07 | 0.05 | 0.10 | 0.06 | 0.11 | 0.09 |
| 2009 | 0.07 | 0.07 | 0.06 | 0.10 | 0.24 | 0.06 | 0.05 | 0.09 | 0.05 | 0.11 | 0.08 |
| 2010 | 0.07 | 0.07 | 0.06 | 0.11 | 0.25 | 0.06 | 0.06 | 0.08 | 0.05 | 0.10 | 0.08 |
| 2011 | 0.08 | 0.07 | 0.06 | 0.10 | 0.27 | 0.06 | 0.05 | 0.09 | 0.04 | 0.10 | 0.08 |
| 2012 | 0.07 | 0.07 | 0.06 | 0.10 | 0.27 | 0.04 | 0.04 | 0.08 | 0.09 | 0.10 | 0.09 |
| 2013 | 0.07 | 0.07 | 0.06 | 0.10 | 0.29 | 0.05 | 0.04 | 0.07 | 0.07 | 0.10 | 0.08 |
| 2014 | 0.07 | 0.07 | 0.06 | 0.09 | 0.28 | 0.06 | 0.04 | 0.10 | 0.05 | 0.09 | 0.08 |
| 2015 | 0.07 | 0.07 | 0.06 | 0.09 | 0.30 | 0.05 | 0.04 | 0.07 | 0.05 | 0.10 | 0.09 |
| 2016 | 0.07 | 0.07 | 0.06 | 0.11 | 0.29 | 0.05 | 0.03 | 0.08 | 0.06 | 0.10 | 0.08 |
| 2017 | 0.07 | 0.07 | 0.07 | 0.09 | 0.31 | 0.04 | 0.04 | 0.06 | 0.08 | 0.10 | 0.07 |
| 2018 | 0.07 | 0.07 | 0.07 | 0.09 | 0.31 | 0.06 | 0.03 | 0.07 | 0.08 | 0.10 | 0.07 |
| 2019 | 0.07 | 0.07 | 0.07 | 0.09 | 0.31 | 0.05 | 0.03 | 0.08 | 0.04 | 0.10 | 0.08 |
| 2020 | 0.07 | 0.07 | 0.07 | 0.10 | 0.31 | 0.04 | 0.02 | 0.05 | 0.09 | 0.10 | 0.08 |
表3 PLS-SEM模型的拟合优度检验Tab. 3 Goodness-of-fit-test for the PLS-SEM |
| 潜变量 | 观测变量 | 方差膨胀因子(VIF) | 复合可靠性(CR) | 平均方差提取(AVE) |
|---|---|---|---|---|
| 自然环境 | 高程 | 1.40 | 0.75 | 0.80 |
| 坡度 | 1.34 | |||
| 年均气温 | 2.11 | |||
| 年均降水 | 2.18 | |||
| 城市化 | 土地城市化 | 1.64 | 0.82 | 0.72 |
| 经济城市化 | 2.16 | |||
| 人口城市化 | 1.74 | |||
| 绿色创新 | 产业转型 | 1.10 | 0.66 | 0.64 |
| 科研创新 | 1.10 | |||
| 区域政策 | 空间一体化 | 1.45 | 0.95 | 0.76 |
| 经济一体化 | 1.45 |
| [1] |
[刘彦随. 现代人地关系与人地系统科学. 地理科学, 2020, 40(8): 1221-1234.]
|
| [2] |
|
| [3] |
|
| [4] |
[方创琳, 周成虎, 顾朝林, 等. 特大城市群地区城镇化与生态环境交互耦合效应解析的理论框架及技术路径. 地理学报, 2016, 71(4): 531-550.]
|
| [5] |
|
| [6] |
|
| [7] |
|
| [8] |
|
| [9] |
|
| [10] |
|
| [11] |
[王少剑, 崔子恬, 林靖杰, 等. 珠三角地区城镇化与生态韧性的耦合协调研究. 地理学报, 2021, 76(4): 973-991.]
|
| [12] |
|
| [13] |
[杨新军, 石育中, 王子侨. 道路建设对秦岭山区社会—生态系统的影响: 一个社区恢复力的视角. 地理学报, 2015, 70(8): 1313-1326.]
|
| [14] |
[侯彩霞, 周立华, 文岩. 生态政策下草原社会—生态系统恢复力评价: 以宁夏盐池县为例. 中国人口·资源与环境, 2018, 28(8): 117-126.]
|
| [15] |
[方创琳. 新发展格局下的中国城市群与都市圈建设. 经济地理, 2021, 41(4): 1-7.]
|
| [16] |
|
| [17] |
[朱政, 朱翔, 李霜霜. 长江中游城市群空间结构演变历程与特征. 地理学报, 2021, 76(4): 799-817.]
|
| [18] |
[欧阳晓, 朱翔, 贺清云. 城市化与生态系统服务的空间交互关系研究: 以长株潭城市群为例. 生态学报, 2019, 39(20): 7502-7513.]
|
| [19] |
|
| [20] |
|
| [21] |
|
| [22] |
|
| [23] |
[欧阳晓, 贺清云, 朱翔. 多情景下模拟城市群土地利用变化对生态系统服务价值的影响: 以长株潭城市群为例. 经济地理, 2020, 40(1): 93-102.]
|
| [24] |
|
| [25] |
|
| [26] |
|
| [27] |
|
| [28] |
|
| [29] |
[张玉, 魏华波. 基于CRITIC的多属性决策组合赋权方法. 统计与决策, 2012, 28(16): 75-77.]
|
| [30] |
[刘松林, 王坦, 戚琳琳. 基于客观组合赋权的就业质量测度与评价. 统计与决策, 2023, 39(20): 168-173.]
|
| [31] |
|
| [32] |
|
| [33] |
|
| [34] |
|
| [35] |
|
| [36] |
|
| [37] |
|
| [38] |
|
| [39] |
[曾冰, 张艳, 胡亚光. 基于交通可达性与城市竞争力的城市腹地范围识别: 以长江中游城市群为例. 热带地理, 2020, 40(1): 119-127.]
|
| [40] |
|
| [41] |
|
| [42] |
|
/
| 〈 |
|
〉 |