
A fine-scale vegetation identification method on the Qinghai-Xizang Plateau incorporating coarse spatial resolution vegetation and environmental features using remote sensing
Received date: 2024-04-09
Revised date: 2024-09-17
Online published: 2025-01-21
Supported by
The Second Tibetan Plateau Scientific Expedition and Research(2019QZKK0606)
Major Program of National Natural Science Foundation of China(42192580)
Major Program of National Natural Science Foundation of China(42192581)
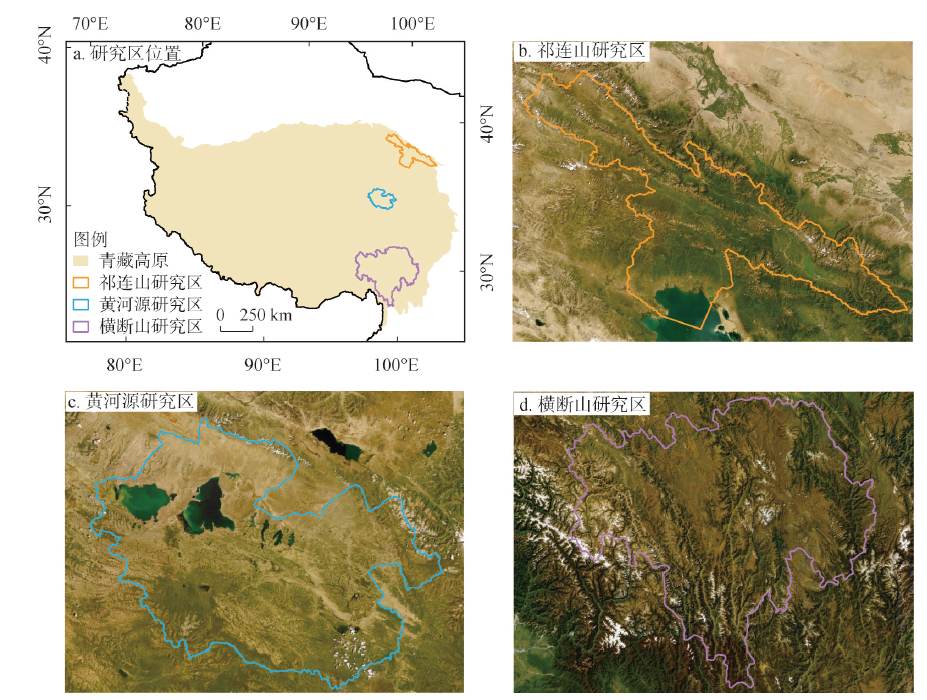
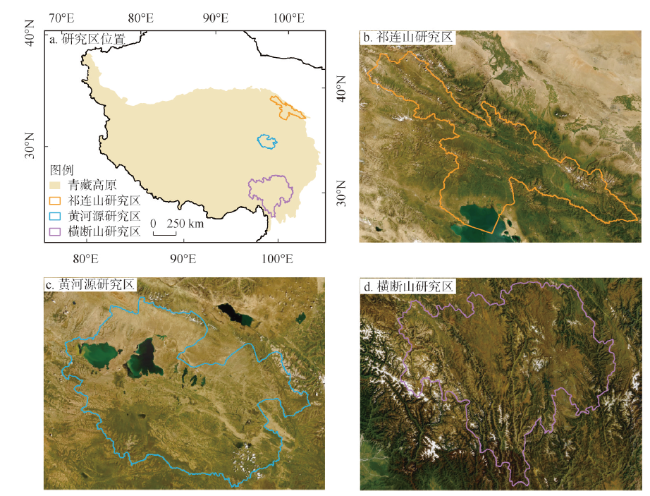
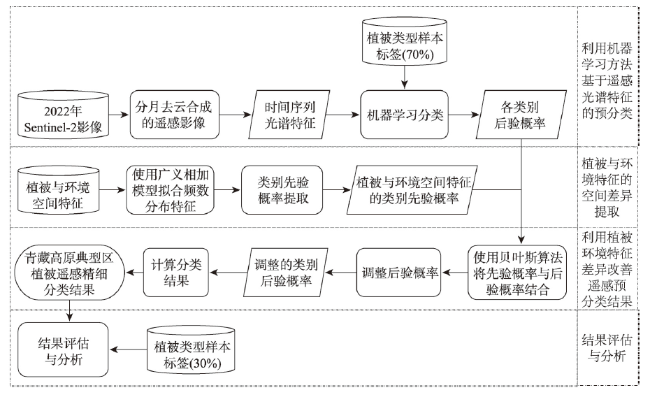
Vegetation on the Qinghai-Xizang Plateau exhibits high-altitude and vertical zonation distribution characteristics, which pose significant challenges for fine-scale vegetation classification based on remote sensing. A major issue is the limited separability of remote sensing features among certain vegetation types, necessitating the effective integration of additional non-remote sensing features to improve separability. To address this problem, the present study developed a novel method for fine-scale vegetation remote sensing classification by progressively incorporating coarse spatial resolution vegetation and environmental features. This approach aims to improve both the accuracy and precision of classification. The new method comprises three primary components. First, vegetation and environmental features that substantially enhance vegetation classification and exhibit distinct feature differences are selected. These features are then used to calculate the prior probabilities for each class through a generalized additive model. Concurrently, machine learning classification with remote sensing features is employed to obtain the posterior probabilities for each class. Finally, by applying the Bayesian algorithm, the prior probabilities derived from coarse spatial resolution data are employed to adjust the posterior probabilities obtained from high spatial resolution data, resulting in refined classification outcomes. The method was rigorously tested and applied to the Qilian Mountains, Yellow River Source Area, and Hengduan Mountains on the Qinghai-Xizang Plateau. Sentinel-2 remote sensing data with a spatial resolution of 10 m, vegetation and environmental data with spatial resolutions ranging from 90 m to 10000 m, and ground survey data were utilized. The fine-scale vegetation classification results with a spatial resolution of 10 m were achieved. Compared to using only remote sensing features, the new method improved classification accuracy by 8% to 24%. This new classification method provides effective technical support for improving the accuracy and precision of vegetation classification and offers significant reference value for fine-scale vegetation classification on the Qinghai-Xizang Plateau and similar regions.
ZHANG Hui , ZHU Wenquan , SHI Peijun , TANG Haiping , HE Bangke , LIU Ruoyang , YANG Xinyi , ZHAO Cenliang . A fine-scale vegetation identification method on the Qinghai-Xizang Plateau incorporating coarse spatial resolution vegetation and environmental features using remote sensing[J]. Acta Geographica Sinica, 2025 , 80(1) : 12 -27 . DOI: 10.11821/dlxb202501002
表1 参与青藏高原植被精细分类的植被与环境特征Tab. 1 Vegetation and environmental features used in fine-scale vegetation classification on the Qinghai-Xizang Plateau |
| 数据 | 特征 | 数据源 | 空间分辨率 | 文献 |
|---|---|---|---|---|
| 数字高程模型 | DEM | SRTM Digital Elevation Data Version 4 | 90 m | [26] |
| 土壤温度 | 第1层(0~7 cm) | ERA5_LAND/MONTHLY | 11132 m | [27] |
| 气温 | 年最低气温 | MOD11A1 | 1 km | [28] |
| 降水量 | 年总降水量 | ERA5_LAND/MONTHLY | 11132 m | [27] |
| 蒸散发 | 年总蒸散发(ET) | MOD16A2 | 500 m | [29] |
| 净初级生产力 | NPP | MOD17A3HGF | 500 m | [30] |
| 植被指数 | NDVI | MOD13Q1 | 250 m | [31] |
| 植被覆盖度 | 裸地覆盖度 | MOD44B | 250 m | [32] |
表2 用于各研究区分类和精度检验的植被类型标签样本数量和来源Tab. 2 Number and source of vegetation type label samples used for classification and accuracy validation in each study area |
| 数据源 | 样本总量(个) | 筛选后的样本标签数量(个) | |||
|---|---|---|---|---|---|
| 祁连山区 | 黄河源区 | 横断山区 | |||
| 野外实地调查数据 | 2021年课题组野外科学考察 | 357 | 105 | 32 | - |
| 2022年课题组野外科学考察 | 141 | - | - | 118 | |
| 2023年课题组野外科学考察 | 133 | - | 52 | - | |
| 青藏高原地表氧含量数据集中的植被 类型数据(2017—2022)[33] | 686 | 37 | 13 | 9 | |
| 祁连县地区第二次青藏高原综合科学 考察植被样方调查照片(2020)[34] | 28 | 26 | |||
| 黄河源区—土地覆盖及植被类型地面 验证点数据集(2018)[35] | 41 | 36 | |||
| 基于2022年Google Earth高分辨率遥感影像的目视解译 | 262 | 91 | 79 | 92 | |
| 合计 | 1648 | 259 | 212 | 219 | |
表3 各研究区基于不同机器学习分类方法的分类精度对比Tab. 3 Comparison of classification accuracy based on different machine learning classification methods in each study area |
| 研究区 | 随机森林 | 支持向量机 | 分类与回归树 | |||||
|---|---|---|---|---|---|---|---|---|
| 总体精度(%) | Kappa系数 | 总体精度(%) | Kappa系数 | 总体精度(%) | Kappa系数 | |||
| 祁连山区 | 72 | 0.66 | 68 | 0.63 | 52 | 0.50 | ||
| 黄河源区 | 75 | 0.68 | 62 | 0.51 | 64 | 0.54 | ||
| 横断山区 | 65 | 0.66 | 60 | 0.44 | 62 | 0.52 | ||
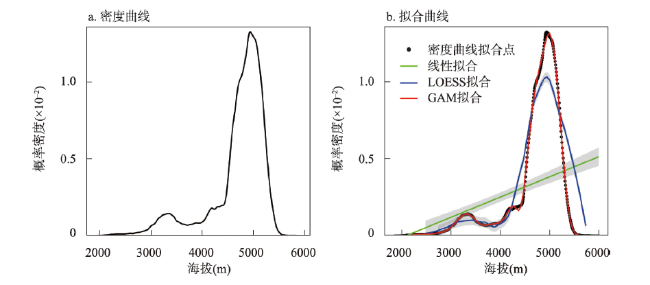
图4 青藏高原草原类型随DEM特征变化的密度曲线图及其拟合曲线对比Fig. 4 Comparison of fitting curves of grassland types changing with DEM with their density curves on the Qinghai-Xizang Plateau |
表4 青藏高原各主要植被类型在青藏高原分布的面积占比Tab. 4 The proportion of area of each major vegetation type on the Qinghai-Xizang Plateau |
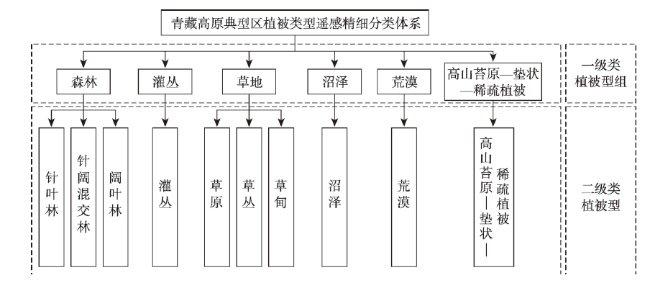
| 植被类型 | 针叶林 | 针阔混交林 | 阔叶林 | 灌丛 | 草原 | 草丛 | 草甸 | 沼泽 | 荒漠 | 高山苔原—垫状—稀疏植被 |
|---|---|---|---|---|---|---|---|---|---|---|
| 面积占比(%) | 6.9 | 1.4 | 2.1 | 11.9 | 26.0 | 0.1 | 31.5 | 0.3 | 12.0 | 7.9 |
表5 植被与环境特征参与植被遥感分类的精度改善对比Tab. 5 Comparison of accuracy improvement in vegetation remote sensing classification involving vegetation and environmental features |
| 分类特征 | 各类别精度评价 | 总体精度评价 | |||||||||
|---|---|---|---|---|---|---|---|---|---|---|---|
| 针叶林 | 阔叶林 | 灌丛 | 草原 | 草甸 | 沼泽 | 高山苔原—垫状—稀疏植被 | 总体精度(%) | Kappa系数 | |||
| 仅使用遥感光谱 特征的分类结果 | 用户精度(%) | 80 | 30 | 71 | 75 | 67 | 34 | 25 | 69 | 0.62 | |
| 生产精度(%) | 56 | 100 | 47 | 67 | 80 | 100 | 75 | ||||
| 引入单一 植被与 环境特征 改善后的 分类结果 | DEM | 用户精度(%) | 89 | 50 | 85 | 85 | 77 | 80 | 100 | 81 | 0.77 |
| 生产精度(%) | 86 | 67 | 92 | 90 | 92 | 75 | 50 | ||||
| 土壤温度 | 用户精度(%) | 89 | 43 | 100 | 69 | 60 | 30 | 75 | 70 | 0.68 | |
| 生产精度(%) | 72 | 100 | 62 | 90 | 90 | 56 | 50 | ||||
| 年最低气温 | 用户精度(%) | 100 | 50 | 100 | 73 | 60 | 34 | 100 | 76 | 0.74 | |
| 生产精度(%) | 78 | 100 | 62 | 89 | 90 | 50 | 50 | ||||
| 年总降水量 | 用户精度(%) | 89 | 50 | 80 | 80 | 100 | 50 | 75 | 80 | 0.77 | |
| 生产精度(%) | 80 | 67 | 73 | 83 | 83 | 75 | 50 | ||||
| 年总蒸散发 | 用户精度(%) | 100 | 55 | 88 | 73 | 67 | 34 | 75 | 73 | 0.69 | |
| 生产精度(%) | 72 | 100 | 62 | 89 | 100 | 76 | 50 | ||||
| 归一化植被指数 | 用户精度(%) | 100 | 60 | 100 | 75 | 83 | 50 | 100 | 82 | 0.80 | |
| 生产精度(%) | 70 | 100 | 80 | 100 | 100 | 100 | 50 | ||||
| 净初级生产力 | 用户精度(%) | 100 | 40 | 100 | 81 | 89 | 50 | 100 | 85 | 0.86 | |
| 生产精度(%) | 78 | 100 | 69 | 100 | 100 | 100 | 100 | ||||
| 裸地覆盖度 | 用户精度(%) | 100 | 75 | 85 | 75 | 69 | 50 | 75 | 75 | 0.71 | |
| 生产精度(%) | 72 | 50 | 67 | 75 | 83 | 75 | 100 | ||||
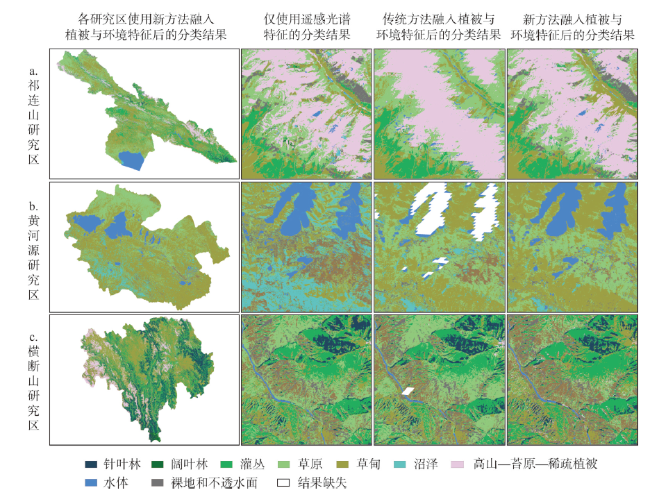
图6 各研究区使用两种不同的植被与环境特征融入方式的分类结果对比注:图中第1列展示了研究区整体的分类结果,第2~4列为局部区域的分类结果对比图。 Fig. 6 Comparison of classification results using two different methods of integrating vegetation and environmental features in each study area |
表6 各研究区融入植被与环境特征前后的植被精细分类精度对比Tab. 6 Comparison of fine-scale vegetation classification accuracy in each study area before and after incorporating vegetation and environmental features |
| 研究区 | 分类方法 | 各类别精度评价 | 总体精度评价 | |||||||||
|---|---|---|---|---|---|---|---|---|---|---|---|---|
| 针叶林 | 阔叶林 | 灌丛 | 草原 | 草甸 | 沼泽 | 荒漠 | 高山苔原—垫状—稀疏植被 | 总体精度(%) | Kappa系数 | |||
| 祁连山研究区 | 仅使用遥感光谱特征的分类结果 | 用户精度(%) | 100 | 36 | 69 | 75 | 89 | 50 | - | 49 | 76 | 0.71 |
| 生产精度(%) | 58 | 100 | 64 | 60 | 80 | 66 | - | 75 | ||||
| 传统方法融入植被与环境特征后的分类结果 | 用户精度(%) | 100 | 100 | 55 | 46 | 75 | 88 | - | 100 | 70 | 0.64 | |
| 生产精度(%) | 80 | 50 | 89 | 75 | 53 | 53 | - | 75 | ||||
| 新方法融入植被与环境特征后的分类结果 | 用户精度(%) | 100 | 100 | 63 | 88 | 92 | 76 | - | 94 | 84 | 0.81 | |
| 生产精度(%) | 92 | 75 | 94 | 80 | 96 | 72 | - | 60 | ||||
| 黄河源研究区 | 仅使用遥感光谱特征的分类结果 | 用户精度(%) | - | - | - | 58 | 52 | 27 | 48 | - | 62 | 0.55 |
| 生产精度(%) | - | - | - | 61 | 40 | 76 | 60 | - | ||||
| 传统方法融入植被与环境特征后的分类结果 | 用户精度(%) | - | - | - | 54 | 86 | 83 | 100 | 76 | 0.67 | ||
| 生产精度(%) | - | - | - | 88 | 80 | 71 | 57 | |||||
| 融入植被与环境特征改善后的分类结果 | 用户精度(%) | - | - | - | 65 | 91 | 100 | 100 | - | 86 | 0.83 | |
| 生产精度(%) | - | - | - | 100 | 80 | 86 | 75 | - | ||||
| 横断山研究区 | 仅使用遥感光谱特征的分类结果 | 用户精度(%) | 57 | 100 | 68 | 41 | 83 | 60 | 100 | 78 | 68 | 0.63 |
| 生产精度(%) | 80 | 17 | 83 | 56 | 65 | 75 | 43 | 66 | ||||
| 传统方法融入植被与环境特征后的分类结果 | 用户精度(%) | 63 | 100 | 90 | 25 | 74 | 100 | 80 | 60 | 71 | 0.67 | |
| 生产精度(%) | 90 | 100 | 60 | 20 | 93 | 25 | 67 | 75 | ||||
| 融入植被与环境特征改善后的 分类结果 | 用户精度(%) | 83 | 100 | 67 | 83 | 78 | 100 | 100 | 89 | 78 | 0.76 | |
| 生产精度(%) | 84 | 92 | 89 | 59 | 86 | 75 | 93 | 62 | ||||
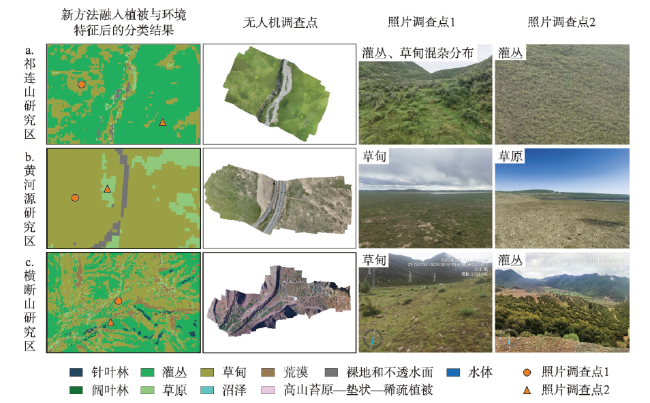
图7 各研究区使用新方法融入植被与环境特征后的分类结果与实地调查对比图Fig. 7 Comparison between classification results after incorporating vegetation and environmental features using the new method and ground truth surveys in each study area |
| [1] |
|
| [2] |
|
| [3] |
[冯松, 汤懋苍, 王冬梅. 青藏高原是我国气候变化启动区的新证据. 科学通报, 1998, 43(6): 633-636.]
|
| [4] |
[姚檀栋, 刘晓东, 王宁练. 青藏高原地区的气候变化幅度问题. 科学通报, 2000, 45(1): 98-106.]
|
| [5] |
|
| [6] |
[柳艳香. 青藏高原地气系统辐射收支变化特征及其与气候变化的关系. 高原气象, 1998, 17(3): 37-44.]
|
| [7] |
|
| [8] |
|
| [9] |
[史培军, 胡小康, 陈彦强, 等. 青藏高原地表大气氧含量空间格局及自然地带“三维分异”的新认识. 地理学报, 2023, 78(3): 532-547.]
|
| [10] |
[马克平, 郭庆华. 中国植被生态学研究的进展和趋势. 中国科学: 生命科学, 2021, 51(3): 215-218.]
|
| [11] |
|
| [12] |
|
| [13] |
[姚喜喜, 宫旭胤, 白滨, 等. 祁连山高寒牧区不同类型草地植被特征与土壤养分及其相关性研究. 草地学报, 2018, 26(2): 371-379.]
|
| [14] |
[明義森, 刘启航, 柏荷, 等. 利用光学和SAR遥感数据的若尔盖湿地植被分类与变化监测. 遥感学报, 2023, 27(6): 1414-1425.]
|
| [15] |
[张慧, 赵涔良, 朱文泉. 基于多源数据产品集成分类制作的青藏高原现状植被图. 北京师范大学学报(自然科学版), 2021, 57(6): 816-824.]
|
| [16] |
[欧阳淑冰, 陈伟涛, 李显巨, 等. 植被覆盖区高精度遥感地貌场景分类数据集. 遥感学报, 2022, 26(4): 606-619.]
|
| [17] |
[张锦涛. 青藏高原典型高寒退化草地植被特征与环境因子的影响探究[D]. 太原: 山西师范大学, 2022.]
|
| [18] |
|
| [19] |
|
| [20] |
[贾伟, 高小红, 杨灵玉, 等. 面向对象方法的复杂地形区地表覆盖信息提取. 兰州大学学报(自然科学版), 2018, 54(4): 486-493.]
|
| [21] |
|
| [22] |
|
| [23] |
|
| [24] |
[张新时. 中国植被图集(1∶1000000). 北京: 地质出版社, 2007.]
|
| [25] |
[张慧, 朱文泉, 史培军, 等. 青藏高原各主要植被类型的特征及环境差异研究. 生态学报, 2024, 44(7): 2955-2970.]
|
| [26] |
|
| [27] |
|
| [28] |
|
| [29] |
|
| [30] |
|
| [31] |
|
| [32] |
|
| [33] |
[史培军. 青藏高原地表氧含量数据(2017—2022). 国家青藏高原科学数据中心, 2022. DOI: 10.11888/Atmos.tpdc.272423.]
|
| [34] |
[尚占环. 祁连县地区第二次青藏高原综合科学考察植被样方调查照片(2020). 北京: 国家青藏高原科学数据中心, 2021. DOI:10.11888/Ecolo.tpdc.271439.]
|
| [35] |
[魏彦强, 王旭峰. 黄河源区土地覆盖及植被类型地面验证点数据集. 北京: 国家青藏高原科学数据中心, 2019.]
|
| [36] |
|
| [37] |
|
| [38] |
|
| [39] |
[郑景云, 尹云鹤, 李炳元. 中国气候区划新方案. 地理学报, 2010, 65(1): 3-12.]
|
/
| 〈 |
|
〉 |