
Co-agglomeration and spatial follow-up of high-tech industries in Shenzhen
Received date: 2023-12-18
Revised date: 2024-08-27
Online published: 2024-10-25
Supported by
Key Project of Key Humanities and Social Science Research Bases of China's Ministry of Education(22JJD790088)
Fundamental Research Funds for the Central Universities(23JNZK06)
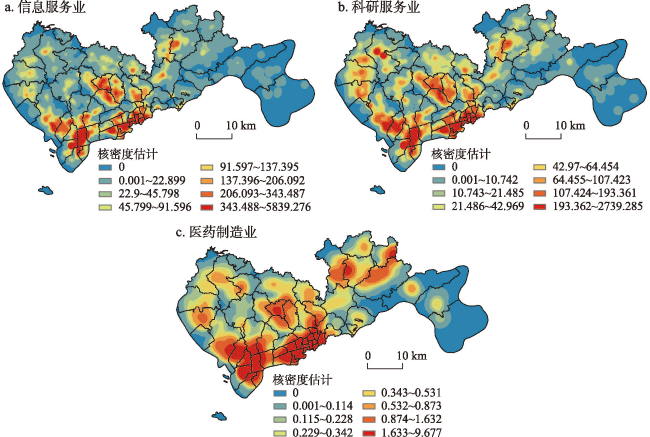
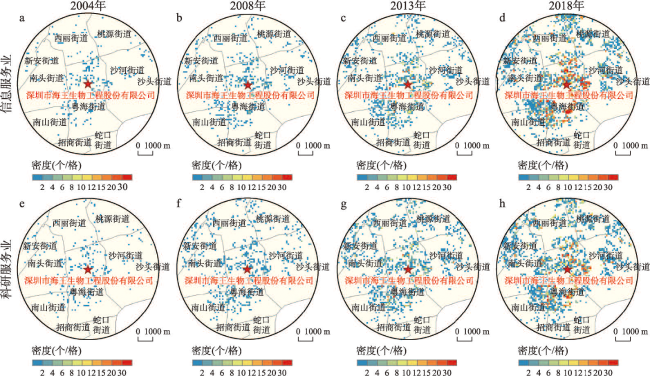
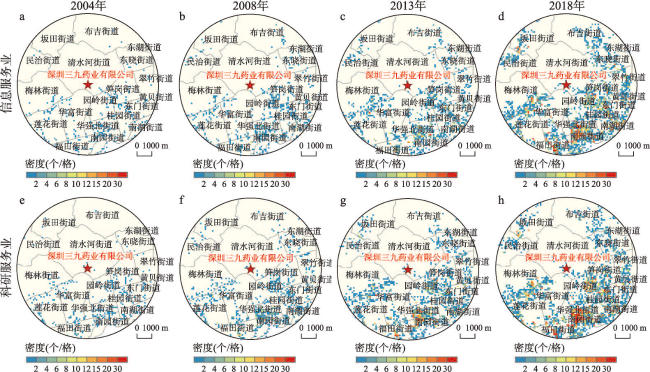
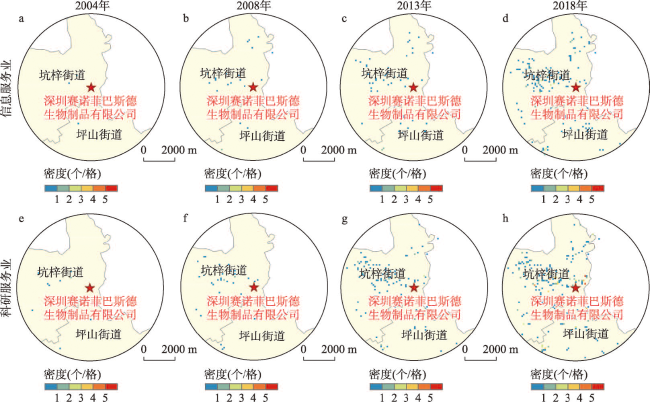
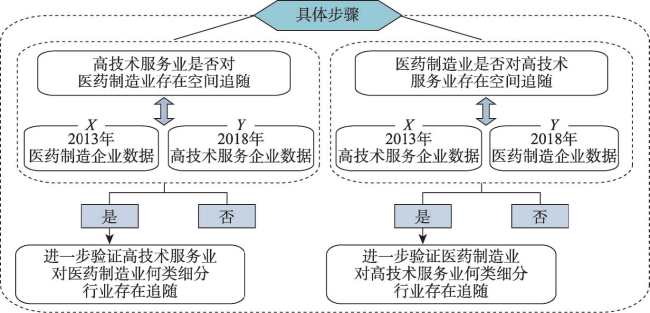
Leveraging economic census data and enterprise Point of Interest (POI) data, this study conducts an in-depth examination of co-agglomeration in Shenzhen, southern China. First, we examine the characteristics of co-agglomeration between Shenzhen's high-tech manufacturing and high-tech service industries from both economic and spatial linkage dimensions. Second, a spatio-temporal analysis is conducted using the geographical detector to examine the spatial follow-up phenomenon, providing a detailed understanding of the processes and key factors underpinning the formation of co-agglomeration patterns. The findings are as follows: (1) From the perspective of economic linkage, Shenzhen's pharmaceutical manufacturing industry and high-tech service industry show a co-agglomeration relationship; (2) From the perspective of spatial linkage, pharmaceutical manufacturing enterprises and high-tech service enterprises have formed a "multi-polar + multi-center" pattern, with all three case study areas surrounding leading pharmaceutical manufacturing enterprises showing an enhanced trend of co-agglomeration with high-tech service industries; (3) From the perspective of the formation process, there is a spatial follow-up phenomenon of high-tech service industries to pharmaceutical manufacturing industries, meaning that the following behavior in enterprise layout promotes the co-agglomeration of high-tech industries. Specifically, the information service industry mainly follows the clustering of chemical drug and active pharmaceutical ingredient manufacturing, while the scientific research service industry mainly follows the clustering of medical materials and pharmaceutical product manufacturing. The spatial follow-up process provides a perspective for analyzing the spatial process of co-agglomeration formation, and the detailed spatial follow-up relationship among industries offers useful insights for policy guidance to accelerate the cultivation of high-quality industrial parks.

ZHONG Yun , LI Shuning , LI Han . Co-agglomeration and spatial follow-up of high-tech industries in Shenzhen[J]. Acta Geographica Sinica, 2024 , 79(10) : 2638 -2650 . DOI: 10.11821/dlxb202410014
表1 2004年、2008年、2013年和2018年医药制造业与高技术服务业协同集聚度Tab. 1 Co-agglomeration degree (E-G) between pharmaceutical manufacturing and high-tech service industry, 2004, 2008, 2013, and 2018 |
| 医药制造业 | ||||
|---|---|---|---|---|
| 2004 | 2008 | 2013 | 2018 | |
| 信息服务业 | 0.1793 | 0.0571 | 0.0937 | 0.0271 |
| 科研服务业 | 0.1398 | 0.0349 | 0.0316 | 0.0075 |
图1 2020年深圳信息服务企业、科研服务企业与医药制造企业核密度图Fig. 1 Kernel density of information industry, scientific research industry, and pharmaceutical industry in Shenzhen, 2020 |
图3 2004—2018年深圳南山区海王生物工程股份有限公司周边高技术产业协同集聚Fig. 3 Co-agglomeration of enterprises surrounding Neptunus Bioengineering Co., Ltd. in Nanshan district, 2004-2018 |
图4 2004—2018年深圳罗湖区三九药业有限公司周边高技术产业协同集聚Fig. 4 Co-agglomeration of enterprises surrounding Sanjiu Pharmaceutical Co., Ltd. in Luohu district, 2004-2018 |
表2 信息服务业对医药制造业的空间追随Tab. 2 Spatial follow up of the information service industry to the pharmaceutical industry |
| 信息服务业 | |
|---|---|
| q值 | 0.476761*** |
| p值 | 0.008867 |
注:***表示在置信度为99%时显著相关。 |
表3 信息服务业对医药制造业细分行业的空间追随Tab. 3 Spatial follow-up of the information service industry to sub-industries within the pharmaceutical sector |
| 化学药品原料药制造业 | 化学药品制剂制造业 | |
|---|---|---|
| q值 | 0.164772** | 0.40068** |
| p值 | 0.042961 | 0.027077 |
注:**表示在置信度为95%时显著相关。 |
表4 科研服务业对医药制造业的空间追随Tab. 4 Spatial follow-up of scientific research service industry to pharmaceutical industry |
| 科研服务业 | |
|---|---|
| q值 | 0.340361** |
| p值 | 0.043174 |
注:**表示在置信度为95%时显著相关。 |
表5 医药制造业对高技术服务业的空间追随Tab. 5 Spatial follow-up of pharmaceutical industry to high-tech service industry |
| 信息服务业 | 科研服务业 | |
|---|---|---|
| q值 | 0.169996 | 0.196842* |
| p值 | 0.233108 | 0.073467 |
注:*表示在置信度为90%时显著相关。 |
| [1] |
|
| [2] |
[钟韵, 秦嫣然. 高质量发展视角下产业协同集聚研究进展. 人文地理, 2023, 38(4): 1-8, 120.]
|
| [3] |
|
| [4] |
|
| [5] |
|
| [6] |
|
| [7] |
|
| [8] |
[陈建军, 陈菁菁. 生产性服务业与制造业的协同定位研究: 以浙江省69个城市和地区为例. 中国工业经济, 2011(6): 141-150.]
|
| [9] |
|
| [10] |
[钟韵, 赵蓓蕾, 李寒. 广州市制造业与生产性服务业协同集聚与空间相似性. 地理科学, 2021, 41(3): 437-445.]
|
| [11] |
|
| [12] |
|
| [13] |
|
| [14] |
[钟韵, 闫小培. 西方地理学界关于生产性服务业作用研究述评. 人文地理, 2005, 20(3): 12-17, 5.]
|
| [15] |
|
| [16] |
|
| [17] |
|
| [18] |
[王劲峰, 徐成东. 地理探测器: 原理与展望. 地理学报, 2017, 72(1): 116-134.]
|
| [19] |
[范剑勇. 市场一体化、地区专业化与产业集聚趋势: 兼谈对地区差距的影响. 中国社会科学, 2004(6): 39-51, 204-205.]
|
| [20] |
|
| [21] |
|
| [22] |
|
| [23] |
|
| [24] |
|
| [25] |
[李国平, 孙铁山, 卢明华. 北京高科技产业集聚过程及其影响因素. 地理学报, 2003, 58(6): 927-936.]
|
| [26] |
[王缉慈, 宋向辉, 李光宇. 北京中关村高新技术企业的集聚与扩散. 地理学报, 1996, 51(6): 481-488.]
|
| [27] |
|
| [28] |
[刘志高, 尹贻梅, 孙静. 产业集群形成的演化经济地理学研究评述. 地理科学进展, 2011, 30(6): 652-657.]
|
| [29] |
[许吉黎, 张虹鸥, 陈奕嘉, 等. 演化经济地理学的理论脉络演进与研究议题展望. 地理研究, 2023, 42(9): 2433-2550.]
|
| [30] |
|
| [31] |
[安虎森, 季赛卫. 演化经济地理学理论研究进展. 学习与实践, 2014(7): 5-19.]
|
/
| 〈 |
|
〉 |