
The impact of Chinese residents' online shopping on the physical shopping behavior
Received date: 2023-09-26
Revised date: 2024-06-30
Online published: 2024-08-06
Supported by
National Natural Science Foundation of China(42071153)
National Natural Science Foundation of China(41801149)
Key Project of Natural Sciences at Inner Mongolia Universities(NJZZ23095)
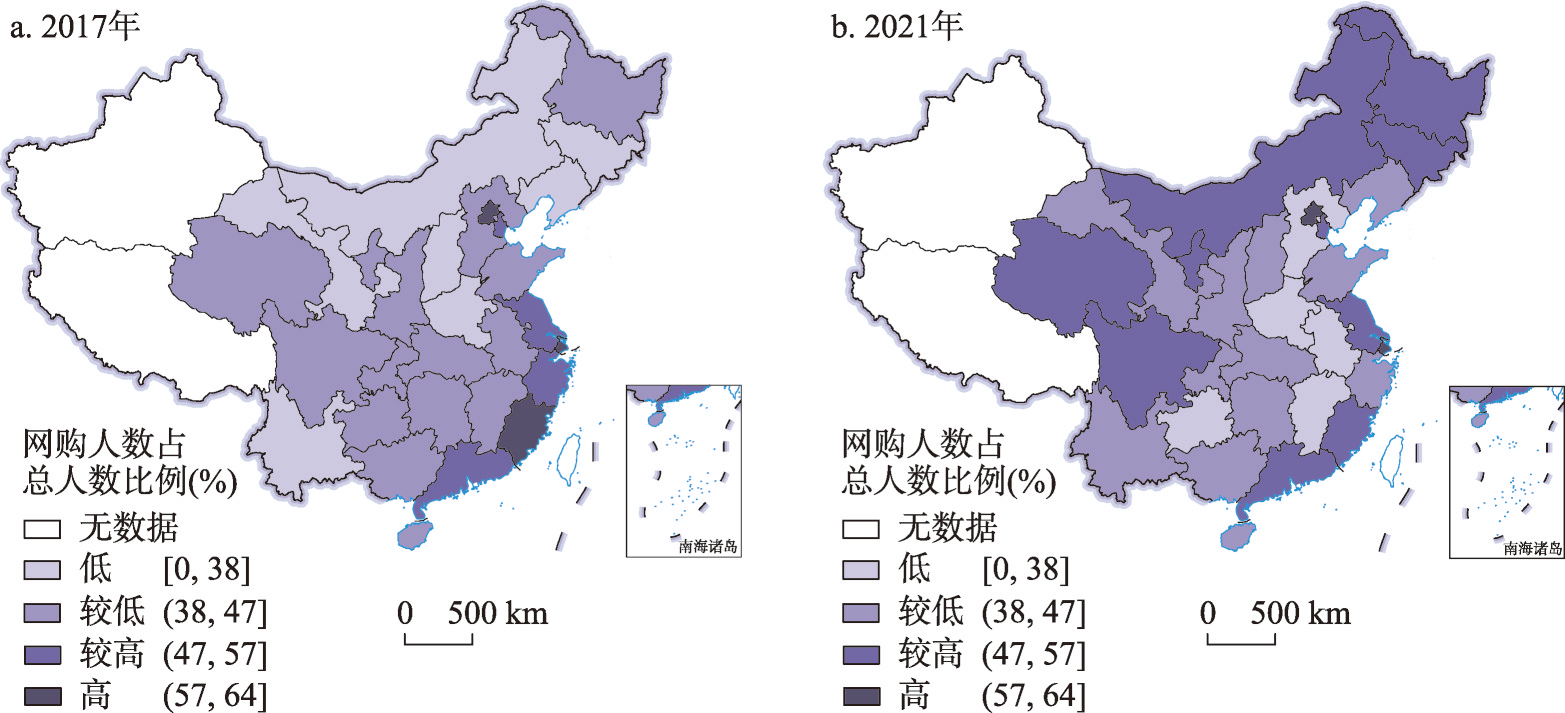
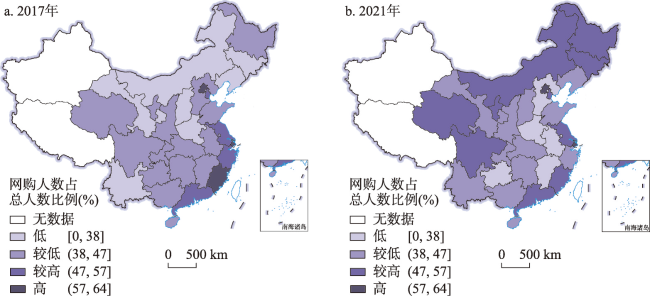
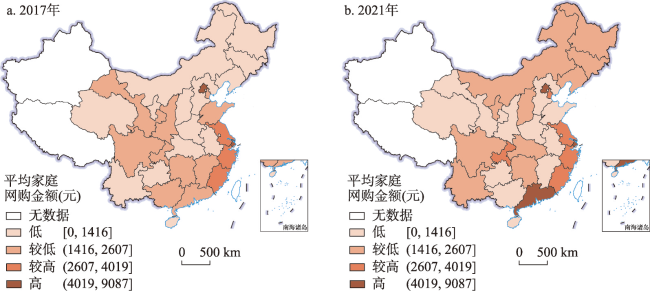
With the continuous development and application of information technology, online shopping has emerged as a significant force, bringing immense economic potential. The convenience offered by online shopping, such as the ability to shop anytime, anywhere, and access to a vast array of products, is reshaping consumer habits and expectations. Despite the continued growth of online shopping, the role of physical stores remains significant. Physical stores offer tangible benefits that online shopping often struggle to replicate. These include the ability to see, touch, and try products before purchasing, as well as the immediacy of taking items home without having to wait for shipping. The relationship between online shopping and physical shopping remains a hot topic in academia. Although there have been relevant studies in China, most of them are based on the survey data from individual communities or cities, lacking large-scale and long-term systematic research from a national perspective. Furthermore, there is a lack of heterogeneous comparisons between different regions. Drawing on large-scale time utilization survey data of 29 provincial-level regions in 2017 and 2021, this paper analyzes the spatiotemporal evolution of online shopping behavior and physical shopping behavior of China's residents, and examines the influence of online shopping on residents' physical shopping behavior. The results show that: (1) There are significant spatial differences in the characteristics of residents' online and physical shopping behaviors. The standard deviation ellipse of online shopping and physical shopping behavior shows an obvious "northeast-southwest" distribution pattern, with the gravity center gradually shifting northward during the study period. (2) In 2017, online shopping had a significant complementary effect on physical shopping. But in 2021, both complementary and neutral effects coexisted. (3) There are significant differences in the impact of online shopping on physical shopping between urban and rural residents, and residents among different regions. There is also a coexistence of complementary effects and neutral effects. This paper clarifies the relationship between online shopping and physical shopping in China, provides an in-depth understanding of the changes of urban space in the internet era, and helps promote the spatial transformation of physical commerce.
WANG Fang , HOU Jingyi , NIU Fangqu . The impact of Chinese residents' online shopping on the physical shopping behavior[J]. Acta Geographica Sinica, 2024 , 79(8) : 2083 -2096 . DOI: 10.11821/dlxb202408011
表1 样本属性统计Tab. 1 Sample attribute statistics |
| 变量 | 2017年 | 2021年 | ||||
|---|---|---|---|---|---|---|
| 数量(人) | 百分比(%) | 数量(人) | 百分比(%) | |||
| 是否实体购物(受访日当天) | 是 | 2273 | 7.59 | 936 | 5.97 | |
| 否 | 27682 | 92.41 | 14746 | 94.03 | ||
| 实体购物时间/总出行时间 (受访日当天) | 0 | 27682 | 92.41 | 14746 | 94.03 | |
| 0.01~0.20 | 410 | 1.37 | 245 | 1.56 | ||
| 0.21~0.40 | 523 | 1.75 | 257 | 1.64 | ||
| 0.41~0.60 | 341 | 1.14 | 155 | 0.99 | ||
| 0.61~0.80 | 147 | 0.49 | 61 | 0.39 | ||
| 0.81~1.00 | 852 | 2.84 | 218 | 1.39 | ||
| 是否有网购经历(受访当年) | 是 | 13258 | 44.26 | 7262 | 46.31 | |
| 否 | 16697 | 55.74 | 8420 | 53.69 | ||
| 家庭网购金额(受访当年)(元) | ≤ 500 | 21411 | 71.48 | 9957 | 63.49 | |
| 501~1000 | 1806 | 6.03 | 1339 | 8.54 | ||
| 1001~1500 | 439 | 1.47 | 266 | 1.70 | ||
| 1501~2000 | 1374 | 4.59 | 959 | 6.12 | ||
| ≥ 2001 | 4925 | 16.44 | 3161 | 20.16 | ||
| 性别 | 男 | 14615 | 48.79 | 7721 | 49.23 | |
| 女 | 15340 | 51.21 | 7961 | 50.77 | ||
| 年龄(岁) | ≤ 17 | 4229 | 14.12 | 1542 | 9.83 | |
| 18~35 | 4664 | 15.57 | 1754 | 11.18 | ||
| 36~45 | 3759 | 12.55 | 1656 | 10.56 | ||
| 46~55 | 5858 | 19.56 | 2999 | 19.12 | ||
| 56~65 | 5366 | 17.91 | 3430 | 21.87 | ||
| ≥ 66 | 6079 | 20.29 | 4301 | 27.43 | ||
| 婚姻状况 | 有配偶 | 21250 | 70.94 | 11793 | 75.20 | |
| 无配偶 | 8705 | 29.06 | 3889 | 24.8 | ||
| 受教育程度 | 小学及以下 | 12356 | 41.25 | 6345 | 40.46 | |
| 初中 | 8574 | 28.62 | 4721 | 30.1 | ||
| 高中 | 5093 | 17 | 2545 | 16.23 | ||
| 大学及以上 | 3932 | 13.13 | 2071 | 13.2 | ||
| 职业类型 | 机关事单位、企业 | 12797 | 42.72 | 5948 | 37.93 | |
| 个体工商户 | 4259 | 14.22 | 2875 | 18.33 | ||
| 务农 | 2724 | 9.09 | 650 | 4.14 | ||
| 退休 | 5519 | 18.42 | 2917 | 18.6 | ||
| 其他 | 4656 | 15.54 | 3292 | 20.99 | ||
| 家庭总收入(元) | ≤ 25000 | 7834 | 26.15 | 4846 | 30.90 | |
| 25001~50000 | 5730 | 19.13 | 2862 | 18.25 | ||
| 50001~100000 | 8375 | 27.96 | 4029 | 25.69 | ||
| ≥ 100001 | 8016 | 26.76 | 3945 | 25.16 | ||
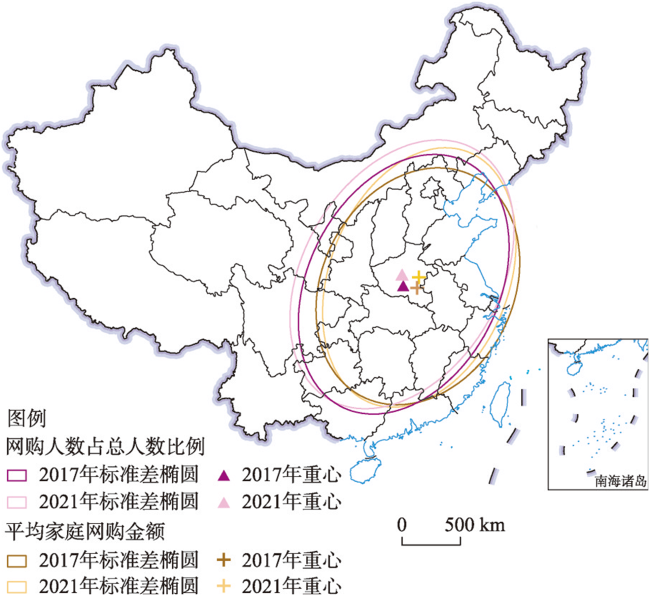
图3 中国居民网购行为标准差椭圆及其重心注:基于自然资源部标准地图服务网站审图号为GS(2019)1825号的标准地图制作,底图边界无修改。 Fig. 3 Standard deviation ellipses and gravity centers of Chinese residents' online shopping |
表2 中国居民网购行为标准差椭圆参数Tab. 2 Standard deviational ellipse parameters of Chinese residents' online shopping |
| 年份 | 重心经度(°E) | 重心纬度(°N) | 椭圆面积(万km2) | 短半轴(km) | 长半轴(km) | 旋转角(°) | |
|---|---|---|---|---|---|---|---|
| 网购人数占 总人数比例 | 2017 | 113.32 | 33.18 | 290.57 | 800.41 | 1155.60 | 26.94 |
| 2021 | 113.19 | 33.93 | 315.81 | 825.58 | 1217.72 | 30.31 | |
| 家庭网购金额 | 2017 | 114.60 | 32.99 | 262.33 | 804.00 | 1038.64 | 26.46 |
| 2021 | 114.78 | 33.64 | 268.04 | 753.24 | 1132.78 | 21.14 |
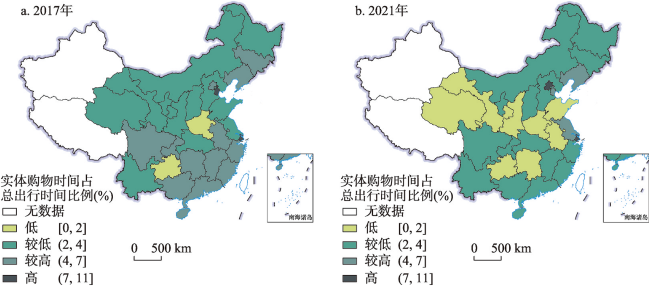
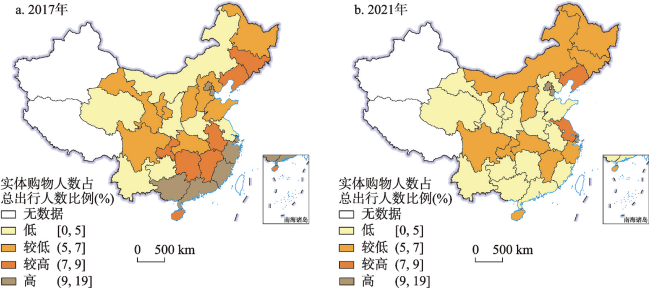
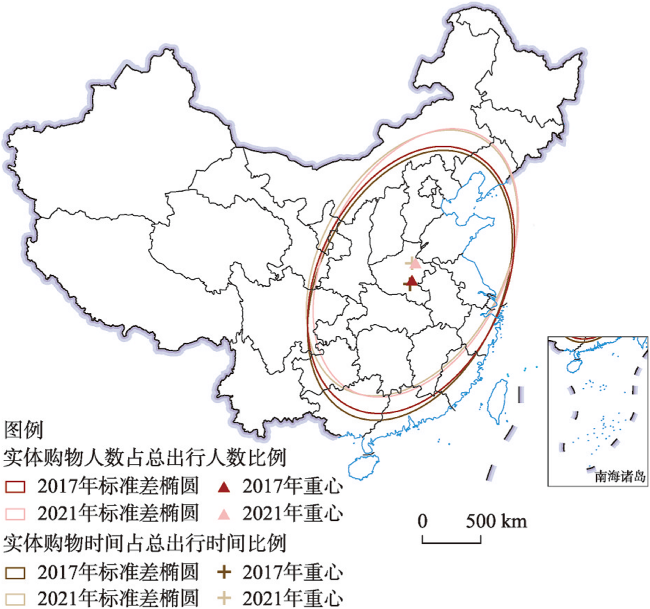
图6 中国居民实体购物行为标准差椭圆及其重心注:基于自然资源部标准地图服务网站审图号为GS(2019)1825号的标准地图制作,底图边界无修改。 Fig. 6 Standard deviation ellipses and gravity centers of Chinese residents' physical shopping |
表3 中国居民实体购物行为标准差椭圆参数Tab. 3 Standard deviational ellipse parameters of Chinese residents' physical shopping |
| 年份 | 重心经度(°E) | 重心纬度(°N) | 椭圆面积(万km2) | 短半轴(km) | 长半轴(km) | 旋转角(°) | |
|---|---|---|---|---|---|---|---|
| 实体购物人数占 总出行人数比例 | 2017 | 114.40 | 33.36 | 290.24 | 780.94 | 1183.09 | 24.98 |
| 2021 | 114.90 | 34.60 | 283.97 | 753.15 | 1200.23 | 26.23 | |
| 实体购物时间占 总出行时间比例 | 2017 | 114.28 | 32.96 | 288.24 | 766.37 | 1197.28 | 24.69 |
| 2021 | 114.55 | 34.62 | 289.31 | 768.39 | 1198.56 | 28.28 |
表4 基准回归结果Tab. 4 Benchmark regression of results |
| 2017年 | 2021年 | ||||
|---|---|---|---|---|---|
| 是否实体购物 | 实体购物时间/总出行时间 | 是否实体购物 | 实体购物时间/总出行时间 | ||
| 是否网购 | 0.202***(3.588) | 0.009***(3.626) | 0.219***(2.619) | 0.003(1.125) | |
| 性别 | 0.734***(16.054) | 0.031***(15.387) | 0.660***(9.577) | 0.018***(8.885) | |
| 年龄 | 0.059***(7.128) | 0.001***(2.599) | 0.070***(4.355) | 0.000***(6.780) | |
| 年龄平方/100 | -0.038***(-4.983) | -0.000(-1.219) | -0.039***(-2.862) | -0.000(-0.962) | |
| 婚姻状况 | 0.161**(2.128) | 0.011***(3.323) | -0.204**(-1.973) | -0.006*(-1.771) | |
| 受教育程度 | 0.208***(7.833) | 0.007***(5.061) | 0.288***(7.745) | 0.008***(6.535) | |
| 职业类型 | 0.111***(6.158) | 0.004***(4.677) | 0.133***(4.837) | 0.004***(4.119) | |
| 家庭总收入 | 0.078***(3.470) | 0.003***(4.938) | 0.072**(2.269) | 0.001(1.447) | |
| 常数项 | -6.697***(-19.771) | -0.075***(-7.082) | -6.855***(-11.400) | 0.002(0.159) | |
| 观测值 | 29955 | 29955 | 15682 | 15682 | |
| 省份虚拟变量 | YES | YES | YES | YES | |
| Pseudo R2/R2 | 0.077 | 0.033 | 0.116 | 0.030 | |
注:*、**、***分别表示在10%、5%、1%水平上显著;括号内的值是聚类到家庭层面的稳健标准误;后表同。 |
表5 网购对城乡居民实体购物的影响Tab. 5 The impact of online shopping on physical shopping of urban and rural residents |
| 变量 | 2017年 | 2021年 | |||||||||
|---|---|---|---|---|---|---|---|---|---|---|---|
| 是否实体购物 | 实体购物时间/ 总出行时间 | 是否实体购物 | 实体购物时间/ 总出行时间 | ||||||||
| 城镇 | 乡村 | 城镇 | 乡村 | 城镇 | 乡村 | 城镇 | 乡村 | ||||
| 是否网购 | 0.126** (2.125) | 0.128 (0.832) | 0.009** (2.564) | 0.004 (0.991) | 0.105 (1.172) | 0.321 (1.575) | 0.000 (0.063) | 0.002 (0.843) | |||
| 常数项 | -6.122*** (-17.140) | -7.367*** (-7.889) | -0.066*** (-5.947) | -0.031*** (-3.593) | -6.092*** (-9.194) | -7.487*** (-6.235) | -0.033*** (-2.946) | -0.018*** (-2.628) | |||
| 控制变量 | 控制 | 控制 | 控制 | 控制 | 控制 | 控制 | 控制 | 控制 | |||
| 省份虚拟变量 | YES | YES | YES | YES | YES | YES | YES | YES | |||
| 观测值 | 19702 | 10253 | 19702 | 10253 | 9042 | 6284 | 9042 | 6284 | |||
表6 网购对不同区域居民实体购物的影响Tab. 6 The impact of online shopping on physical shopping of residents in different regions of China |
| 变量 | 2017年 | 2021年 | |||||||||||||
|---|---|---|---|---|---|---|---|---|---|---|---|---|---|---|---|
| 是否实体购物 | 实体购物时间/ 总出行时间 | 是否实体购物 | 实体购物时间/ 总出行时间 | ||||||||||||
| 东部 | 中部 | 西部 | 东部 | 中部 | 西部 | 东部 | 中部 | 西部 | 东部 | 中部 | 西部 | ||||
| 是否 网购 | 0.187** (2.524) | 0.045 (0.389) | 0.397*** (3.259) | 0.010* (2.278) | 0.006 (1.455) | 0.013*** (2.977) | 0.137 (1.275) | 0.453** (2.254) | 0.195 (1.143) | 0.000 (0.089) | 0.010** (2.424) | 0.001 (0.313) | |||
| 常数项 | -6.875*** (-14.592) | -7.499*** (-12.753) | -6.340*** (-10.578) | -0.090*** (-6.870) | -0.066*** (-5.579) | -0.036*** (-2.607) | -7.710*** (-9.553) | -011.350*** (-7.101) | -5.515*** (-6.804) | -0.056*** (-4.405) | -0.037*** (-2.937) | -0.022* (-1.948) | |||
| 控制 变量 | 控制 | 控制 | 控制 | 控制 | 控制 | 控制 | 控制 | 控制 | 控制 | 控制 | 控制 | 控制 | |||
| 省份虚 拟变量 | YES | YES | YES | YES | YES | YES | YES | YES | YES | YES | YES | YES | |||
| 观测值 | 13374 | 7980 | 8601 | 13374 | 7980 | 8601 | 6740 | 3637 | 5305 | 6740 | 3637 | 5305 | |||
| [1] |
[柴彦威, 刘天宝, 塔娜. 基于个体行为的多尺度城市空间重构及规划应用研究框架. 地域研究与开发, 2013, 32(4): 1-7, 14.]
|
| [2] |
|
| [3] |
|
| [4] |
[甄峰, 魏宗财, 杨山, 等. 信息技术对城市居民出行特征的影响: 以南京为例. 地理研究, 2009, 28(5): 1307-1317.]
|
| [5] |
|
| [6] |
|
| [7] |
|
| [8] |
|
| [9] |
|
| [10] |
|
| [11] |
|
| [12] |
|
| [13] |
[张永明, 甄峰. 城市居民网络与实体购物互动模式及空间分异: 以南京为例. 经济地理, 2017, 37(1): 15-22.]
|
| [14] |
[林玥希, 汪明峰, 马同翠. 网上购物对实体零售的影响: 基于上海南方商城商业中心的调查. 世界地理研究, 2020, 29(3): 568-578.]
|
| [15] |
[王欢, 王芳, 郭梦瑶. 居民购物出行时空特征及影响因素研究: 基于中国时间利用调查. 地理研究, 2022, 41(10): 2712-2725.]
|
| [16] |
|
| [17] |
|
| [18] |
|
| [19] |
|
| [20] |
|
| [21] |
|
| [22] |
|
| [23] |
|
| [24] |
[赵媛, 杨足膺, 郝丽莎, 等. 中国石油资源流动源—汇系统空间格局特征. 地理学报, 2012, 67(4): 455-466.]
|
| [25] |
[张伊娜, 展蓉. 网络零售缩小了区域经济差距吗? 基于中国地级市数据的实证分析. 西北大学学报(哲学社会科学版), 2023, 53(6): 83-93.]
|
| [26] |
[林孔团, 于婧. 电子商务对省域经济增长影响的实证分析. 福建师范大学学报(哲学社会科学版), 2017(3): 23-31.]
|
| [27] |
[施响, 王士君, 浩飞龙, 等. 中国外卖O2O电子商务的空间扩散与渗透: 兼论技术扩散假说与效率假说的适用性. 地理研究, 2021, 40(5): 1338-1353.]
|
| [28] |
[韩会然, 杨成凤, 宋金平. 芜湖市居民购物出行空间的等级结构演变特征及驱动机制. 地理研究, 2014, 33(1): 107-118.]
|
| [29] |
[钮心毅, 康宁, 阚长城. 消费出行视角下的城市实体商业中心服务空间特征: 对上海9个商业中心的研究. 南方建筑, 2023(6): 12-20.]
|
| [30] |
[张俊英, 郭凯歌, 唐红涛. 电子商务发展、空间溢出与经济增长: 基于中国地级市的经验证据. 财经科学, 2019(3): 105-118.]
|
| [31] |
[冯健, 郑黛. 信息通讯技术对城中村女性居民活动空间的影响研究. 人文地理, 2021, 36(5): 73-82.]
|
| [32] |
[翟青, 高玉洁, 魏宗财. 南京市线上—线下餐饮空间分布格局: 以大众点评网和饿了么为例. 经济地理, 2020, 40(12): 119-127.]
|
| [33] |
[魏宗财, 刘雨飞, 彭丹丽. 疫情期潍坊市居民在线购物行为特征研究: 与疫情前的对比. 人文地理, 2022, 37(5): 53-62.]
|
/
| 〈 |
|
〉 |