
Analysis of spatial uneven development related to Northeast China based on "ternary circulation" of production
Received date: 2023-04-06
Revised date: 2023-11-24
Online published: 2024-06-19
Supported by
Major Program of National Social Science Foundation of China(21&ZD070)
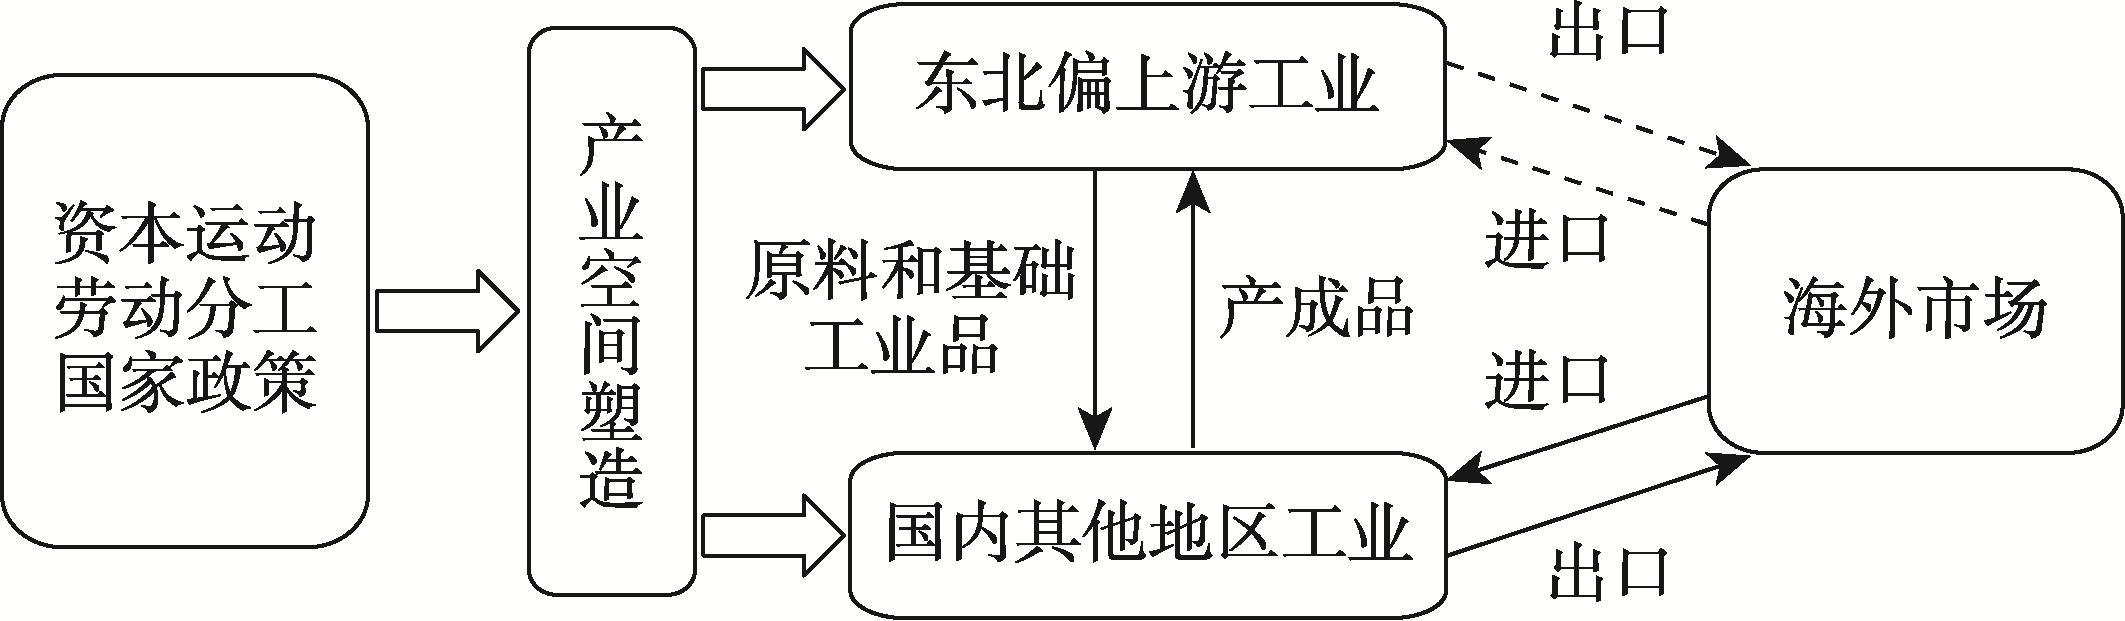
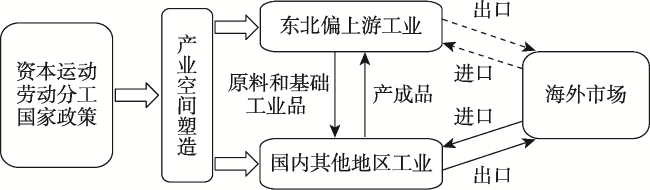
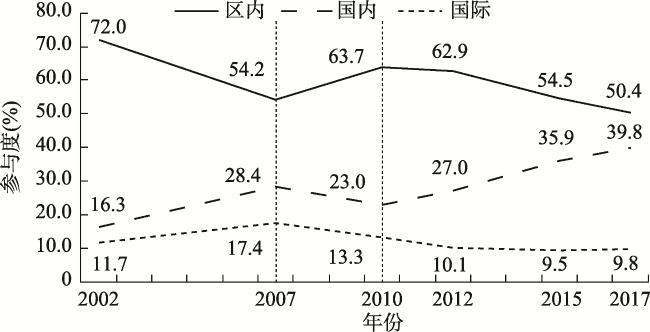
The "New Northeast China Phenomenon", marked by a sharp drop in economic growth, has gained prominence as a matter of uneven development in China since 2010. Based on theories of spatial political economy and industrial geography, this study develops a theoretical and empirical analytical framework for the causes of uneven development and the "New Northeast China Phenomenon". The study finds that: The uneven development is the result of capital movement in space, and the sharp decline in economic growth in Northeast China is closely related to spatial shifts in production networks. From 2002 to 2007, the Northeast region quickly participated in the vertical division of labor in the industrial chain of "international circulation" and "national circulation", enabling coordinated and balanced development between the Northeast region and other domestic regions. From 2007 to 2010, the Northeast region's involvement in both "international circulation" and "national circulation" was severely damaged by external demand shocks, while "regional circulation" was enhanced by government stimulus programs, sustaining high economic growth. From 2010 to 2017, the industrial chain correlation effect and trade substitution effect caused by external demand shocks began to emerge. The participation of the manufacturing industry in the Northeast region in the "ternary circulation" has decreased due to intensified competition and precipitating the "New Northeast China Phenomenon". This paper aims to offer fresh perspectives on the causal factors and empirical research strategies regarding China's uneven development, as well as policy recommendations to facilitate the Northeast region's deeper integration into the new development paradigm for economic revitalization.
XIE Fusheng , JIANG Xuanchen , SHI Baifa . Analysis of spatial uneven development related to Northeast China based on "ternary circulation" of production[J]. Acta Geographica Sinica, 2024 , 79(6) : 1464 -1477 . DOI: 10.11821/dlxb202406007
表1 两区域投入产出模型的表式Tab. 1 Dual-regional input-output models |
| 产出投入 | 中间使用 | 最终使用 | 出口 | 总产出 | ||||
|---|---|---|---|---|---|---|---|---|
| 区内 | 区外国内 | 区内 | 区外国内 | |||||
| 中间 投入 | 区内 | |||||||
| 区外国内 | ||||||||
| 进口 | ||||||||
| 增加值 | ||||||||
| 总投入 | ||||||||
表2 2002—2017年中国四大区域生产“三循环”参与度演变趋势比较Tab. 2 Comparison of the trend of China's four regions' participation in the "ternary circulation", 2002-2017 |
| 区域 | 循环 | 2002年(%) | 趋势 | 2007年(%) | 趋势 | 2010年(%) | 趋势 | 2017年(%) |
|---|---|---|---|---|---|---|---|---|
| 东北 | 区内 | 72.0 | ↓ | 54.2 | ↑ | 63.7 | ↓ | 50.4 |
| 国内 | 16.2 | ↑ | 28.4 | ↓ | 23.0 | ↑ | 39.8 | |
| 国际 | 11.7 | ↑ | 17.4 | ↓ | 13.3 | ↓ | 9.8 | |
| 东部 | 区内 | 65.9 | ↓ | 55.2 | ↑ | 60.0 | ↓ | 59.7 |
| 国内 | 9.4 | ↑ | 15.3 | ↓ | 14.6 | ↑ | 18.9 | |
| 国际 | 24.7 | ↑ | 29.6 | ↓ | 25.5 | ↓ | 21.4 | |
| 中部 | 区内 | 75.7 | ↓ | 67.1 | ↓ | 63.3 | ↑ | 64.3 |
| 国内 | 17.4 | ↑ | 22.3 | ↑ | 25.6 | ↑ | 26.9 | |
| 国际 | 7.0 | ↑ | 10.6 | ↑ | 11.1 | ↓ | 8.8 | |
| 西部 | 区内 | 80.9 | ↓ | 56.0 | ↑ | 63.5 | ↑ | 64.4 |
| 国内 | 12.6 | ↑ | 29.4 | ↓ | 25.5 | ↑ | 26.9 | |
| 国际 | 6.5 | ↑ | 14.6 | ↓ | 10.9 | ↓ | 8.7 |
表3 2002—2017年东北地区分行业生产“三循环”参与度(%)Tab. 3 Northeast China's participation in the "ternary circulation" by sector, 2002-2017 (%) |
| 2002年 | 2007年 | 2010年 | 2017年 | ||||||||||||||||
|---|---|---|---|---|---|---|---|---|---|---|---|---|---|---|---|---|---|---|---|
| 区内 | 国内 | 国际 | 合计 | 区内 | 国内 | 国际 | 合计 | 区内 | 国内 | 国际 | 合计 | 区内 | 国内 | 国际 | 合计 | ||||
| 农业 | 11.4 | 0.8 | 1.0 | 13.1 | 8.7 | 3.0 | 0.8 | 12.5 | 7.8 | 2.7 | 0.7 | 11.2 | 9.4 | 1.7 | 0.3 | 11.4 | |||
| 采选业 | 10.3 | 0.5 | 0.8 | 11.5 | 3.5 | 4.9 | 2.7 | 11.1 | 7.2 | 2.2 | 0.9 | 10.3 | 2.6 | 2.1 | 0.8 | 5.5 | |||
| 食品制造及烟草加工业 | 1.7 | 0.8 | 0.7 | 3.2 | 0.7 | 1.7 | 0.7 | 3.2 | 0.7 | 2.4 | 0.7 | 3.9 | 0 | 2.6 | 0.4 | 3.0 | |||
| 纺织服装业 | 0.3 | 0 | 1.0 | 1.3 | 0 | 0 | 1.2 | 1.2 | 0 | 0.1 | 0.8 | 1.0 | 0 | 0.1 | 0.2 | 0.3 | |||
| 木材加工及家具制造业 | 0.6 | 0.1 | 0.3 | 1.1 | 0 | 0.4 | 0.5 | 0.9 | 0.3 | 0.2 | 0.3 | 0.9 | 0 | 0.4 | 0.2 | 0.6 | |||
| 造纸印刷及文教用品制造业 | 0.9 | 0.1 | 0.1 | 1.0 | 0.3 | 0.1 | 0.1 | 0.5 | 0.3 | 0 | 0.1 | 0.4 | 0.1 | 0.1 | 0.1 | 0.2 | |||
| 化学工业 | 1.0 | 3.6 | 2.0 | 6.6 | 0 | 4.9 | 3.3 | 8.2 | 1.5 | 4.9 | 1.7 | 8.1 | 1.3 | 3.7 | 1.3 | 6.4 | |||
| 非金属矿物制品业 | 0 | 0 | 0.2 | 0.2 | 0.7 | 0.6 | 0.3 | 1.7 | 0.8 | 0.7 | 0.3 | 1.8 | 0.5 | 0.8 | 0.2 | 1.4 | |||
| 金属冶炼及制品业 | 1.4 | 2.5 | 1.3 | 5.1 | 0.2 | 1.9 | 2.4 | 4.6 | 3.8 | 0.7 | 1.1 | 5.5 | 0.8 | 1.3 | 1.1 | 3.2 | |||
| 机械工业 | 1.7 | 1.0 | 0.5 | 3.3 | 2.1 | 0.7 | 0.8 | 3.6 | 2.1 | 1.1 | 0.8 | 4.0 | 0.5 | 0.3 | 0.4 | 1.3 | |||
| 交通运输设备制造业 | 0.3 | 2.3 | 0.6 | 3.2 | 0.6 | 3.1 | 1.3 | 5.1 | 0.5 | 3.3 | 1.0 | 4.7 | 0.4 | 3.5 | 0.7 | 4.6 | |||
| 电气机械及电子通信设备制造业 | 0.3 | 0.1 | 1.4 | 1.8 | 0.4 | 0.2 | 0.9 | 1.4 | 0.9 | 0.2 | 0.8 | 1.9 | 0.1 | 0.2 | 0.5 | 0.8 | |||
| 其他制造业 | 0.5 | 0.1 | 0.5 | 1.1 | 1.6 | 0.1 | 0.2 | 1.9 | 0 | 0 | 0.4 | 0.4 | 0.1 | 0 | 0.1 | 0.2 | |||
| 电力蒸气热水、煤气自来水生产供应业 | 4.1 | 0 | 0 | 4.1 | 0.2 | 2.3 | 0.6 | 3.1 | 1.9 | 0.5 | 0.1 | 2.5 | 1.5 | 1.0 | 0.2 | 2.8 | |||
| 建筑业 | 5.1 | 0.1 | 0 | 5.1 | 2.6 | 2.9 | 0.1 | 5.5 | 5.5 | 0.3 | 0.1 | 6.0 | 0.1 | 0 | 0 | 0.1 | |||
| 商业、运输业 | 11.7 | 1.6 | 1.1 | 14.3 | 10.8 | 1.0 | 1.2 | 13.1 | 10.0 | 1.4 | 2.4 | 13.8 | 9.2 | 7.8 | 1.4 | 18.4 | |||
| 其他服务业 | 20.9 | 2.5 | 0.4 | 23.9 | 21.5 | 0.6 | 0.3 | 22.4 | 20.2 | 2.2 | 1.1 | 23.5 | 23.7 | 14.3 | 1.9 | 39.9 | |||
| 制造业合计 | 8.7 | 10.7 | 8.5 | 27.9 | 6.8 | 13.8 | 11.7 | 32.2 | 11.1 | 13.7 | 8.0 | 32.7 | 3.9 | 12.9 | 5.1 | 21.9 | |||
| 合计 | 72.0 | 16.3 | 11.7 | 100 | 54.2 | 28.4 | 17.4 | 100 | 63.7 | 23.0 | 13.3 | 100 | 50.4 | 39.8 | 9.8 | 100 | |||
表4 2002—2017年东北地区和国内其他地区的贸易相似度指数及垂直专业化指数Tab. 4 Trade similarity index and national vertical specialization index between the Northeast region and the other regions of China, 2002-2007 |
| 2002年 | 2007年 | 2010年 | 2012年 | 2015年 | 2017年 | |
|---|---|---|---|---|---|---|
| TSIsr(%) | 51.9 | 53.4 | 58.5 | 55.0 | 72.3 | 78.1 |
| NVSIr(%) | 7.8 | 11.4 | 7.5 | 7.5 | 9.1 | 7.0 |
| [1] |
[杨荫凯, 刘羽. 东北地区全面振兴的新特点与推进策略. 区域经济评论, 2016(5): 85-93.]
|
| [2] |
[樊杰, 刘汉初, 王亚飞, 等. 东北现象再解析和东北振兴预判研究: 对影响国土空间开发保护格局变化稳定因素的初探. 地理科学, 2016, 36(10): 1445-1456.]
|
| [3] |
[周建平. 绸缪东北:新一轮东北振兴. 重庆: 重庆大学出版社, 2018: 32.]
|
| [4] |
[孙久文. 区域经济前沿. 北京: 中国人民大学出版社, 2020: 197-198.]
|
| [5] |
[刘晓光, 时英. 东北应走出“单一经济结构困局”. 宏观经济管理, 2016(6): 46-50.]
|
| [6] |
[赵儒煜, 肖茜文. 东北地区现代产业体系建设与全面振兴. 经济纵横, 2019(9): 29-45, 2.]
|
| [7] |
[和军. 东北经济的结构、体制关键障碍与突破路径. 当代经济研究, 2019(8): 96-106.]
|
| [8] |
[赵儒煜, 王媛玉. 东北经济频发衰退的原因探析: 从“产业缺位”到“体制固化”的嬗变. 社会科学战线, 2017(2): 48-57.]
|
| [9] |
[魏后凯. 东北经济的新困境及重振战略思路. 社会科学辑刊, 2017(1): 26-32, 2.]
|
| [10] |
[沈颂东, 陈鑫强, 韩明友. 东北振兴的产业重构与空间布局: 基于振兴目标、资源优势和物流成本的综合分析. 经济纵横, 2020(6): 102-108.]
|
| [11] |
[陈耀. 新一轮东北振兴战略要思考的几个关键问题. 经济纵横, 2017(1): 8-12.]
|
| [12] |
[刘斌. 新常态下东北经济振兴研究. 大连: 东北财经大学出版社, 2016: 43.]
|
| [13] |
[马克思. 马克思恩格斯全集·第四十五卷. 北京: 人民出版社, 2003: 182.]
|
| [14] |
[马克思. 马克思恩格斯全集·第四十四卷. 北京: 人民出版社, 2001: 542.]
|
| [15] |
[马克思. 马克思恩格斯全集·第三十卷. 北京: 人民出版社, 1995: 49.]
|
| [16] |
[大卫·哈维. 资本的限度. 张寅, 译. 北京: 中信出版社, 2017: 604, 589.]
|
| [17] |
[威廉·罗宾逊. 全球资本主义论. 高明秀, 译. 北京: 社会科学文献出版社, 2009: 43.]
|
| [18] |
[大卫·哈维. 新帝国主义. 初立忠, 沈晓雷, 译. 北京: 社会科学文献出版社, 2009: 89.]
|
| [19] |
[J.B.福斯特, R.W. 麦克切斯尼, R.J. 约恩纳, 等. 全球劳动后备军与新帝国主义. 国外理论动态, 2012(6): 38-48.]
|
| [20] |
[贺灿飞, 朱晟君. 中国产业发展与布局的关联法则. 地理学报, 2020, 75(12): 2684-2698.]
|
| [21] |
[董志凯, 吴江. 新中国工业的奠基石: 156项建设研究: 1950—2000. 广州: 广东经济出版社, 2004: 420-493.]
|
| [22] |
[游婧. 区域性国际贸易中心研究:全面对外开放的新探索. 成都: 四川大学出版社, 2018: 279.]
|
| [23] |
[王直, 魏尚进, 祝坤福. 总贸易核算法:官方贸易统计与全球价值链的度量. 中国社会科学, 2015(9): 108- 127, 205-206.]
|
| [24] |
[李跟强, 潘文卿. 国内价值链如何嵌入全球价值链: 增加值的视角. 管理世界, 2016(7): 10-22, 187.]
|
| [25] |
|
| [26] |
[丁晓强, 张少军. 中国经济双循环的测度与分析. 经济学家, 2022(2): 74-85.]
|
/
| 〈 |
|
〉 |