
Spatio-temporal evolution and influencing factors of aggregate carbon intensity of electricity generation in China's cities
Received date: 2023-08-05
Revised date: 2023-12-18
Online published: 2024-04-02
Supported by
Strategic Priority Research Program of the Chinese Academy of Sciences(XDA23100302)
National Natural Science Foundation of China(71974109)
National Natural Science Foundation of China(72140005)
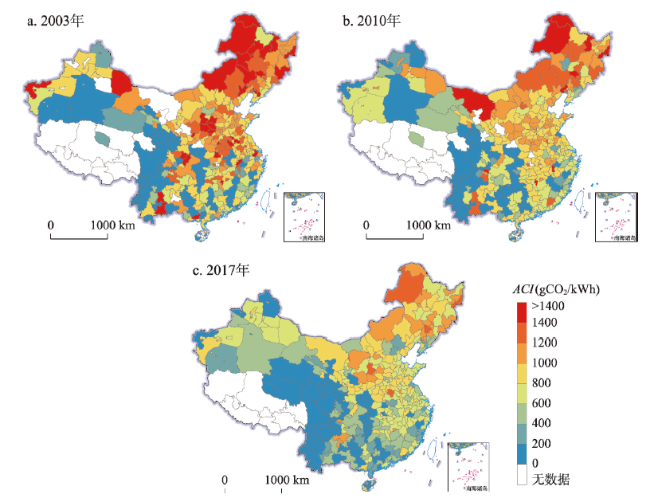
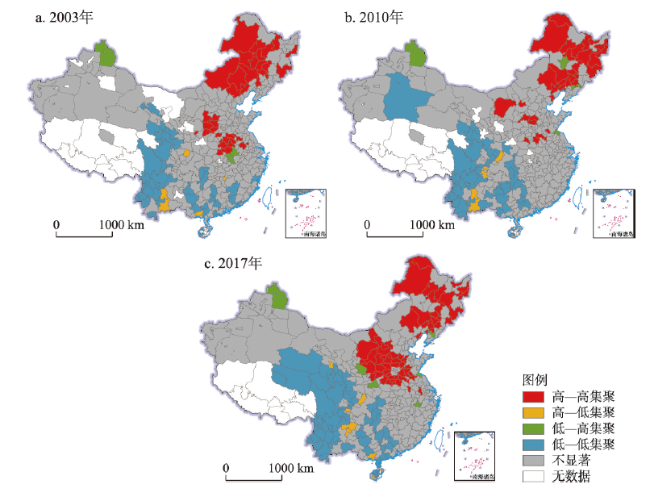
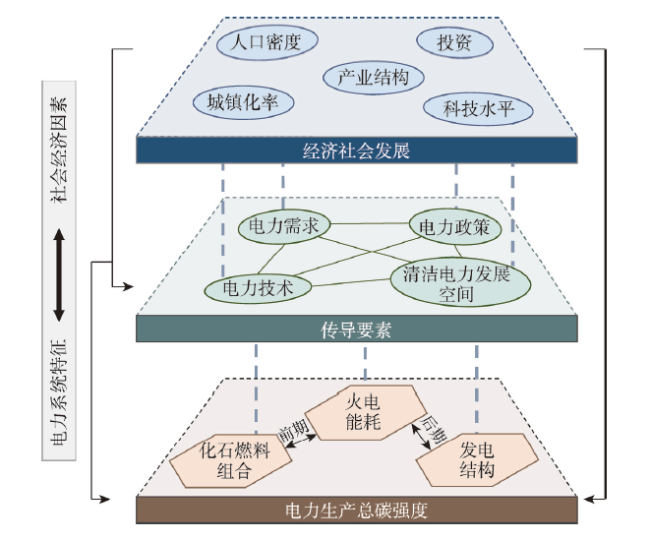
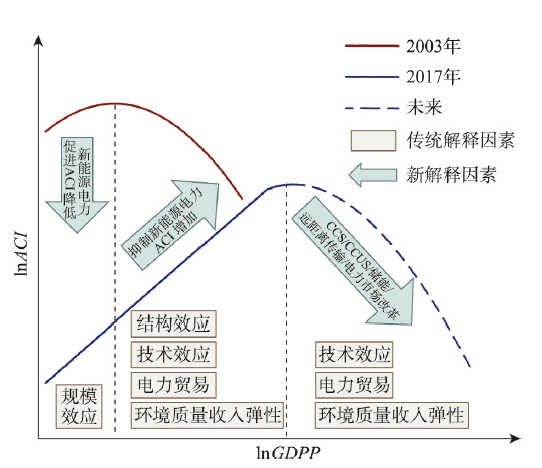
The power sector is a critical industry in China's efforts to attain its carbon peaking and carbon neutrality targets. Analyzing the spatio-temporal pattern and influencing factors of the aggregate carbon intensity (ACI) of electricity generation at the city scale is of great significance for refining electricity emission reduction policies and guiding regional collaborative carbon reduction. This study utilizes micro-level data from 21543 power plants with a capacity of 6000 kW or above, in combination with multiple sources of statistical data related to energy, economy, and society, to calculate ACI of electricity generation in China's cities in 2003, 2010, and 2017. Exploratory spatial data analysis, IDA-LMDI decomposition, and STIRPAT modeling are employed to reveal the spatio-temporal patterns and influencing factors. The findings show that: (1) From 2003 to 2017, the ACI of China's electricity generation sector exhibited a notable decline, albeit with a trend of increasing internal differences. Significant spatial differentiation was observed at city scale, with the northeast half of the Bole-Taipei Line maintaining higher levels than the southwest half over an extended period. The degree of spatial agglomeration also increased significantly during this period, with Northeast and North China identified as regions of particular concern in the decline of ACI. (2) The thermal efficiency was the dominant factor in the decline of ACI in the early stage, whereas the electricity generation structure became increasingly influential in the later period. Meanwhile, other power system factors exhibited less influence, though significant spatial differences were observed. (3) The impact of diverse socio-economic determinants on ACI fluctuated over time, engendering modifications in the attributes of the power system through their interactions with the intricate network of power demand, policy, technology, and clean energy expansion opportunities. (4) An inverted U-shaped correlation was observed between ACI and per capita GDP in 2003 and 2010, which transformed into a linear positive association in 2017. This shift can be attributed to the swift emergence of renewable electricity that have challenged the traditional interpretive framework of the Environmental Kuznets Curve hypothesis, which was previously applicable only to thermal power generation. In the future, endeavors aimed at reducing emissions in the electricity sector must comprehensively acknowledge the spatial heterogeneity and sustain attention towards the ramifications of abrupt shifts arising from emerging technologies on the conventional theoretical framework.

MA Shiping , XIE Yongshun , CHEN Hongyang , ZHANG Wenzhong . Spatio-temporal evolution and influencing factors of aggregate carbon intensity of electricity generation in China's cities[J]. Acta Geographica Sinica, 2024 , 79(3) : 712 -731 . DOI: 10.11821/dlxb202403010
表1 电力生产总碳强度核算相关缺省数据Tab. 1 Default data related to aggregate carbon intensity calculation of electricity generation |
| 原煤 | 石油 | 天然气 | |
|---|---|---|---|
| 平均热值(kJ/kg, kJ/m3) | 20908 | 41816 | 35585 |
| 单位热值含碳量(tC/TJ) | 26.37 | 20.08 | 15.32 |
| 发电锅炉平均碳氧化率(%) | 99.00 | 98.00 | 99.00 |
| 标煤转换系数(kg ce/kg, kg ce/m3) | 0.71 | 1.43 | 1.22 |
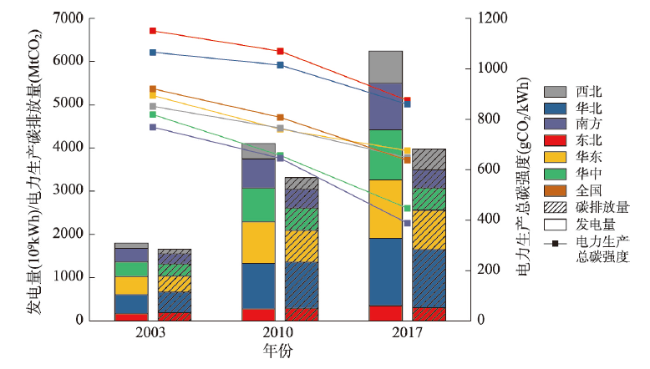
图1 2003—2017年中国及六大区域电网碳排放量、发电量、电力生产总碳强度变化Fig. 1 The change in CO2 emissions, electricity generation, and ACI of China and six regional power grids, 2003-2017 |
表2 2003—2017年区域电网内及区域电网间电力生产总碳强度泰尔指数Tab. 2 Thiel index of ACI within and between regional power grids of China, 2003-2017 |
| 2003年 | 2010年 | 2017年 | |
|---|---|---|---|
| 全国 | 0.0876 | 0.1220 | 0.1803 |
| 区域电网内 | 0.0780(89.09%) | 0.1033(84.67%) | 0.1379(76.52%) |
| 区域电网间 | 0.0096(10.91%) | 0.0187(15.33%) | 0.0423(23.48%) |
| 东北电网 | 0.1477 | 0.1808 | 0.2279 |
| 华北电网 | 0.1075 | 0.0801 | 0.1022 |
| 华东电网 | 0.0512 | 0.0426 | 0.0548 |
| 华中电网 | 0.1992 | 0.2811 | 0.4287 |
| 南方电网 | 0.1119 | 0.2141 | 0.3947 |
| 西北电网 | 0.1461 | 0.1883 | 0.1383 |
注:括号中数字表示贡献度。 |
表3 2017年“胡焕庸线”及“博台线”两侧发电总量、碳排放总量及电力生产总碳强度对比Tab. 3 Comparison of total electricity generation, total CO2 emissions and ACI on both sides of the Hu Huanyong Line and Bole-Taipei Line in 2017 |
| “胡焕庸线” | “博台线” | ||||||
|---|---|---|---|---|---|---|---|
| 东南半壁 | 西北半壁 | 差值 | 东北半壁 | 西南半壁 | 差值 | ||
| 发电总量(TWh) | 5159.96 | 1082.13 | 4077.83 | 3992.05 | 2250.03 | 1742.02 | |
| 碳排放总量(MtCO2) | 3210.40 | 765.20 | 2445.20 | 3140.52 | 835.08 | 2305.45 | |
| 电力生产总碳强度(gCO2/kWh) | 622.17 | 707.13 | 84.95 | 786.69 | 371.14 | 415.55 | |
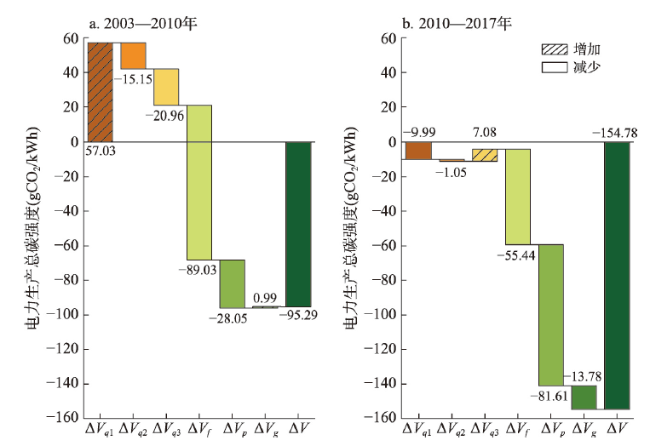
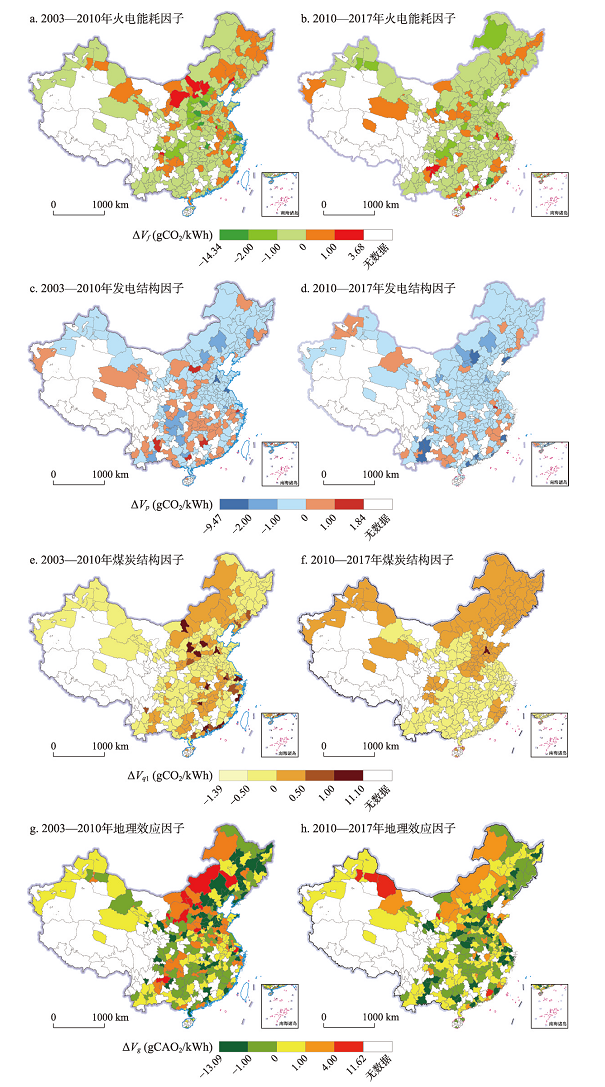
表4 城市尺度分解结果的统计特征Tab. 4 Statistical characteristics of IDA-LMDI analysis results at the city scale |
| ΔVf | ΔVp | ΔVq1 | ΔVg | ||||||||
|---|---|---|---|---|---|---|---|---|---|---|---|
| T1 | T2 | T1 | T2 | T1 | T2 | T1 | T2 | ||||
| 负值占比(%) | 72.14 | 80.71 | 48.57 | 83.93 | 62.14 | 53.57 | 50.00 | 53.93 | |||
| 最大值(gCO2/kWh) | 2.26 | 3.68 | 1.84 | 1.31 | 11.09 | 1.42 | 11.49 | 11.61 | |||
| 最小值(gCO2/kWh) | -14.33 | -2.44 | -9.46 | -5.73 | -1.38 | -3.15 | -13.09 | -6.90 | |||
| 平均值(gCO2/kWh) | -0.32 | -0.20 | -0.10 | -0.29 | 0.20 | -0.04 | 0.00 | -0.05 | |||
| 标准差 | 1.26 | 0.60 | 0.77 | 0.70 | 1.05 | 0.26 | 2.20 | 1.59 | |||
注:T1、T2分别代表2003—2010年、2010—2017年。 |
表5 基于STIRPAT模型的空间回归分析检验结果Tab. 5 Test results of spatial regression analysis based on STIRPAT model |
| 回归模型 | 2003年 | 2010年 | 2017年 | |||||
|---|---|---|---|---|---|---|---|---|
| SLM | SEM | SLM | SEM | SLM | SEM | |||
| rho | 0.045*** | 0.047*** | 0.078*** | |||||
| lambda | 0.015 | 0.010 | 0.143*** | |||||
| Wald test | 11.275*** | 1.073 | 14.645*** | 0.916 | 50.251*** | 92.404*** | ||
| LR test | 11.078*** | 1.718 | 14.318*** | 1.281 | 46.668*** | 59.039*** | ||
| LM test | 10.138*** | 6.432** | 13.802*** | 6.814** | 45.867*** | 46.841*** | ||
| AIC | 1829.508 | 1838.868 | 1709.554 | 1730.151 | 1615.438 | 1603.068 | ||
| Squared correlation | 0.318 | 0.292 | 0.371 | 0.341 | 0.369 | 0.206 | ||
注:***、**和*分别代表回归结果在1%、5%和10%的显著性水平显著,下同。 |
表6 空间滞后模型估计结果Tab. 6 Estimation results of spatial lag model |
| 2003年 | 2010年 | 2017年 | ||||||
|---|---|---|---|---|---|---|---|---|
| 模型Ⅰ | 模型Ⅱ | 模型Ⅲ | 模型Ⅳ | 模型Ⅴ | 模型Ⅵ | |||
| lnPD | 1.186***(4.37) | 0.632**(2.43) | 0.195(0.90) | |||||
| lnUR | 3.039***(5.15) | 3.985***(4.81) | 3.361***(4.24) | |||||
| lnINV | -1.043**(-2.13) | -1.164**(-2.44) | -0.455(-1.43) | |||||
| lnINDP | 0.534*(1.84) | 0.653**(2.28) | -0.030(-0.11) | |||||
| lnRDP | 0.271(1.20) | 0.338**(2.28) | 0.323**(2.42) | |||||
| lnGDPP | 1.913***(5.54) | 4.369***(7.41) | 1.853*(1.85) | |||||
| (lnGDPP)2 | -1.823***(-4.86) | -1.549***(-4.09) | -0.111(-0.25) | |||||
| _cons | -14.425***(-5.75) | 4.403***(9.52) | -16.082***(-5.53) | 1.978***(5.21) | -12.783***(-4.48) | 0.734(1.34) | ||
注:括号中的数值为t检验值。 |
| [1] |
|
| [2] |
|
| [3] |
|
| [4] |
|
| [5] |
|
| [6] |
|
| [7] |
|
| [8] |
|
| [9] |
|
| [10] |
|
| [11] |
[ 黄蕊, 王铮, 丁冠群, 等. 基于STIRPAT模型的江苏省能源消费碳排放影响因素分析及趋势预测. 地理研究, 2016, 35(4): 781-789.]
|
| [12] |
|
| [13] |
[ 王少剑, 谢紫寒, 王泽宏. 中国县域碳排放的时空演变及影响因素. 地理学报, 2021, 76(12): 3103-3118.]
|
| [14] |
[ 王少剑, 苏泳娴, 赵亚博. 中国城市能源消费碳排放的区域差异、空间溢出效应及影响因素. 地理学报, 2018, 73(3): 414-428.]
|
| [15] |
[ 刘卫东, 唐志鹏, 夏炎, 等. 中国碳强度关键影响因子的机器学习识别及其演进. 地理学报, 2019, 74(12): 2592-2603.]
|
| [16] |
[ 王少剑, 黄永源. 中国城市碳排放强度的空间溢出效应及驱动因素. 地理学报, 2019, 74(6): 1131-1148.]
|
| [17] |
[ 姜宛贝, 刘卫东, 刘志高, 等. 中国化石能源燃烧碳排放强度非均衡性及其演变的驱动力分析. 地理科学进展, 2020, 39(9): 1425-1435.]
|
| [18] |
[ 王正, 樊杰. 能源消费碳排放的影响因素特征及研究展望. 地理研究, 2022, 41(10): 2587-2599.]
|
| [19] |
|
| [20] |
|
| [21] |
|
| [22] |
|
| [23] |
|
| [24] |
|
| [25] |
|
| [26] |
|
| [27] |
|
| [28] |
|
| [29] |
|
| [30] |
|
| [31] |
|
| [32] |
|
| [33] |
|
| [34] |
|
| [35] |
|
| [36] |
|
| [37] |
|
/
| 〈 |
|
〉 |