
Spatio-temporal evolution and its driving factors of non-ferrous mining sites in China
Received date: 2022-12-19
Revised date: 2023-03-07
Online published: 2023-05-27
Supported by
National Key R&D Program of China(2018YFC1800100)
National Natural Science Foundation of China(42277475)
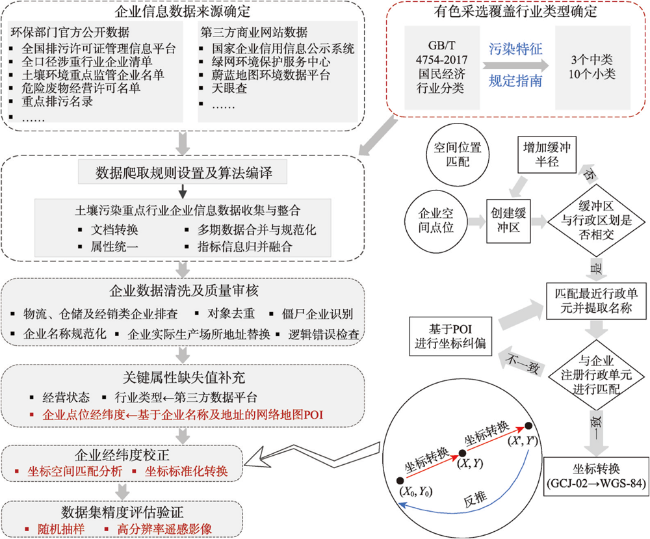
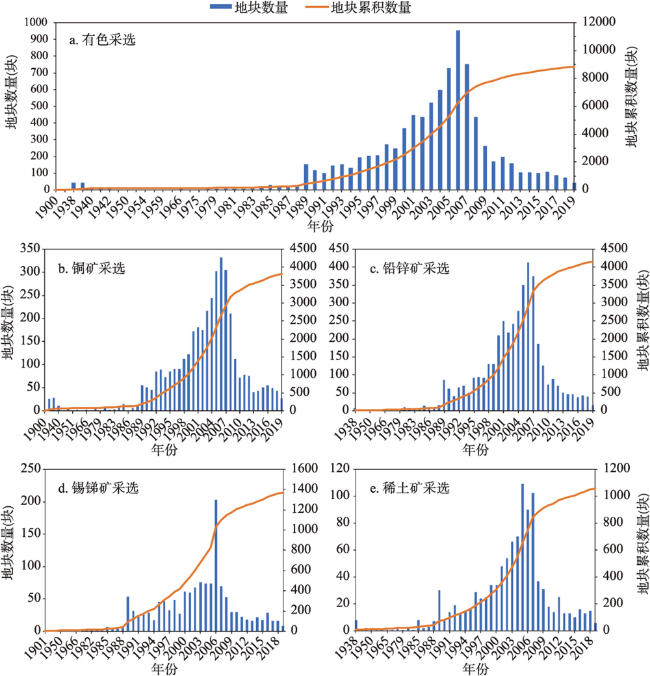
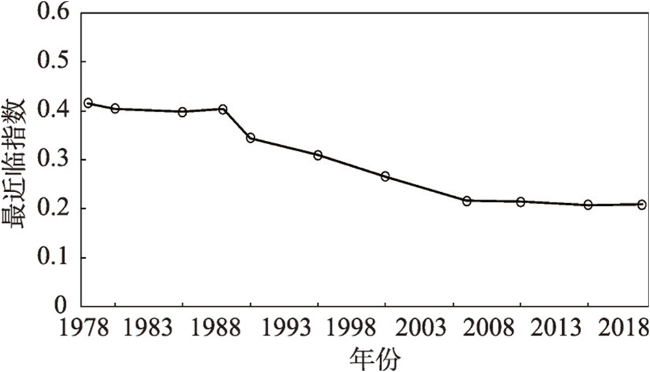
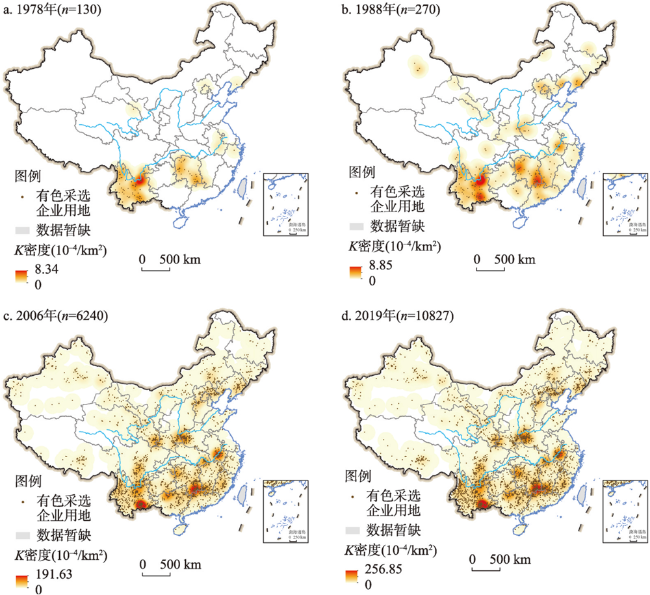
As one of the pillar industries, the non-ferrous mining industry has caused severe environmental problems while supporting the development of the national economy. Understanding the spatial pattern and driving force of non-ferrous mining industrial sites (NMISs) is of great significance in promoting the optimization of industrial layout and the overall control of environmental pollution. However, the current research on the evolution of the national distribution pattern of NMISs is still insufficient, which is challenging to meet the actual needs of the existing related industry and environmental protection situation. In this paper, we obtained a high-resolution NMISs dataset, based on multi-source information fusion, including geographic big data, Gaode POI, and special environmental data. We also investigated the spatio-temporal pattern, evolution characteristics, and driving factors of NMISs from the beginning of the 20th century to 2019 based on the spatial regression model and the GIS platform. The results showed that the growth of NMISs in China has generally experienced a stable and slow development trend in the early period (before 1978), gradually reaching a peak after the reform and opening up (1979-2006), and then stabilizing again (2007-). With the continuous enhancement of spatial agglomeration of NMISs, the hotspot areas gradually extended from southeast Hunan and central Yunnan to central and western China, which is rich in resources and energy, presenting an agglomeration pattern of "four cores and multiple sub-cores". The cores include eastern Yunnan, the Hunan-Jiangxi-Guangdong junction area, southern Anhui, and western Henan. The sub-cores included parts of Northwest and Northeast China. Further, the above spatio-temporal evolution characteristics were controlled by the positive promotion of resource endowment, path dependence, and the earlier encouraging industrial policy. However, we observed the emerging negative restraining effect on the recent pattern of NMISs from the tightening of related restrictive industrial and environmental policies introduced intensively after 2010. This paper could provide a reliable scientific basis and information support for optimizing related macro-strategic decision-making and environmental spatial governance by analyzing spatio-temporal patterns and the driving factors of China's NMISs. Furthermore, this study proposed the methodological system for constructing national-scale high-precision industrial site datasets by applying multi-source geographic big data technology. The current paper also provided a new perspective and ideas for the related assessment at a large regional scale.

WEI Changhe , LEI Mei . Spatio-temporal evolution and its driving factors of non-ferrous mining sites in China[J]. Acta Geographica Sinica, 2023 , 78(5) : 1271 -1289 . DOI: 10.11821/dlxb202305013
表1 有色金属采选企业用地格局驱动变量选取及其数据来源Tab. 1 Selection and sources of driving factors of the pattern of non-ferrous metal mining enterprise sites |
| 解释变量类型(自变量) | 可观测变量 | 数据来源 | |
|---|---|---|---|
| 资源 禀赋 | 能源禀赋 | 本地发电量(EEP) | 各省市统计年鉴 |
| 金属矿产禀赋 | 有色金属矿产储量(Reserve_ore) | 万德数据库 | |
| 路径依赖(历史基础) | 1980年以前大中型有色采选企业个数(NFEs_1980) | 本文构建的有色采选企业用地信息数据集 | |
| 交通条件(市场通达性) | 铁路及公路总里程(DST) | 各省市统计年鉴;国家基础地理信息中心1∶100万全国基础地理数据库 | |
| 自然地理 | 年均降雨量(AP) | 资源环境科学数据中心(http://www.resdc.cn/Default.aspx)500 m分辨率中国气象背景数据集(经DEM校正) | |
| 年均气温(AT) | |||
| 地形起伏度(Slope) | 全球变化科学研究数据出版系统(www.geodoi.ac.cn)中国地形起伏度公里网格数据集 | ||
| 水资源总量(TWR) | 中国水利统计年鉴 | ||
| 要素 成本 | 土地成本 | 工业用地成交均价(LP) | 中国指数研究院数据信息中心;中国国土资源统计年鉴 |
| 劳动力成本 | 职工平均工资(Income) | 中国劳动统计年鉴 | |
| 政府 政策 | 产业政策 | 有色金属产业园区数量(NIPs) | 前瞻产业园区库;中国开发区审核公告目录 |
| 有色产业政策指数(Index_IP) | 基于国家及各省市相关部门网站检索有色内容,按照“唐健政策赋值法”打分 | ||
| 环保政策 | 环境管制强度(环保投资额占GDP比例,EI%) | 基于各省市环境统计年鉴计算 | |
| 环境规制指数(Index_ER) | 基于国家及各省市生态环境部门网站检索结果,按照“唐健政策赋值法”打分 | ||
| 市场规模 | 地区工业总产值(GIO) | 各省市地区工业统计年鉴 | |
| 第二产业占GDP比例(SP%) | 各省市地区工业统计年鉴 | ||
表2 产业及环保政策指标量化及其分值设置Tab. 2 Quantification and score setting of industrial and environmental policy indicators |
| 政策级别 | 正激励政策分值 | 负激励政策分值 |
|---|---|---|
| 国家级法律条例 | +3 | -3 |
| 国家级政策文件 | +2 | -2 |
| 省级法律条例 | +1.5 | -1.5 |
| 省级政策文件 | +1 | -1 |
| 地市级及以下政策文件及条例 | +0.5 | -0.5 |
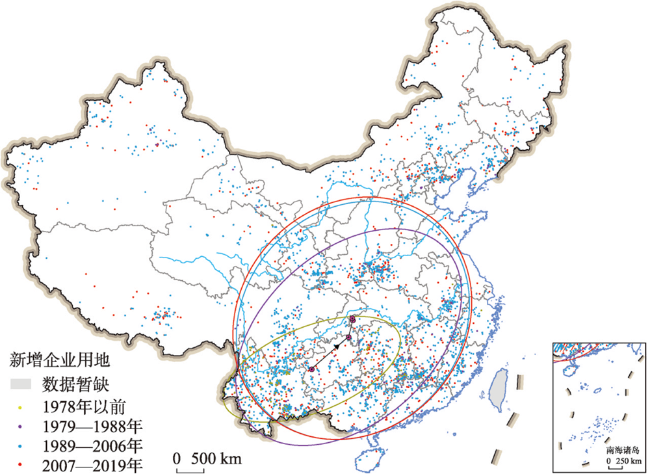
图4 不同时期中国有色采选企业用地点位及核密度空间分布注:基于自然资源部标准地图服务网站GS(2020)4632号标准地图制作,底图边界无修改。 Fig. 4 The site and kernel density distribution of non-ferrous mining enterprise lands in China |
表3 1978—2019年全国有色金属采选企业用地标准差椭圆参数Tab. 3 Parameter of ellipse with standard deviation of non-ferrous mining enterprise lands in China in 1978-2019 |
| 年份 | 长半轴(km) | 短半轴(km) | 平均形状指数 | 方位角(°) |
|---|---|---|---|---|
| 1978 | 813.02 | 368.25 | 2.21 | 67.87 |
| 1988 | 1134.8 | 739.23 | 1.54 | 47.73 |
| 2006 | 944.67 | 1089.90 | 0.87 | 40.02 |
| 2019 | 968.53 | 1109.09 | 0.87 | 41.19 |
注:长半轴表示点位空间分布的方向;短半轴表示点位空间分布的范围,短半轴越短则向心力越明显;平均形状指数用于描述标准差椭圆的扁率,其值越远离1表明点位空间分布的方向性越明显。 |
表4 拉格朗日乘子(LM)空间依赖性诊断结果Tab. 4 Results of spatial dependence diagnosis with Lagrange multiplier (LM) |
| 因变量 | LM 统计量 | 空间权重矩阵 | ||
|---|---|---|---|---|
| MI/DF | 行标准化权重 | p值 | ||
| NFEs_1990 | Moran's I (error) | -0.019 | -0.115 | 0.908 |
| LM (lag) | 1 | 0.016 | 0.898 | |
| R-LM (lag) | 1 | 0.038 | 0.846 | |
| LM (error) | 1 | 0.329 | 0.566 | |
| R-LM (error) | 1 | 0.350 | 0.554 | |
| NFEs_2019 | Moran's I (error) | 0.091 | 3.287 | 0.001 |
| LM (lag) | 1 | 9.370 | 0.002 | |
| R-LM (lag) | 1 | 2.911 | 0.048 | |
| LM (error) | 1 | 7.415 | 0.006 | |
| R-LM (error) | 1 | 0.955 | 0.328 | |
注:MI/DF代表自由度。 |
表5 最小二乘回归(OLS)结果及其性能指标(1990年)Tab. 5 Ordinary Least Squares regression (OLS) parameters analysis (1990) |
| 变量类型 | 自变量 | 回归系数 | 标准偏差 | t统计 | p值 |
|---|---|---|---|---|---|
| 资源禀赋 | EEP | 0.154 | 0.199 | 0.778 | 0.437 |
| Reserve_ore | 1.454 | 0.251 | 5.786 | 0.000 | |
| 路径依赖 | NFEs_1980 | 3.216 | 0.266 | 12.094 | 0.000 |
| 交通替代 | DST | -0.002 | 0.223 | -0.008 | 0.994 |
| 自然地理条件 | AP | -0.763 | 0.388 | -1.968 | 0.050 |
| AT | 0.581 | 0.386 | 1.504 | 0.133 | |
| Slope | -0.172 | 0.276 | -0.623 | 0.534 | |
| TWR | 0.020 | 0.249 | 0.081 | 0.936 | |
| 要素成本 | LP | -0.001 | 0.220 | -0.006 | 0.995 |
| Income | 0.244 | 0.206 | 1.186 | 0.236 | |
| 产业政策 | NIPs | 0.004 | 0.200 | 0.021 | 0.983 |
| Index_IP | 1.520 | 0.246 | 6.182 | 0.000 | |
| 环境政策 | EI% | -0.043 | 0.196 | -0.219 | 0.827 |
| Index_ER | -0.033 | 0.250 | -0.132 | 0.895 | |
| 市场规模 | GIO | 0.086 | 0.187 | 0.460 | 0.646 |
| SP% | -0.045 | 0.215 | -0.211 | 0.833 | |
| 赤池信息量准则(AIC) = 1795.63 | |||||
| 施瓦兹准则(SC) = 1860.72 | |||||
| 对数似然估计(Log-lik) = -880.81 | |||||
| 拟合优度R2 = 0.732 | |||||
表6 空间滞后模型(SLM)与最小二乘回归(OLS)结果及其性能对比(2019年)Tab. 6 Parameters of Spatial Lag Model (SLM) and Least Squares Regression (OLS) results (2019) |
| 自变量 | 空间滞后模型(SLM) | 最小二乘回归(OLS) | |||||||
|---|---|---|---|---|---|---|---|---|---|
| 回归系数 | 标准差 | z值 | p值 | 回归系数 | 标准差 | t统计 | p值 | ||
| EEP | 1.601 | 4.317 | 0.371 | 0.711 | 0.184 | 4.485 | 0.041 | 0.967 | |
| Reserve_ore | 19.030 | 3.638 | 5.231 | 0.000 | 19.171 | 3.787 | 5.062 | 0.000 | |
| NFEs_1980 | 38.992 | 3.894 | 10.013 | 0.000 | 39.910 | 4.038 | 9.884 | 0.000 | |
| DST | -2.425 | 4.335 | -0.559 | 0.576 | -2.205 | 4.513 | -0.489 | 0.625 | |
| AP | -6.159 | 6.386 | -0.964 | 0.335 | -7.170 | 6.648 | -1.078 | 0.282 | |
| AT | 10.562 | 6.921 | 1.526 | 0.127 | 13.051 | 7.198 | 1.813 | 0.071 | |
| Slope | 9.773 | 4.743 | 2.060 | 0.039 | 10.538 | 4.933 | 2.136 | 0.033 | |
| TWR | -1.881 | 3.802 | -0.495 | 0.621 | -1.028 | 3.941 | -0.261 | 0.794 | |
| LP | 1.976 | 3.990 | 0.495 | 0.620 | 1.265 | 4.145 | 0.305 | 0.760 | |
| Income | -6.284 | 4.270 | -1.472 | 0.141 | -6.371 | 4.445 | -1.433 | 0.153 | |
| NIPs | 15.291 | 3.667 | 4.170 | 0.000 | 14.510 | 3.801 | 3.818 | 0.000 | |
| Index_IP | 19.647 | 3.872 | 5.074 | 0.000 | 21.252 | 4.007 | 5.303 | 0.000 | |
| EI% | -5.763 | 3.408 | -1.691 | 0.091 | -5.669 | 3.546 | -1.599 | 0.111 | |
| Index_ER | -12.169 | 4.501 | -2.703 | 0.007 | -15.256 | 4.531 | -3.367 | 0.001 | |
| GIO | -2.220 | 5.586 | -0.397 | 0.691 | -2.328 | 5.812 | -0.400 | 0.689 | |
| SP% | -0.170 | 3.341 | -0.051 | 0.959 | -0.317 | 3.478 | -0.091 | 0.927 | |
| 赤池信息量准则(AIC) = 3775.86 | 赤池信息量准则(AIC) = 3782.35 | ||||||||
| 施瓦兹准则(SC) = 3844.78 | 施瓦兹准则(SC) = 3847.44 | ||||||||
| 对数似然估计(Log-lik) = -1869.93 | 对数似然估计(Log-lik) = -1874.17 | ||||||||
| 拟合优度R2 = 0.620 Likelihood Ratio Test=8.487 (p = 0.0036) | 拟合优度R2 = 0.609 | ||||||||
| [1] |
China National Standardization Administration. Industrial Classification of National Economy: GB/T 4754-2017, Beijing: China National Standardization Administration, 2017.
[ 中国国家标准化管理委员会. 国民经济行业分类:GB/T 4754-2017, 北京: 中国国家标准化管理委员会2017.]
|
| [2] |
[ 冯德坤, 杨雪, 万咏咏, 等. 湖南省有色金属工业场地时空格局及成因分析. 西南大学学报: 自然科学版, 2022, 44(9): 144-155.]
|
| [3] |
Ministry of Industry and Information Technology. Chinese Nonferrous Metals Industry Yearbook. Beijing: Ministry of Industry and Information Technology, 2019.
[ 工业和信息化部. 中国有色金属工业年鉴. 北京: 工业和信息化部, 2019.]
|
| [4] |
|
| [5] |
|
| [6] |
|
| [7] |
|
| [8] |
State Council. Adjustment and revitalization plan of non-ferrous metal industry. http://www.scio.gov.cn/ztk/dtzt/13/3/Document/524871/524871.htm, 2010/2021-05-08.
[国务院. 有色金属产业调整和振兴规划. http://www.scio.gov.cn/ztk/dtzt/13/3/Document/524871/524871.htm, 2010/2021-05-08.]
|
| [9] |
Ministry of Industry and Information Technology. Non-ferrous Metal Industry Development Plan (2016-2020). http://gxt.jl.gov.cn/xxgk/zcwj/bwgz/201610/t20161024_2453629.html, 2016/2021-05-08.
[ 工业和信息化部. 有色金属工业发展规划(2016—2020年). http://gxt.jl.gov.cn/xxgk/zcwj/bwgz/201610/t20161024_2453629.html, 2016/2021-05-08.]
|
| [10] |
Ministry of Environmental Protection. The Ministry of Environmental Protection announced the 2013 assessment results of the 12th Five Year Plan for Comprehensive Prevention and Control of Heavy Metal Pollution. http://www.mee.gov.cn/gkml/sthjbgw/qt/201412/t20141217_293091.htm, 2014/2021-01-08.
[ 环境保护部.环境保护部公布《重金属污染综合防治“十二五”规划》2013年度考核结果. http://www.mee.gov.cn/gkml/sthjbgw/qt/201412/t20141217_293091.htm, 2014/2021-01-08.]
|
| [11] |
[ 国务院. 国务院关于印发全国主体功能区规划的通知. http://www.gov.cn/zwgk/2011-06/08/content_1879180.htm, 2010/2020-10-10.]
|
| [12] |
[ 彭逸喆, 黄凤莲, 姜苹红, 等. 基于地表水环境容量的湖南工业废水铊污染物排放控制研究. 生态环境学报, 2020, 29(10): 2070-2080.]
|
| [13] |
[ 王秦, 李伟. 区域资源环境承载力评价研究进展及展望. 生态环境学报, 2020, 29(7): 1487-1498.]
|
| [14] |
[ 王紫薇, 蔡红艳, 陈慕琳. 基于大数据的化工企业时空变化特征及其对水域的潜在影响分析方法. 地球信息科学学报, 2022, 24(4): 673-683.]
|
| [15] |
[ 卞正富, 张燕平. 徐州煤矿区土地利用格局演变分析. 地理学报, 2006, 61(4): 349-358.]
|
| [16] |
|
| [17] |
[ 郭长庆, 迟文峰, 匡文慧, 等. 1990—2020年中国能源开采和加工场地多源数据综合制图与时空变化分析. 地球信息科学学报, 2022, 24(1): 127-140.]
|
| [18] |
[ 刘振坤, 吴华勇, 刘峰, 等. 中国焦化场地近20年时空演变特征及驱动因素. 生态环境学报, 2021, 30(3): 604-613.]
|
| [19] |
|
| [20] |
|
| [21] |
|
| [22] |
|
| [23] |
|
| [24] |
|
| [25] |
[ 李德仁, 余涵若, 李熙. 基于夜光遥感影像的“一带一路”沿线国家城市发展时空格局分析. 武汉大学学报(信息科学版), 2017, 42(6): 711-720.]
|
| [26] |
|
| [27] |
[ 贺灿飞, 朱彦刚. 中国资源密集型产业地理分布研究: 以石油加工业和黑色金属产业为例. 自然资源学报, 2010, 25(3): 488-501.]
|
| [28] |
|
| [29] |
|
| [30] |
[ 李君华. 产业集聚与中国制造业分布研究[D]. 武汉: 华中科技大学, 2007.]
|
| [31] |
[ 唐健. 我国耕地保护制度与政策研究. 北京: 中国社会科学出版社, 2006.]
|
| [32] |
[ 曹正凤. 随机森林算法优化研究[D]. 北京: 首都经济贸易大学, 2014.]
|
| [33] |
|
| [34] |
|
| [35] |
|
| [36] |
|
| [37] |
|
| [38] |
|
| [39] |
|
| [40] |
|
| [41] |
[ 孙祥栋, 张亮亮. 中国有色金属行业的地理分布: 基于空间杜宾模型的实证分析. 技术经济, 2016, 35(6): 96-100, 118.]
|
| [42] |
[ 贺灿飞, 梁进社, 张华. 北京市外资制造企业的区位分析. 地理学报, 2005, 60(1): 122-130.]
|
| [43] |
[ 王俊松. 长三角制造业空间格局演化及影响因素. 地理研究, 2014, 33(12): 2312-2324.]
|
| [44] |
[ 谭少华, 倪绍祥. 区域土地利用变化驱动力的成因分析. 地理与地理信息科学, 2005, 21(3): 47-50.]
|
| [45] |
|
| [46] |
[ 张健琳, 瞿明凯, 陈剑, 等. 中国西南地区金属矿开采对矿区土壤重金属影响的Meta分析. 环境科学, 2021, 42(9): 4414-4421.]
|
| [47] |
|
| [48] |
Ministry of Ecology and Environment. Bulletin of the second national pollution source survey. Beijing: Ministry of Ecology and Environment. https://www.mee.gov.cn/xxgk2018/xxgk/xxgk01/202006/t20200610_783547.html, 2020/2020-12-13.
[ 生态环境部. 第二次全国污染源普查公报. 北京: 生态环境部. https://www.mee.gov.cn/xxgk2018/xxgk/xxgk01/202006/t20200610_783547.html, 2020/2020-12-13.]
|
/
| 〈 |
|
〉 |