
Carbon accounting for land use, land-use change and forestry in Guangdong province
Received date: 2022-04-08
Revised date: 2023-02-07
Online published: 2023-03-27
Supported by
International Aid Transparency Initiative(7183770)
Major Project of Philosophy and Social Sciences of the Ministry of Education of China(19JZD013)
The Open Fund Project of the Key Laboratory of Land Use, Ministry of Natural Resources of China(2020-164-1)
Land use, land-use change, and forestry, also known as LULUCF, are significant sources and sinks of carbon. A high-precision carbon accounting system for LULUCF should always be established as the primary building block for advancing low-carbon land use and sophisticated land management. This study uses the stock-difference method to account for carbon sources and sinks brought by LULUCF at the plot scale in Guangdong. According to the carbon accounting based on the surveys on soil, land use, and forest resources, Guangdong's LULUCF produced 29.673 million tons of carbon sinks in 2018, of which the biomass carbon sink contributed approximately 70% and the soil carbon sink around 30%. The major ways to increase LULUCF carbon sinks, therefore, are to increase plant cover and improve forest management. Different areas within the same land-use type have various carbon accounting values. Even within particular land-use types, such as forestland, wetland, cropland, settlements, and grassland, the carbon accounting values may fluctuate between being recognized as carbon sources and carbon sinks. In the era of reaching carbon peaking and carbon neutrality goals, it is difficult to meet the land-use management requirements with a carbon accounting technique assuming the carbon emission coefficient of every land-use type is constant. The carbon accounting of LULUCF in this study takes annual fluctuations in biomass and soil organic carbon pools into account, which complies with the United Nations Framework Convention on Climate Change criteria and is applicable on a national level in China. Meanwhile, the vegetation allometric growth model and the differentiation map of annual fluctuations of the soil carbon pool resulting from this study can be utilized to enable multi-scenario analyses of the carbon sources or sinks of lands at the plot scale. Finally, the results of the LULUCF carbon accounting offer some support for policymaking that emphasizes decreasing carbon sources and increasing carbon sinks in the management of land use and natural resources.
Key words: land use; LULUCF; carbon accounting; stock-difference method; Guangdong province
LYU Guowei , ZHOU Jianchun , CAI Yumei , MENG Chao , LI Shengfa , CHEN Weilian . Carbon accounting for land use, land-use change and forestry in Guangdong province[J]. Acta Geographica Sinica, 2023 , 78(3) : 640 -657 . DOI: 10.11821/dlxb202303009
表1 土地利用及其变化以及林业的生物量、土壤碳核算方法与数据来源Tab. 1 Accounting for annual carbon change in biomass and soil pools caused by LULUCF: Methods and data |
| 地类 | 生物量碳源或碳汇量 | 土壤碳源或碳汇量 | 数据来源 | ||||
|---|---|---|---|---|---|---|---|
| 核算方法 | 数据时期 | 核算方法 | 数据时期 | ||||
| 林地 | 植被异速生长模型 | 2013—2016年 2017—2018年2020年 | 土壤调查,库—差别法 | 1979—1985年2010—2018年 | A,B,C,D,E,F | ||
| 湿地 | 植被异速生长模型 | 2013—2016年 2017—2018年2020年 | 土壤调查,库—差别法 | 1979—1985年2010—2018年 | A,B,C,D,E,F | ||
| 耕地 | 耕地“一年生”当年生物量碳源或碳汇设为0 | 2018年2020年 | 土壤调查,库—差别法 | 1979—1985年2010—2018年 | B,C,D,E | ||
| 草地 | 草地“一年生”当年生物量碳源或碳汇设为0 | 2018年2020年 | 土壤调查,库—差别法 | 1979—1985年2010—2018年 | B,C,D,E | ||
| 建设用地 | 建设用地当年生物量碳源或碳汇设为0 | 2018年2020年 | 土壤调查,库—差别法 | 1979—1985年2010—2018年 | B,C,D,E | ||
| 林地转建设用地 | 森林资源二类调查,库—差别法 | 2013—2016年 2017—2018年2020年 | 地类转换当年土壤碳库变化不大,当年碳源或碳汇量设为0 | 2018年 | A,E,F | ||
| 草地转建设用地 | 森林资源二类调查,库—差别法 | 2013—2016年 2017—2018年2020年 | 地类转换当年土壤碳库变化不大,当年碳源或碳汇量设为0 | 2018年 | A,E,F | ||
| 耕地转林地 | IPCC参考值,植被异速生长模型,库—差别法 | 2013—2016年 2017—2018年2020年 | 地类转换当年土壤碳库变化不大,当年碳源或碳汇量设为0 | 2018年 | A,E,F | ||
| 耕地转建设用地 | IPCC参考值,库—差别法 | 2018年 2020年 | 地类转换当年土壤碳库变化不大,当年碳源或碳汇量设为0 | 2018年 | E,F | ||
| 其他类型土地 | 其他类型土地植被当年生物量碳源或碳汇设为0 | 2018年 | 土壤调查 库—差别法 | 1979—1985年 2010—2018年 | B,C,D,E | ||
注:A为广东省第四次森林资源二类资源调查数据库(2013—2016年部分试点地市、2017—2018年全省域);B为全国第二次土壤普查数据广东部分(1979—1985年);C为中国高分辨率国家土壤信息格网基本属性数据集广东部分(2010—2018年);D为1979年广东省土地利用分类图;E为2018年广东省土地利用分类图;F为2020年广东省土地利用分类图。 |
表2 广东省LULUCF生物量碳核算方法及相关参数Tab. 2 Accounting for annual biomass carbon change caused by LULUCF in Guangdong: Techniques and parameters |
| 碳核算公式及参数 | 用地类 | |||||
|---|---|---|---|---|---|---|
| 林地、湿地 | 林地转建设用地 | 草地转建设用地 | 耕地转建设用地 | 耕地转林地 | 耕地、草地、建设用地、其他 | |
| 公式(11) | 公式(8) | 公式(8) | 公式(8) | 公式(8) | 0 | |
| 0 | 0 | 0 | 公式(3)、(4) | |||
| 公式(3)(4) | 公式(3)、(4) | 公式(3)、(4) | 公式(3)、(4) | |||
| DryBiomass | 林地:公式(5) | 草地:公式(5) | 耕地:DryBiomass=10 | 耕地:DryBiomass=10;林地:公式(5) | ||
| BioMassAB | 公式(6) | 林地:公式(6) | 草地:按优势种取值,见表2 | 林地:公式(9) | ||
| Vol | 公式(7) | 林地:公式(7) | ||||
| B | 公式(9) | 按广东全树种均值取值,见表2 | ||||
| VegaAge | 林业小班变量 | VegaAge= =2 | ||||
| R | 若BioMassAB<125,R=0.2;若BioMassAB≥125,R=0.24 | 若BioMassAB<125,R=0.2;若BioMassAB≥125,R=0.24 | 1.6 | 0.2 | ||
| CF | 0.47 | 0.47 | 0.47 | 0.47 | 0.47 | |
| BCEFS | 若Vol≤20,BCEFS=2.0;若21≤Vol≤40,BCEFS=1.0;若41≤Vol≤80,BCEFS=0.6;若Vol>80,BCEFS=0.4 | 若Vol≤20,BCEFS=2.0;若21≤Vol≤40,BCEFS=1.0;若41≤Vol≤80,BCEFS=0.6;若Vol>80,BCEFS=0.4 | ||||
| Outp | 63% | 63% | ||||
注:DryBiomass、R、CF、BCEFS等值参考了《IPCC国家温室气体清单指南》2006年版与2019年版;B值参考广东省本土化的植被异速生长建模结果及第四次森林二类调查均值(表2);Outp取值参考广东省森林资源调查常用数表、国务院批转国家林业局关于各地区年森林采伐限额审核意见国发〔2005〕41号;VegaAge、Treespec、Hight、Diameter等变量数值来源于广东省第四次森林二类调查结果;BioMassAB的计算需要参考广东省森林资源调查常用数表(如广东省各林种的二元立木材积表)。 |
表3 按照植被优势种汇总的地上植被生物量密度均值与植被平均年龄的关系Tab. 3 Relationships between average above-ground biomass density and vegetation age summarized by dominant species |
| 植被优势种(组) | 拟合公式或调查统计值(t hm-2) | R2 | B值 |
|---|---|---|---|
| 杉木 | BioMassAB=19.31×ln(VegaAge)-7.42 | 0.74 | 19.31 |
| 马尾松(广东松) | BioMassAB=12.48×ln(VegaAge)-2.31 | 0.86 | 12.48 |
| 湿地松(国外松) | BioMassAB=11.65×ln(VegaAge)+3.88 | 0.78 | 11.65 |
| 黎蒴 | BioMassAB=7.45×ln(VegaAge)+17.87 | 0.48 | 7.45 |
| 木麻黄 | BioMassAB=10.09×ln(VegaAge)+9.40 | 0.49 | 10.09 |
| 速生相思 | BioMassAB=9.30×ln(VegaAge)+14.30 | 0.52 | 9.30 |
| 阔叶混交林 | BioMassAB=11.10×ln(VegaAge)+1.73 | 0.75 | 11.10 |
| 针阔混交林 | BioMassAB=15.77×ln(VegaAge)-9.68 | 0.72 | 15.77 |
| 针叶混交林 | BioMassAB=15.17×ln(VegaAge)-5.91 | 0.82 | 15.17 |
| 其它林产化工树 | BioMassAB=18.37×ln(VegaAge)-12.45 | 0.84 | 18.37 |
| 其它软阔 | BioMassAB=13.30×ln(VegaAge)-4.42 | 0.69 | 13.30 |
| 其它硬阔 | BioMassAB=13.70×ln(VegaAge)-7.54 | 0.75 | 13.70 |
| 其他无确定树种(广东全树种均值) | BioMassAB=10.39×ln(VegaAge)+3.45 | 0.63 | 10.39 |
| 湿地植被组合(沿海防护林、湿地红树林) | BioMassAB=15.48×ln(VegaAge)+12.14 | 0.43 | 15.48 |
| 草本(综合) | BioMassAB=2.25 | 调查均值 | |
| 芒箕 | BioMassAB=4.79 | 调查均值 | |
| 蕨类 | BioMassAB=2.79 | 调查均值 | |
| 大芒 | BioMassAB=4.70 | 调查均值 | |
| 小芒 | BioMassAB=3.31 | 调查均值 | |
| 杂草 | BioMassAB=2.00 | 调查均值 |
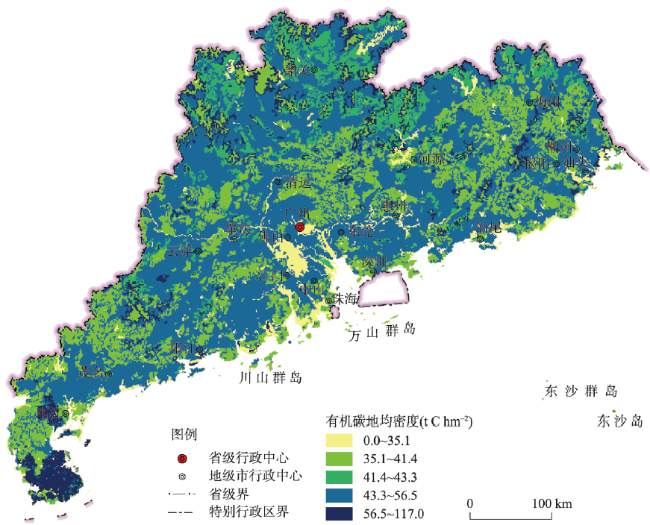
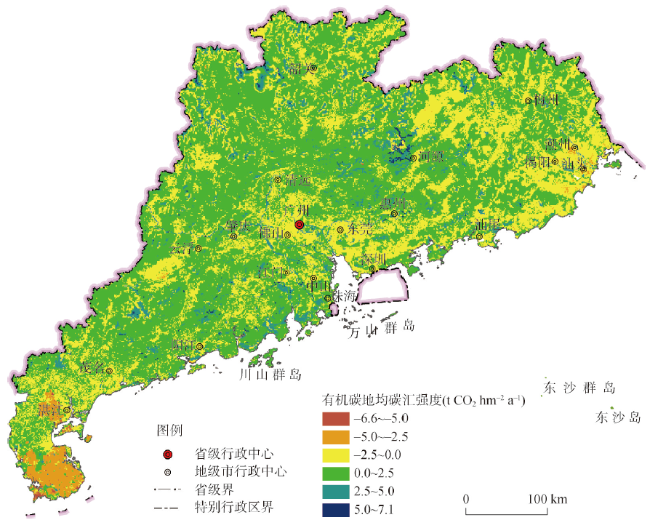
图2 1979—1985年广东省表层土壤有机碳地均密度注:基于自然资源部标准地图服务网站审图号为GS(2019)3333号的标准地图制作,底图边界无修改。 Fig. 2 Average organic carbon stock per hectare of top soil in Guangdong from 1979 to 1985 |
表4 2018—2020年广东省LULUCF的生物量年均碳汇量(万t CO2 a-1)及面积(万hm2)Tab. 4 Annual averages of biomass carbon sinks (10 thousand tons of CO2 per year) and their areas (10 thousand hectares) caused by LULUCF in Guangdong from 2018 to 2020 |
| 统计区 | 林地 | 湿地 | 林地转建设用地 | 草地转建设用地 | 耕地转林地 | 耕地转建设用地 | ||||||||||||||||
|---|---|---|---|---|---|---|---|---|---|---|---|---|---|---|---|---|---|---|---|---|---|---|
| 碳汇 | 面积 | 碳汇 | 面积 | 碳汇 | 面积 | 碳汇 | 面积 | 碳汇 | 面积 | 碳汇 | 面积 | |||||||||||
| 广州市 | 43.3 | 22.1 | 0.03 | 0.01 | -15.3 | 0.6 | -0.2 | 0.02 | 13.4 | 2.8 | -23.4 | 1.4 | ||||||||||
| 韶关市 | 337.6 | 110.3 | 0.03 | 0.03 | -27.5 | 0.3 | -0.5 | 0.05 | 36.9 | 7.7 | -12.3 | 0.7 | ||||||||||
| 深圳市 | 6.9 | 4.7 | 0.00 | 0.00 | -8.3 | 0.3 | -0.1 | 0.01 | 1.4 | 0.3 | -2.3 | 0.2 | ||||||||||
| 珠海市 | 3.9 | 3.2 | 0.01 | 0.01 | -5.2 | 0.2 | -0.3 | 0.03 | 1.2 | 0.2 | -2.9 | 0.2 | ||||||||||
| 汕头市 | 6.7 | 2.9 | 0.02 | 0.06 | -0.8 | 0.1 | -0.3 | 0.03 | 2.6 | 0.5 | -10.2 | 0.6 | ||||||||||
| 佛山市 | 16.9 | 5.1 | 0 | 0.02 | -3.3 | 0.2 | 0.0 | 0.00 | 4.0 | 0.8 | -16.3 | 1.0 | ||||||||||
| 江门市 | 107.2 | 31.7 | 0.04 | 0.08 | -26.3 | 0.5 | -0.3 | 0.03 | 23.9 | 5.0 | -18.8 | 1.1 | ||||||||||
| 湛江市 | 63.9 | 11.7 | 0.41 | 0.9 | -9.3 | 0.4 | -0.1 | 0.01 | 51.0 | 10.6 | -36.9 | 2.2 | ||||||||||
| 茂名市 | 113.1 | 43.4 | 0.07 | 0.22 | -7.3 | 0.5 | -0.1 | 0.01 | 37.4 | 7.8 | -27.5 | 1.6 | ||||||||||
| 肇庆市 | 263.3 | 73.6 | 0.01 | 0.02 | -99.1 | 0.4 | -0.2 | 0.02 | 24.9 | 5.2 | -10.7 | 0.6 | ||||||||||
| 惠州市 | 169.6 | 57.7 | 0.01 | 0.01 | -33.1 | 0.6 | -0.4 | 0.04 | 23.5 | 4.9 | -17.6 | 1.0 | ||||||||||
| 梅州市 | 248.2 | 95.2 | 0.00 | 0.01 | -12.0 | 0.3 | -0.4 | 0.04 | 34.8 | 7.3 | -9.0 | 0.5 | ||||||||||
| 汕尾市 | 49.8 | 14.8 | 0.03 | 0.2 | -2.5 | 0.1 | -0.9 | 0.09 | 7.9 | 1.6 | -6.1 | 0.4 | ||||||||||
| 河源市 | 282.6 | 98.4 | 0.03 | 0.02 | -7.3 | 0.3 | -0.3 | 0.03 | 32.1 | 6.7 | -4.7 | 0.3 | ||||||||||
| 阳江市 | 91.8 | 33.0 | 0.06 | 0.21 | -20.7 | 0.3 | -0.2 | 0.02 | 21.8 | 4.6 | -11.7 | 0.7 | ||||||||||
| 清远市 | 302.3 | 102.4 | 0.04 | 0.05 | -17.5 | 0.4 | -0.5 | 0.05 | 43.1 | 9.0 | -16.6 | 1 | ||||||||||
| 东莞市 | 4.7 | 3.0 | 0.00 | 0.00 | -6.0 | 0.4 | -0.3 | 0.03 | 1.0 | 0.2 | -5.5 | 0.3 | ||||||||||
| 中山市 | 2.8 | 2.4 | 0.00 | 0.00 | -5.5 | 0.2 | -0.1 | 0.01 | 0.8 | 0.2 | -5.5 | 0.3 | ||||||||||
| 潮州市 | 30.2 | 11.0 | 0.00 | 0.02 | -1.6 | 0.1 | -0.2 | 0.02 | 6.6 | 1.4 | -8.2 | 0.5 | ||||||||||
| 揭阳市 | 55.7 | 16.5 | 0.01 | 0.01 | -5.7 | 0.2 | -0.4 | 0.04 | 11.3 | 2.4 | -15.5 | 0.9 | ||||||||||
| 云浮市 | 120.2 | 41.8 | 0.00 | 0.00 | -7.2 | 0.3 | -0.3 | 0.03 | 17.7 | 3.7 | -9.2 | 0.6 | ||||||||||
| 广东省 | 2320.9 | 785.3 | 0.80 | 1.88 | -321.5 | 6.6 | -6.1 | 0.61 | 397.4 | 82.9 | -271 | 15.8 | ||||||||||
注:碳汇数值若为负值,则LULUCF是碳排放源。 |
表5 1979—2018年广东省土地利用类型不变的地类土壤有机碳年均碳汇量(万 t CO2 a-1)及面积(万 hm2)Tab. 5 Annual averages of soil carbon sinks (10 thousand tons of CO2 per year) and their areas (10 thousand hectares) caused by long-term land use in Guangdong from 1979 to 2018 |
| 统计区 | 林地 | 耕地 | 草地 | 建设用地 | 湿地 | |||||||||||||
|---|---|---|---|---|---|---|---|---|---|---|---|---|---|---|---|---|---|---|
| 碳汇 | 面积 | 碳汇 | 面积 | 碳汇 | 面积 | 碳汇 | 面积 | 碳汇 | 面积 | |||||||||
| 广州市 | 29.3 | 19.9 | 3.9 | 13.6 | 0.1 | 0.1 | 1.0 | 2.7 | 0.00 | 0.00 | ||||||||
| 韶关市 | 98.8 | 100.0 | 1.7 | 14.6 | 0.9 | 2.3 | -0.3 | 0.5 | 0.00 | 0.01 | ||||||||
| 深圳市 | 4.8 | 4.4 | 0.1 | 0.5 | 0.0 | 0.0 | -1.6 | 2.0 | 0.00 | 0.00 | ||||||||
| 珠海市 | 2.0 | 2.2 | 3.6 | 3.0 | 0.0 | 0.0 | -0.1 | 0.4 | 0.00 | 0.00 | ||||||||
| 汕头市 | 1.0 | 2.3 | -5.3 | 5.3 | 0.0 | 0.4 | -0.9 | 0.6 | 0.00 | 0.03 | ||||||||
| 佛山市 | 4.3 | 4.6 | 0.5 | 6.2 | 0.0 | 0.0 | -1.1 | 1.8 | 0.01 | 0.01 | ||||||||
| 江门市 | 34.7 | 28.0 | 10.5 | 15.2 | 0.1 | 0.3 | -0.4 | 0.9 | 0.00 | 0.02 | ||||||||
| 湛江市 | -3.0 | 7.5 | -36.3 | 42.5 | 0.0 | 0.1 | -1.1 | 1.1 | 0.02 | 0.26 | ||||||||
| 茂名市 | 40.9 | 38.3 | 3.8 | 16.5 | 0.4 | 0.4 | -0.5 | 0.9 | 0.01 | 0.12 | ||||||||
| 肇庆市 | 59.7 | 69.4 | 1.7 | 9.9 | 0.1 | 0.4 | -0.2 | 0.4 | 0.00 | 0.00 | ||||||||
| 惠州市 | 67.4 | 54.0 | 2.8 | 15.6 | 0.1 | 0.3 | -0.7 | 1.1 | 0.00 | 0.00 | ||||||||
| 梅州市 | 46.0 | 87.4 | -2.3 | 9.8 | 0.2 | 2.0 | -0.4 | 0.4 | 0.00 | 0.02 | ||||||||
| 汕尾市 | 10.9 | 13.0 | 0.7 | 7.9 | -0.9 | 3.7 | -0.3 | 0.2 | 0.08 | 0.13 | ||||||||
| 河源市 | 82.4 | 91.2 | -2.1 | 6.6 | 0.3 | 1.2 | -0.3 | 0.2 | 0.00 | 0.00 | ||||||||
| 阳江市 | 37.9 | 29.3 | 4.5 | 13.1 | 0.2 | 0.3 | -0.4 | 0.4 | 0.00 | 0.08 | ||||||||
| 清远市 | 104.9 | 93.2 | 5.5 | 19.3 | 3.0 | 4.0 | -0.2 | 0.5 | 0.01 | 0.02 | ||||||||
| 东莞市 | 2.5 | 2.5 | -0.1 | 1.2 | 0.0 | 0.1 | -1.7 | 1.8 | 0.00 | 0.00 | ||||||||
| 中山市 | 2.1 | 2.0 | 3.1 | 3.9 | 0.0 | 0.0 | -0.3 | 0.7 | 0.00 | 0.00 | ||||||||
| 潮州市 | 2.1 | 9.1 | -5.1 | 5.5 | -0.1 | 0.4 | -0.5 | 0.3 | 0.01 | 0.01 | ||||||||
| 揭阳市 | 10.1 | 14.6 | -7.6 | 12.7 | 0.0 | 0.8 | -0.6 | 0.4 | 0.00 | 0.00 | ||||||||
| 云浮市 | 38.0 | 38.5 | -1.7 | 7.4 | -0.3 | 0.8 | -0.2 | 0.3 | 0.00 | 0.00 | ||||||||
| 广东省 | 676.8 | 711.4 | -18.1 | 230.3 | 4.1 | 17.6 | -10.8 | 17.6 | 0.13 | 0.71 | ||||||||
注:碳汇数值若为负值,则土地利用是碳排放源。 |
表6 2018年度广东省土地利用及其变化和林业碳汇年均值Tab. 6 Annual averages of carbon sinks caused by LULUCF in Guangdong in 2018 |
| 碳核算类别 | 面积 (万 hm2) | 生物量碳汇 (万 t CO2 a-1) | 土壤碳汇 (万 t CO2 a-1) | 总碳汇 (万 t CO2 a-1) | 地均碳汇强度 (t CO2 hm-2 a-1) | |
|---|---|---|---|---|---|---|
| 林地 | 生物量 | 785.3 | 2320.9 | - | 2997.7 | 3.9 |
| 土壤有机碳 | 711.4 | - | 676.8 | |||
| 湿地 | 生物量 | 1.9 | 0.8 | - | 0.9 | 0.6 |
| 土壤有机碳 | 0.7 | - | 0.1 | |||
| 耕地 | 230.3 | 0.0 | -18.1 | -18.1 | -0.1 | |
| 草地 | 17.6 | 0.0 | 4.1 | 4.1 | 0.2 | |
| 建设用地 | 17.6 | 0.0 | -10.8 | -10.8 | -0.6 | |
| 林地转建设用地 | 6.6 | -321.5 | 0.0 | -321.5 | -48.7 | |
| 草地转建设用地 | 0.6 | -6.1 | 0.0 | -6.1 | -10.0 | |
| 耕地转林地 | 82.9 | 397.4 | 0.0 | 397.4 | 4.8 | |
| 耕地转建设用地 | 15.8 | -271.0 | 0.0 | -271.0 | -17.2 | |
| 其他类型土地 | 707.3 | 0.0 | 194.7 | 194.7 | 0.3 | |
| LULUCF汇总 | 1790.8 | 2120.5 | 846.8 | 2967.3 | 1.7 | |
注:碳汇数值若为负值,则LULUCF是碳排放源。 |
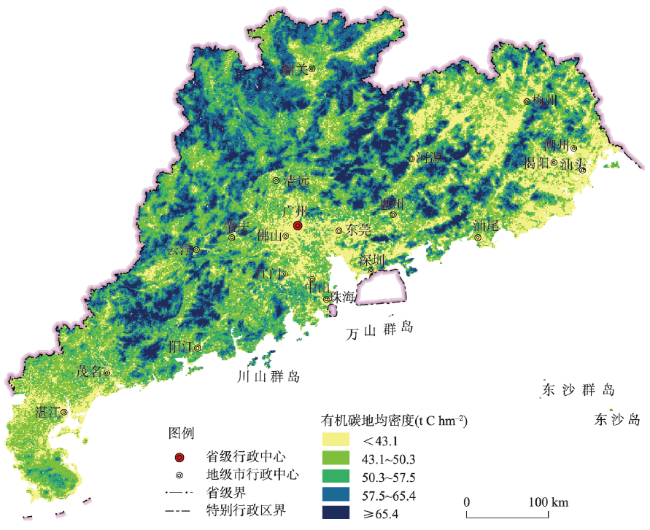
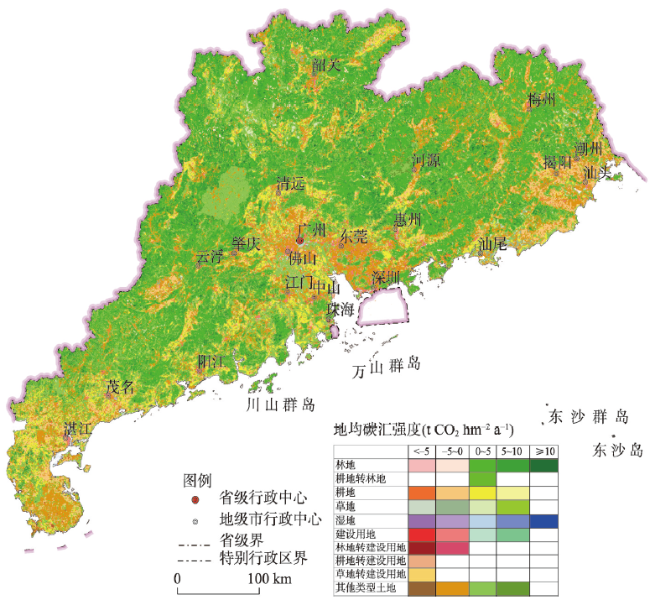
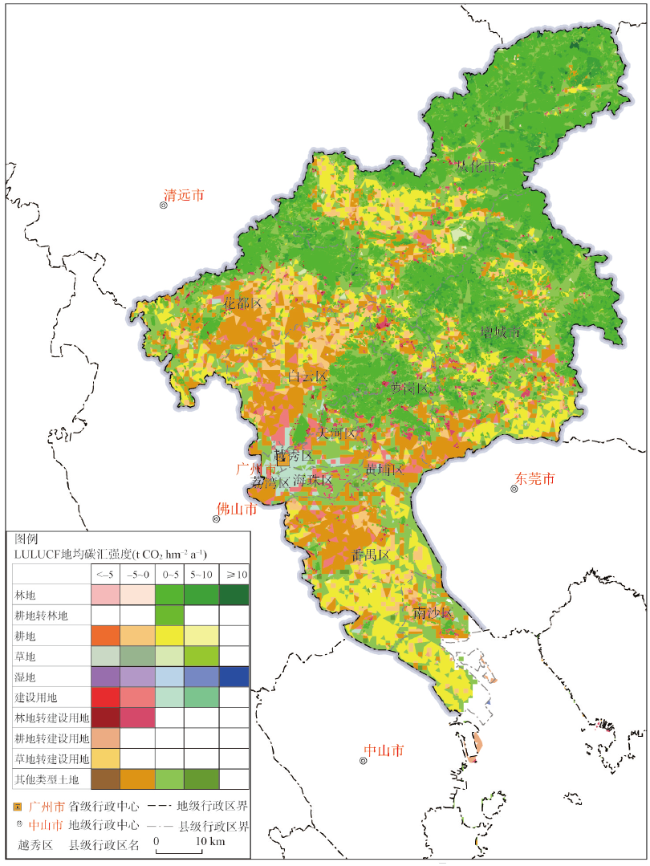
图5 2018年广东LULUCF地均碳汇强度注:基于自然资源部标准地图服务网站审图号为GS(2019)3333号的标准地图制作,底图无修改;若地均碳汇强度为负,即LULUCF是碳排放源。 Fig. 5 Carbon sinks per hectare of each subcategory of LULUCF in Guangdong in 2018 |
表7 2018年度广东省各地市主要土地利用及其变化和林业地均碳汇强度(t CO2 hm-2 a-1)Tab. 7 Carbon sinks per hectare of the major subcategories of LULUCF in each city of Guangdong in 2018 (t CO2 hm-2 a-1) |
| 统计区 | 林地 | 湿地 | 耕地 | 草地 | 建设用地 | 林地转建设用地 |
|---|---|---|---|---|---|---|
| 广州市 | 3.4 | 3.0 | 0.3 | 1.0 | 0.4 | -25.5 |
| 韶关市 | 4.0 | 1.1 | 0.1 | 0.4 | -0.6 | -91.7 |
| 深圳市 | 2.6 | 0.0 | 0.2 | 0.0 | -0.8 | -27.7 |
| 珠海市 | 2.1 | 0.0 | 1.2 | 0.0 | -0.3 | -26.0 |
| 汕头市 | 2.7 | 0.3 | -1.0 | 0.0 | -1.5 | -8.0 |
| 佛山市 | 4.2 | 0.8 | 0.1 | 0.0 | -0.6 | -16.5 |
| 江门市 | 4.6 | 0.6 | 0.7 | 0.3 | -0.4 | -52.6 |
| 湛江市 | 5.1 | 0.5 | -0.9 | 0.0 | -1.0 | -23.3 |
| 茂名市 | 3.7 | 0.4 | 0.2 | 1.0 | -0.6 | -14.6 |
| 肇庆市 | 4.4 | 0.5 | 0.2 | 0.3 | -0.5 | -247.8 |
| 惠州市 | 4.2 | 0.0 | 0.2 | 0.3 | -0.6 | -55.2 |
| 梅州市 | 3.1 | 0.2 | -0.2 | 0.1 | -1.0 | -40.0 |
| 汕尾市 | 4.2 | 0.7 | 0.1 | -0.2 | -1.5 | -25.0 |
| 河源市 | 3.8 | 1.5 | -0.3 | 0.3 | -1.5 | -24.3 |
| 阳江市 | 4.1 | 0.3 | 0.3 | 0.7 | -1.0 | -69.0 |
| 清远市 | 4.1 | 1.2 | 0.3 | 0.8 | -0.4 | -43.8 |
| 东莞市 | 2.6 | 0.0 | -0.1 | 0.0 | -0.9 | -15.0 |
| 中山市 | 2.2 | 0.0 | 0.8 | 0.0 | -0.4 | -27.5 |
| 潮州市 | 3.0 | 0.6 | -0.9 | -0.3 | -1.7 | -16.0 |
| 揭阳市 | 4.1 | 1.0 | -0.6 | 0.0 | -1.5 | -28.5 |
| 云浮市 | 3.9 | 0.0 | -0.2 | -0.4 | -0.7 | -24.0 |
| 广东省 | 3.9 | 0.6 | -0.1 | 0.2 | -0.6 | -48.7 |
注:碳汇数值若为负值,则LULUCF是碳排放源。 |
| [1] |
The Intergovernmental Panel on Climate Change. Revised 1996 IPCC guidelines for national greenhouse gas inventories. https://www.ipcc-nggip.iges.or.jp/public/gl/invs1.html, 2021-01-01.
|
| [2] |
The Intergovernmental Panel on Climate Change. 2006 IPCC guidelines for national greenhouse gas inventories. https://www.ipcc-nggip.iges.or.jp/public/2006gl/index.html 2021-01-01.
|
| [3] |
The Intergovernmental Panel on Climate Change. 2019 Refinement to the 2006 IPCC guidelines for national greenhouse gas inventories. https://www.ipcc-nggip.iges.or.jp/public/2019rf/index.html, 2021-01-01.
|
| [4] |
[潘竟虎, 张永年. 中国能源碳足迹时空格局演化及脱钩效应. 地理学报, 2021, 76(1): 206-222.]
|
| [5] |
[赵荣钦, 余娇, 肖连刚, 等. 基于“水—能—碳”关联的城市水系统碳排放研究. 地理学报, 2021, 76(12): 3119-3134.]
|
| [6] |
[马立, 王璟煦, 张迪迪, 等. 高时空分辨率FFCO2排放清单的构建方法及研究展望. 地理学报, 2022, 77(3): 650-664.]
|
| [7] |
[方恺, 何坚坚, 张佳琪. 博台线作为中国区域发展均衡线的佐证分析: 以城市温室气体排放为例. 地理学报, 2021, 76(12): 3090-3102.]
|
| [8] |
The Intergovernmental Panel on Climate Change. Climate change and land: An IPCC special report on climate change, desertification, land degradation, sustainable land management, food security, and greenhouse gas fluxes in terrestrial ecosystems. https://www.ipcc.ch/srccl/chapter/summary-for-policymakers/, 2020-01-01.
|
| [9] |
The Secretariat of the United Nations Framework Convention on Climate Change. "GHG profiles" for individual annex I and non-annex I parties. https://di.unfccc.int/ghg_profile_annex1, 2021-06-01.
|
| [10] |
|
| [11] |
|
| [12] |
[徐新良, 曹明奎, 李克让. 中国森林生态系统植被碳储量时空动态变化研究. 地理科学进展, 2007, 26(6): 1-10.]
|
| [13] |
|
| [14] |
|
| [15] |
|
| [16] |
|
| [17] |
|
| [18] |
|
| [19] |
[曹先磊, 张颖. 云南思茅松碳汇造林项目减排量、经济价值及其敏感性分析. 生态环境学报, 2017, 26(2): 234-242.]
|
| [20] |
[冯源, 肖文发, 朱建华, 等. 造林对区域森林生态系统碳储量和固碳速率的影响. 生态与农村环境学报, 2020, 36(3): 281-290.]
|
| [21] |
[李宸宇, 朱建华, 张峰, 等. 基于NbS的北京市乔木林固碳能力分析. 北京林业大学学报, 2021, 43(6): 13-22.]
|
| [22] |
[罗文蓉, 胡国铮, 高清竹. 草地生态管理下内蒙古草地土壤有机碳库动态研究. 生态与农村环境学报, 2020, 36(12): 1588-1597.]
|
| [23] |
[张庶, 金晓斌, 杨绪红, 等. 农用地整治项目的碳效应分析与核算研究. 资源科学, 2016, 38(1): 93-101.]
|
| [24] |
[王永志, 刘胜林. 黄河三角洲芦苇湿地生态系统碳通量动态特征及其影响因素. 生态环境学报, 2021, 30(5): 949-956.]
|
| [25] |
[郭晓敏, 揣小伟, 张梅, 等. 扬子江城市群土地利用时空变化及其对陆地生态系统碳储量的影响. 长江流域资源与环境, 2019, 28(2): 269-280.]
|
| [26] |
[魏燕茹, 陈松林. 福建省土地利用碳排放空间关联性与碳平衡分区. 生态学报, 2021, 41(14): 5814-5824.]
|
| [27] |
[郑永超, 文琦. 宁夏自治区土地利用变化及碳排放效应. 水土保持研究, 2020, 27(1): 207-212.]
|
| [28] |
[杨皓然, 吴群. 不同政策方案下的南京市土地利用碳排放动态模拟. 地域研究与开发, 2021, 40(3): 121-126.]
|
| [29] |
[朱文博, 张静静, 崔耀平, 等. 基于土地利用变化情景的生态系统碳储量评估: 以太行山淇河流域为例. 地理学报, 2019, 74(3): 446-459.]
|
| [30] |
[揣小伟, 黄贤金, 郑泽庆, 等. 江苏省土地利用变化对陆地生态系统碳储量的影响. 资源科学, 2011, 33(10): 1932-1939.]
|
| [31] |
[邓祥征, 蒋思坚, 李星, 等. 区域土地利用影响地表CO2浓度异质性特征的动力学机制. 地理学报, 2022, 77(4): 936-946.]
|
| [32] |
Ministry of Ecology and Environment of the People's Republic of China. The People's Republic of China Third national communication on climate change. https://www.mee.gov.cn/ywgz/ydqhbh/wsqtkz/201907/P020190701762678052438.pdf, 2019-07-01.
[中国生态环境部. 中华人民共和国气候变化第三次国家信息通报. https://www.mee.gov.cn/ywgz/ydqhbh/wsqtkz/201907/P020190701762678052438.pdf, 2019-07-01.]
|
| [33] |
National Development and Reform Commission of China. Guidelines for greenhouse gas inventories at the provincial level of China. http://gxdtrc.cn/h-nd-217.html, 2021-09-24.
[国家发展改革委. 省级温室气体清单编制指南(试行). http://gxdtrc.cn/h-nd-217.html, 2021-09-24.]
|
| [34] |
[杨超, 张少伟, 陈万旭, 等. 广东省土地利用结构信息熵时空演变特征分析. 水土保持研究, 2021, 28(6): 251-259.]
|
| [35] |
[陈光荣. 广东自然资源年鉴. https://data.cnki.net/Yearbook/Single/N2021070167, 2021-06-01.]
|
| [36] |
[徐新良, 刘纪远, 张树文, 等. 中国多时期土地利用土地覆被遥感监测数据集(CNLUCC). https://www.resdc.cn/data.aspx?DATAID=264, 2021-06-01.]
|
| [37] |
|
| [38] |
[刘峰, 张甘霖. 中国高分辨率国家土壤信息格网基本属性数据集(2010—2018). http://soil.geodata.cn, 2021-01-01.]
|
| [39] |
Guangdong Forestry Survey and
[广东省林业调查规划院. 广东省主要树种二元立木材积表. https://www.renrendoc.com/paper/179392716.html, 2021-12-27.]
|
| [40] |
[蔡伟祥, 徐丽, 李明旭, 等. 2010—2060年中国森林生态系统固碳速率省际不平衡性及调控策略. 地理学报, 2022, 77(7): 1808-1820.]
|
| [41] |
|
| [42] |
[戴尔阜, 翟瑞雪, 葛全胜, 等. 1980s—2010s内蒙古草地表层土壤有机碳储量及其变化. 地理学报, 2014, 69(11): 1651-1660.]
|
| [43] |
[贾黎黎, 朱鑫, 赵艺, 等. 雷州半岛土壤碳储量及其有机碳时空变化规律. 华南地质与矿产, 2019, 35(3): 373-379.]
|
| [44] |
[胡子健. 中国城市建设统计年鉴. 北京: 中国统计出版社, 2019: 613-630.]
|
| [45] |
[张俊华, 朱连奇, 李国栋, 等. 中国南北过渡带土壤碳氮空间特征及暖温带与亚热带界限. 地理学报, 2021, 76(9): 2269-2282.]
|
| [46] |
|
| [47] |
[崔耀平, 李楠, 付一鸣, 等. 中美俄加陆域碳汇对人为增温的消减贡献. 地理学报, 2021, 76(1): 167-177.]
|
| [48] |
[朱建佳, 戴尔阜, 郑度, 等. 采伐影响下人工林木材生产与固碳功能权衡特征: 以湖南会同森林生态实验站为例. 地理学报, 2018, 73(1): 152-163.]
|
/
| 〈 |
|
〉 |