
Evolution of the global semiconductor trade geography and its dependencies
Received date: 2021-11-02
Revised date: 2022-06-14
Online published: 2023-02-16
Supported by
National Natural Science Foundation of China(42130712)
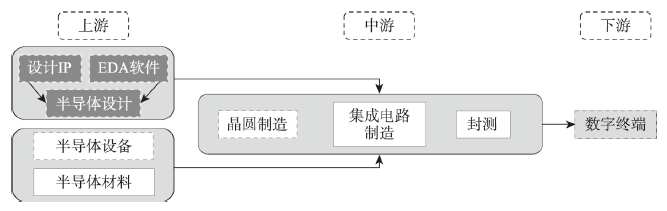
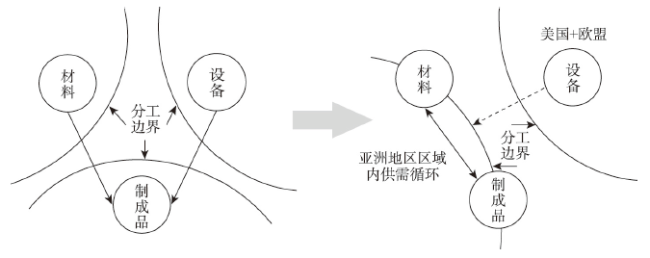
The semiconductor industry has the typical characteristics of an international division of labor and shows significant structural differences in global trade in the key product chain. The evolution of cross-border trade flows and dependencies, as well as trade organization patterns in semiconductor manufactured goods, key equipment, and materials, are investigated by constructing a global matrix of semiconductor trade relations and using the Gini Coefficient and Trade Dependency Index. The study found that: (1) The geography of global semiconductor trade is extremely unbalanced, trade-in materials and equipment are highly concentrated in a few countries on both the supply and demand sides. (2) China has replaced the US as the world's largest semiconductor trade player and, together with other Asian regions, has shaped the regionalized system in the trade of manufactured goods and materials, but there is a high dependence on Europe and the US for equipment. (3) The semiconductor production model has promoted the regionalization of the East Asia-Southeast Asia region in the trade of manufactured goods and materials, and developed countries such as the US, the EU and Japan, and South Korea have maintained their monopolistic advantage in the trade of semiconductor equipment by building exclusive innovation networks and establishing trade barriers. The monopolistic nature of the semiconductor equipment trade and the regionalization of manufactured goods and materials have formed the characteristics of the global semiconductor trade and will be further strengthened in the future.
REN Yawen , YANG Yu , WANG Yun , LIU Yi . Evolution of the global semiconductor trade geography and its dependencies[J]. Acta Geographica Sinica, 2023 , 78(2) : 371 -385 . DOI: 10.11821/dlxb202302007
表1 国际贸易中半导体关键产品的基本属性Tab. 1 Key commodity attributes of semiconductors in international trade |
| 产品大类 | 中文名称 | HS编码 | 产品内容 |
|---|---|---|---|
| 半导体制成品 | 集成电路器件 | 8541 | 二极管、晶体管、类似的半导体器件,包括组装或未组装在模块或面板中的发光二极管(LED)、安装的压电晶体 |
| 集成电路与微电子组件 | 8542 | 电子集成电路 | |
| 半导体制造关键设备 | 光刻机/ | 848620 | 单独或主要用于制造半导体晶锭或晶片、半导体器件、电子集成电路或平板显示器的机器和设备 |
| 刻蚀机 | 848620 | ||
| 离子注入机 | 848620/854311 | ||
| 半导体制造材料 | 印刷电路板 | 8534 | 印刷电路 |
| 硅晶圆 | 3818 | 掺杂用于电子产品的化学元素,以圆盘、晶片或类似形式;掺杂用于电子产品的化合物,包括氮化镓晶片、硅晶片 | |
| 硅原料 | 280461 | 硅;按重量计含硅不少于99.99% | |
| 硅原料 | 280469 | 硅;含硅重量低于99.99% | |
| 光刻胶 | 370710 | 用于集成电路和半导体分立器件,曝光微影制程 | |
| 电子气体 | 280429 | 半导体生产用稀有气体 | |
| 电子特种气体 | 280430 | 半导体生产用氮气 |
表2 1999年、2009年和2019年全球半导体贸易基尼系数统计Tab. 2 Gini coefficient of global semiconductor trade in 1999, 2009 and 2019 |
| 1999年 | 2009年 | 2019年 | ||||||
|---|---|---|---|---|---|---|---|---|
| 出口 | 进口 | 出口 | 进口 | 出口 | 进口 | |||
| 制成品 | 0.9501 | 0.9301 | 0.9445 | 0.9326 | 0.9473 | 0.9323 | ||
| 制造材料 | 0.9354 | 0.9164 | 0.9458 | 0.9278 | 0.9472 | 0.9222 | ||
| 制造设备 | 0.9878 | 0.9698 | 0.9740 | 0.9654 | 0.9739 | 0.9739 | ||
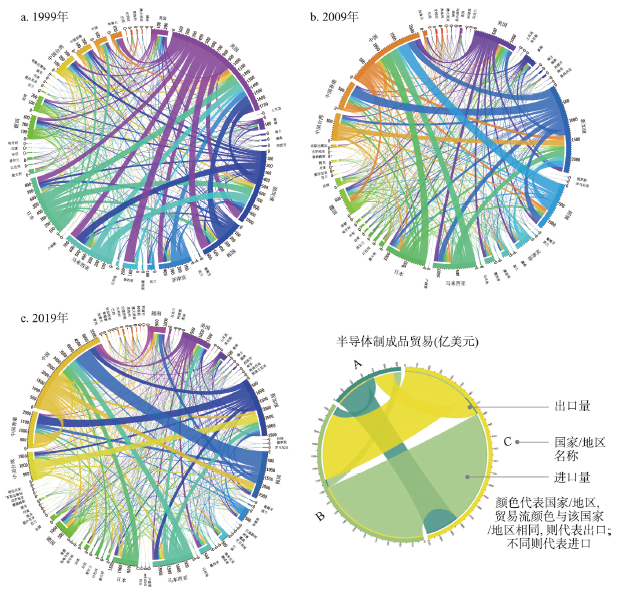
图2 1999年、2009年和2019年全球半导体制成品贸易格局Fig. 2 Global trade flow of semiconductor manufactures in 1999, 2009 and 2019 |
表3 全球主要国家或地区半导体制成品贸易量及其比重变化Tab. 3 Changes in the trade value and proportion of semiconductor manufacturers in key countries and regions |
| 国家或 地区 | 1999年 | 2009年 | 2019年 | |||||||||||
|---|---|---|---|---|---|---|---|---|---|---|---|---|---|---|
| 出口额 | 比重(%) | 进口额 | 比重(%) | 出口额 | 比重(%) | 进口额 | 比重(%) | 出口额 | 比重(%) | 进口额 | 比重(%) | |||
| 中国 | 66.09 | 1.54 | 137.15 | 3.2 | 930.11 | 12.02↑ | 1676.98 | 21.76↑ | 2477.62 | 16.47↑ | 3387.09 | 22.64↑ | ||
| 中国台湾 | 151.04 | 3.52 | 184.98 | 4.31 | 521.37 | 6.74↑ | 267.11 | 3.47↓ | 1337.05 | 8.89↑ | 480.12 | 3.21↓ | ||
| 韩国 | 369.84 | 8.62 | 288.83 | 6.73 | 815.27 | 10.53↑ | 509.4 | 6.61↓ | 2015.63 | 13.4↑ | 831.52 | 5.56↓ | ||
| 美国 | 993.82 | 23.16 | 766.87 | 17.88 | 769.44 | 9.94↓ | 469 | 6.09↓ | 1047.7 | 6.96↓ | 816.28 | 5.46↓ | ||
| 日本 | 622.19 | 14.5 | 255.85 | 5.97 | 792.56 | 10.24 | 355 | 4.61↓ | 1081.27 | 7.19↓ | 474.65 | 3.17↓ | ||
| 德国 | 159.2 | 3.71 | 205.46 | 4.79 | 298.99 | 3.86↑ | 409.21 | 5.31↑ | 526.85 | 3.5↓ | 670.74 | 4.48↓ | ||
| 荷兰 | 48.14 | 1.12 | 71.83 | 1.7 | 105.02 | 1.36↑ | 126.58 | 1.64↓ | 221.52 | 1.47↑ | 336.02 | 2.25↑ | ||
| 英国 | 103.73 | 2.42 | 160.18 | 3.74 | 46.89 | 0.61 | 41.35 | 0.54↓ | 74.84 | 0.5↓ | 74.81 | 0.5↓ | ||
| 马来西亚 | 371.8 | 8.67 | 388.73 | 9.06 | 723.95 | 9.35↑ | 502.58 | 6.52↓ | 1786.5 | 11.87↑ | 757.3 | 5.06↓ | ||
| 新加坡 | 514.33 | 11.99 | 579.8 | 13.52 | 1390.48 | 17.97↑ | 1036.76 | 13.45↓ | 1936.05 | 12.87↓ | 1617.19 | 10.81↓ | ||
注:进出口额单位为亿美元;↓和↑分别代表相比于前一个节点年份进出口贸易额的上升和下降。 |
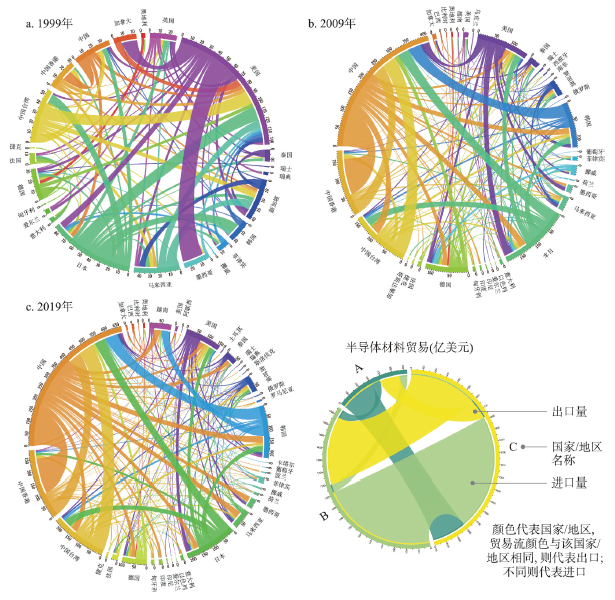
图3 1999年、2009年和2019年全球半导体制造材料贸易格局Fig. 3 Global trade pattern of semiconductor materials in 1999, 2009 and 2019 |
表4 1999年、2009年和2019年全球主要国家或地区半导体材料贸易量及其比重变化Tab. 4 Changes in the trade value and proportion of semiconductor materials in key countries and regions |
| 国家或 地区 | 1999年 | 2009年 | 2019年 | |||||||||||
|---|---|---|---|---|---|---|---|---|---|---|---|---|---|---|
| 出口额 | 比重(%) | 进口额 | 比重(%) | 出口额 | 比重(%) | 进口额 | 比重(%) | 出口额 | 比重(%) | 进口额 | 比重(%) | |||
| 中国 | 27.59 | 6.38 | 20.42 | 4.71 | 277.89 | 26.91↑ | 234.86 | 22.86↑ | 419.98 | 29.7↑ | 270.35 | 19.16↑ | ||
| 中国台湾 | 48.27 | 11.15 | 16.79 | 3.88 | 106.77 | 10.34↓ | 73.8 | 7.18↑ | 151.22 | 10.69↓ | 98.71 | 7.00↓ | ||
| 韩国 | 14.59 | 3.37 | 17.14 | 3.96 | 75.12 | 7.27↑ | 62.07 | 6.04↑ | 132.54 | 9.37↑ | 98.48 | 6.98↑ | ||
| 美国 | 79.14 | 18.29 | 78.98 | 18.24 | 98.16 | 9.51↓ | 71.62 | 6.97↓ | 83.04 | 5.87↓ | 98.22 | 6.96↓ | ||
| 日本 | 71.25 | 16.46 | 26.11 | 6.03 | 136.02 | 13.17↓ | 77.29 | 7.52↑ | 172.44 | 12.20↓ | 66.61 | 4.72↓ | ||
| 德国 | 24.18 | 5.59 | 25.05 | 5.78 | 63.13 | 6.11↑ | 70.74 | 6.88↑ | 58 | 4.10↓ | 64.07 | 4.54↓ | ||
| 荷兰 | 2.46 | 0.57 | 5.54 | 1.28 | 4.79 | 0.46↓ | 8.24 | 0.80↓ | 7.76 | 0.55↑ | 12.30 | 0.87↑ | ||
| 英国 | 14.69 | 3.39 | 22.50 | 5.20 | 11.31 | 1.10↓ | 14.97 | 1.46↓ | 8.49 | 0.60↓ | 16.77 | 1.19↓ | ||
| 马来西亚 | 27.57 | 6.37 | 25.72 | 5.94 | 15.45 | 1.50↓ | 35 | 3.41↓ | 27.5 | 1.94↑ | 66.01 | 4.68↑ | ||
| 新加坡 | 16.4 | 3.79 | 33.28 | 7.68 | 26.01 | 2.52↓ | 30.85 | 3.00↓ | 33.09 | 2.34↓ | 46.20 | 3.27↑ | ||
注:进出口额单位为亿美元;↓和↑分别代表相比于前一个节点年份进出口贸易额的上升和下降。 |
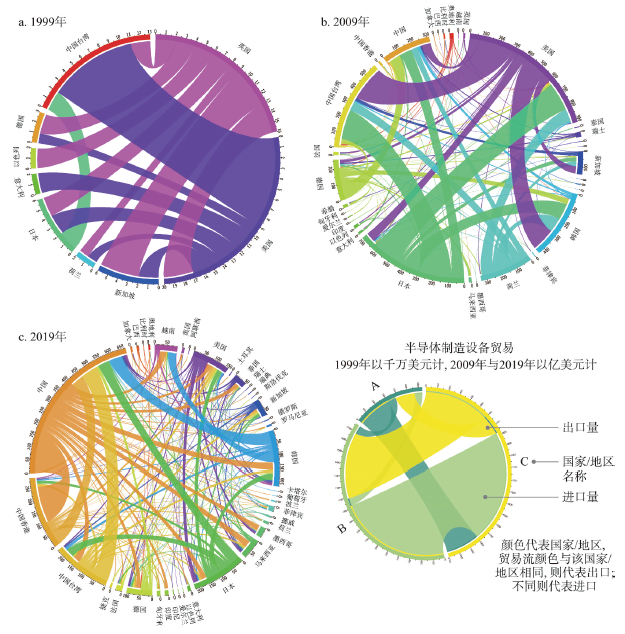
图4 1999年、2009年和2019年全球半导体制造设备贸易格局Fig. 4 Global trade pattern of semiconductor devices in 1999, 2009 and 2019 |
表5 1999年、2009年和2019年全球主要国家或地区半导体设备贸易量及其全球比重变化Tab. 5 Changes in the trade value and proportion of semiconductor devices in key countries and regions |
| 国家或 地区 | 1999年 | 2009年 | 2019年 | |||||||||||
|---|---|---|---|---|---|---|---|---|---|---|---|---|---|---|
| 出口额 | 比重(%) | 进口额 | 比重(%) | 出口额 | 比重(%) | 进口额 | 比重(%) | 出口额 | 比重(%) | 进口额 | 比重(%) | |||
| 中国 | 0 | 0 | 0 | 0 | 1.15 | 0.56↑ | 31.14 | 15.2↑ | 15.34 | 1.84↑ | 216.58 | 25.86↑ | ||
| 中国台湾 | 0 | 0 | 1.24 | 32.46 | 1.87 | 0.91↑ | 57 | 27.83↓ | 17.06 | 2.04↑ | 264.02 | 31.52↑ | ||
| 韩国 | 0 | 0 | 0 | 0 | 4.9 | 2.39↑ | 40.12 | 19.59↑ | 35.74 | 4.28↑ | 105.38 | 12.58↓ | ||
| 美国 | 1.8 | 47 | 0.34 | 8.90 | 61.17 | 29.86 | 31.97 | 15.61↑ | 177.59 | 21.26↓ | 131.13 | 15.66↑ | ||
| 日本 | 0.21 | 5.48 | 0.41 | 10.73 | 63.73 | 31.11↑ | 8.73 | 4.26↓ | 235.79 | 28.23↓ | 39.24 | 4.69↑ | ||
| 德国 | 0.02 | 0.52 | 0.31 | 8.12 | 21.49 | 10.49↑ | 5.72 | 2.79↓ | 21.81 | 2.61↓ | 7.88 | 0.94↓ | ||
| 荷兰 | 0.07 | 1.83 | 0.26 | 6.81 | 33.25 | 16.23↑ | 1.14 | 0.56↓ | 215.49 | 25.80↑ | 4 | 0.48↓ | ||
| 英国 | 1.7 | 44.39 | 0.02 | 0.52 | 1.15 | 0.56↓ | 0.54 | 0.26↓ | 7.8 | 0.93↑ | 1.21 | 0.14↓ | ||
| 马来西亚 | 0 | 0 | 0 | 0 | 0.31 | 0.15↑ | 1.94 | 0.95↑ | 3.26 | 0.39↑ | 6.33 | 0.76↓ | ||
| 新加坡 | 0.01 | 0.26 | 0.68 | 17.8 | 3.32 | 1.62↑ | 11.96 | 5.84↓ | 77.36 | 9.26↑ | 26.59 | 3.17↓ | ||
注:进出口额单位为亿美元;↓和↑分别代表相比于前一个节点年份进出口贸易额的上升和下降。 |
表6 1999年、2009年和2019年全球主要国家或地区间半导体制成品贸易HM指数(前10位)Tab. 6 HM index of semiconductor products trade between key countries or regions (Top 10) |
| 生产地 | 消费地 | 1999年 | 生产地 | 消费地 | 2009年 | 生产地 | 消费地 | 2019年 |
|---|---|---|---|---|---|---|---|---|
| 马来西亚 | 新加坡 | 0.29 | 韩国 | 中国 | 0.36 | 以色列 | 中国 | 0.53 |
| 韩国 | 美国 | 0.28 | 马来西亚 | 中国 | 0.31 | 韩国 | 中国 | 0.45 |
| 中国台湾 | 美国 | 0.25 | 日本 | 中国 | 0.30 | 中国台湾 | 新加坡 | 0.34 |
| 马来西亚 | 美国 | 0.23 | 中国台湾 | 新加坡 | 0.29 | 日本 | 中国 | 0.31 |
| 中国台湾 | 新加坡 | 0.19 | 马来西亚 | 新加坡 | 0.22 | 马来西亚 | 中国 | 0.24 |
| 日本 | 美国 | 0.18 | 韩国 | 新加坡 | 0.19 | 美国 | 中国 | 0.22 |
| 新加坡 | 美国 | 0.18 | 美国 | 中国 | 0.15 | 马来西亚 | 新加坡 | 0.16 |
| 中国 | 美国 | 0.16 | 新加坡 | 中国 | 0.14 | 新加坡 | 中国 | 0.15 |
| 日本 | 新加坡 | 0.16 | 美国 | 马来西亚 | 0.12 | 韩国 | 越南 | 0.11 |
| 新加坡 | 马来西亚 | 0.15 | 德国 | 马来西亚 | 0.11 | 德国 | 中国 | 0.10 |
表7 1999年、2009年和2019年全球主要国家或地区间半导体材料贸易HM指数(前10位)Tab. 7 HM index of semiconductor materials trade between key countries or regions (Top 10) |
| 生产地 | 消费地 | 1999年 | 生产地 | 消费地 | 2009年 | 生产地 | 消费地 | 2019年 |
|---|---|---|---|---|---|---|---|---|
| 韩国 | 美国 | 0.30 | 韩国 | 中国 | 0.45 | 中国台湾 | 中国 | 0.41 |
| 马来西亚 | 美国 | 0.27 | 中国台湾 | 中国 | 0.36 | 韩国 | 中国 | 0.35 |
| 中国台湾 | 美国 | 0.27 | 日本 | 中国 | 0.21 | 日本 | 中国 | 0.23 |
| 马来西亚 | 新加坡 | 0.27 | 新加坡 | 马来西亚 | 0.20 | 马来西亚 | 新加坡 | 0.20 |
| 新加坡 | 马来西亚 | 0.23 | 新加坡 | 韩国 | 0.18 | 新加坡 | 韩国 | 0.19 |
| 新加坡 | 美国 | 0.23 | 美国 | 中国 | 0.17 | 马来西亚 | 中国 | 0.19 |
| 日本 | 美国 | 0.19 | 马来西亚 | 新加坡 | 0.16 | 日本 | 中国台湾 | 0.17 |
| 日本 | 韩国 | 0.14 | 美国 | 日本 | 0.15 | 新加坡 | 中国台湾 | 0.15 |
| 中国 | 美国 | 0.13 | 马来西亚 | 美国 | 0.14 | 日本 | 韩国 | 0.14 |
| 中国台湾 | 新加坡 | 0.12 | 日本 | 中国台湾 | 0.14 | 新加坡 | 中国 | 0.12 |
表8 1999年、2009年和2019年全球主要国家或地区间半导体设备贸易HM指数(前10位)Tab. 8 HM index of semiconductor devices trade between major countries or regions (Top 10) |
| 消费地 | 生产地 | 1999年 | 消费地 | 生产地 | 2009年 | 消费地 | 生产地 | 2019年 |
|---|---|---|---|---|---|---|---|---|
| 中国台湾 | 日本 | 0.86 | 中国台湾 | 新加坡 | 0.61 | 中国 | 韩国 | 0.71 |
| 中国台湾 | 美国 | 0.48 | 中国 | 韩国 | 0.39 | 中国台湾 | 荷兰 | 0.52 |
| 新加坡 | 英国 | 0.24 | 中国台湾 | 美国 | 0.38 | 中国 | 德国 | 0.50 |
| 美国 | 英国 | 0.20 | 中国 | 德国 | 0.34 | 中国台湾 | 日本 | 0.30 |
| 以色列 | 英国 | 0.14 | 中国台湾 | 日本 | 0.31 | 中国台湾 | 新加坡 | 0.29 |
| 新加坡 | 美国 | 0.13 | 韩国 | 荷兰 | 0.29 | 美国 | 日本 | 0.28 |
| 日本 | 美国 | 0.12 | 美国 | 荷兰 | 0.26 | 中国 | 英国 | 0.28 |
| 中国台湾 | 英国 | 0.12 | 韩国 | 美国 | 0.25 | 中国 | 日本 | 0.25 |
| 日本 | 英国 | 0.10 | 美国 | 日本 | 0.23 | 美国 | 英国 | 0.22 |
| 德国 | 英国 | 0.09 | 韩国 | 德国 | 0.18 | 美国 | 韩国 | 0.21 |
| [1] |
|
| [2] |
|
| [3] |
|
| [4] |
[ 谢志峰, 陈大明. 芯事. 上海: 上海科学技术出版社, 2020.]
|
| [5] |
|
| [6] |
|
| [7] |
[ 朱贻玮. 集成电路产业50年回眸. 北京: 电子工业出版社, 2019: 18-19.]
|
| [8] |
[ 曲如晓, 李婧. 世界高技术产品贸易格局及中国的贸易地位分析. 经济地理, 2020, 40(3): 102-109, 140.]
|
| [9] |
[ 王倩倩, 杜德斌, 张杨, 等. 全球手机贸易网络演化特征研究. 世界地理研究, 2019, 28(2): 170-178.]
|
| [10] |
[ 刘清, 杨永春, 蒋小荣, 等. 手机全球贸易网络演化及供需匹配关系: 基于复杂网络的社团分析. 经济地理, 2021, 41(3): 113-125.]
|
| [11] |
[ 高菠阳, 李俊玮. 全球电子信息产业贸易网络演化特征研究. 世界地理研究, 2017, 26(1):1-11.]
|
| [12] |
[ 段德忠, 杜德斌. 全球高科技产品贸易结构演化及影响因素. 地理学报, 2020, 75(12): 2759-2776.]
|
| [13] |
|
| [14] |
|
| [15] |
|
| [16] |
|
| [17] |
|
| [18] |
|
| [19] |
|
| [20] |
|
| [21] |
|
| [22] |
|
| [23] |
|
| [24] |
|
| [25] |
|
| [26] |
|
| [27] |
|
| [28] |
|
| [29] |
|
| [30] |
|
| [31] |
|
| [32] |
|
| [33] |
|
| [34] |
|
| [35] |
|
| [36] |
[ 邹嘉龄, 刘春腊, 尹国庆, 等. 中国与“一带一路”沿线国家贸易格局及其经济贡献. 地理科学进展, 2015, 34(5): 598-605.]
|
| [37] |
[ 张雨佳, 张晓平, 龚则周. 中国与“一带一路”沿线国家贸易依赖度分析. 经济地理, 2017, 37(4): 21-31.]
|
| [38] |
|
| [39] |
|
| [40] |
|
/
| 〈 |
|
〉 |
