
Influencing factors and spatial equilibrium of China's vocational education resources distribution
Received date: 2022-06-09
Revised date: 2022-11-18
Online published: 2022-12-29
Supported by
National Social Science Fundation of China(20BSH056)
Chongqing Education Commission Humanities and Social Science Key Planning Project(22SKGH558)
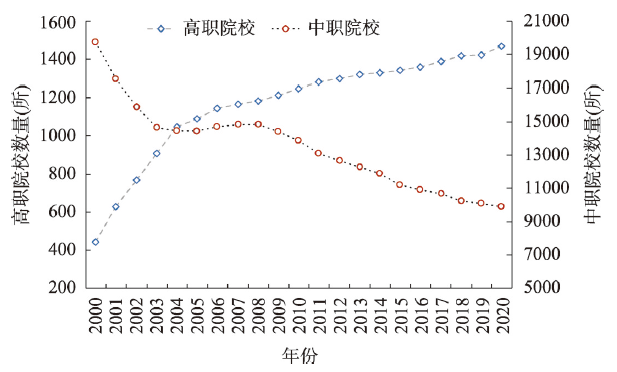
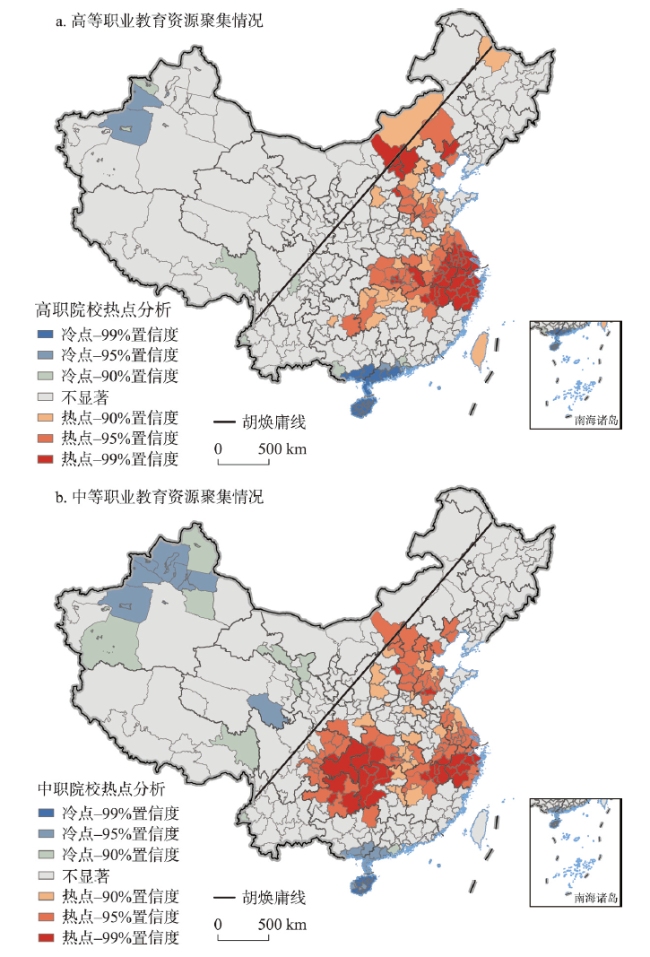
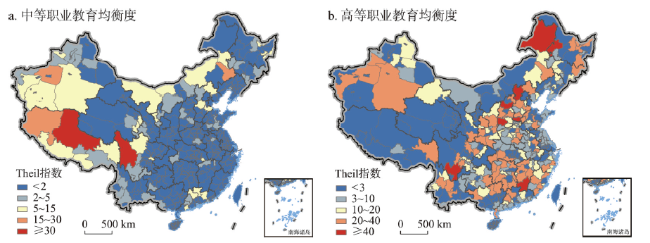
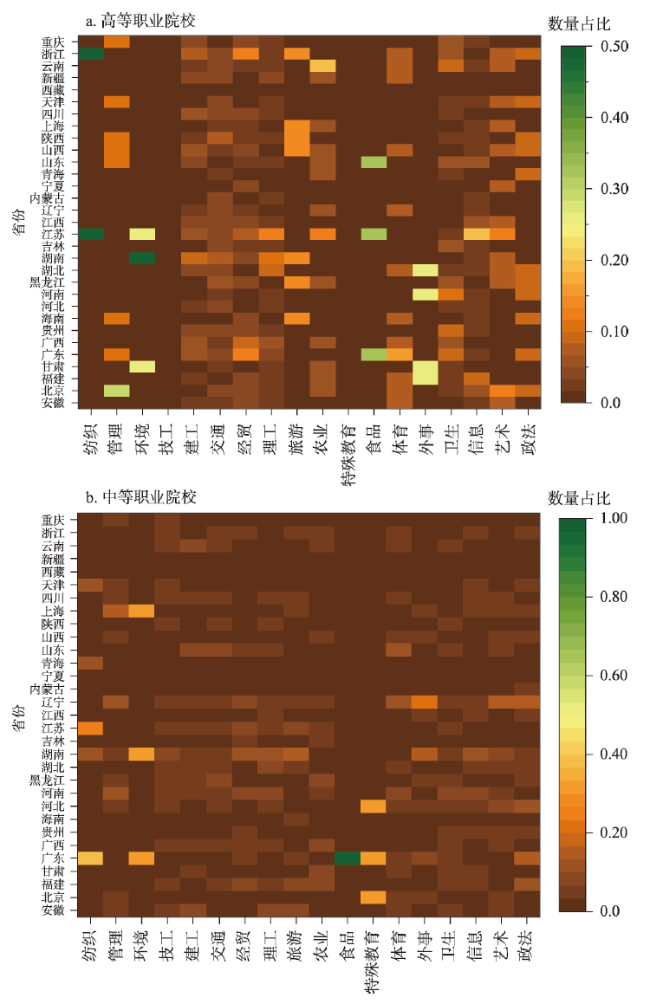
Clarifying the spatial distribution of middle and higher vocational education resources and their influencing factors is an important proposition for improving China's vocational education system and promoting the balanced development of regional vocational education. This study attempts to fill in the knowledge gap that the spatial distribution characteristics and influencing factors of vocational education resources at the county level is underexamined. We firstly generate a matched data set of multiple factors at the county level, including population, economy, middle and higher vocational education resources at China's county-level scale. Secondly, we analyze the spatial distribution characteristics of middle and higher vocational education resources in nearly two decades and then identify the quantitative relations with socio-economic development indicators. Thirdly, we examine the spatial equilibrium of vocational schools and the allocation of vocational education resources by industries. Finally, we put forward the corresponding policy options for China's vocational education resources allocation. The result show that the middle and higher vocational education resources at different spatial scales concentrate to the east of the Huhuanyong Line and scatter to the west of the line. In terms of the influencing factors, the number of people under the age of 15 has a significant positive role in promoting the number of middle vocational schools, and the numbers of secondary and tertiary industries has a positive impact on the number of higher vocational schools. The research results also present that the middle vocational education resources are widely distributed, and relatively unbalanced in the west. On the contrary, the higher vocational education resources are relatively unbalanced in the east, and the difference in higher vocational education resources is dominated by variations within cities. Accordingly, we suggest that the allocation of higher and middle vocational education resources should be optimized according to local and surrounding economic development, industry and labor demand. Specifically, the eastern region requires a more reasonable allocation of higher vocational education resources, and the western region should strengthen the construction of middle vocational education resources. Moreover, the connection and coordination of middle vocational education resources between the east and the west should be emphasized as well. In addition, by relying on the cities with premium higher vocational educational resources, the development of middle vocational schools in their surrounding counties can be promoted, especially for the schools setting up the related majors. These policy options put forward by this research can shed light on enhancing the social recognition of vocational schools, and eventually boost rural revitalization and new urbanization development in China.

ZENG Haomiao , ZHANG Xuemin , REN Qilin , WU Feng . Influencing factors and spatial equilibrium of China's vocational education resources distribution[J]. Acta Geographica Sinica, 2022 , 77(12) : 3180 -3193 . DOI: 10.11821/dlxb202212015
表1 高等与中等职业教育资源影响因素分析Tab. 1 Analysis of influencing factors of resources in higher and middle vocational education |
| 变量 | 中职教育 | 高职教育 | |||||||||
|---|---|---|---|---|---|---|---|---|---|---|---|
| OLS | SAR | SEM | SAC | SAC(优化) | OLS | SAR | SEM | SAC | SAC(优化) | ||
| 截距 | -6.98 | -10.74 | -16.45 | -12.82 | -21.47*** | 2.46 | 3.38 | -6.17 | -4.84 | 14.78*** | |
| 总人口(万人) | 0.1070*** | 0.1050*** | 0.1045*** | 0.1042*** | 0.1048*** | 0.0694*** | 0.0677*** | 0.0674*** | 0.0677*** | 0.0768*** | |
| 人口密度(人/km2) | -0.0125*** | -0.0122*** | -0.011*** | -0.0103*** | -0.0107 | -0.0084*** | -0.0078*** | -0.0071*** | -0.0067*** | -0.0008*** | |
| 15岁以下人口(万人) | 0.0431** | 0.0415** | 0.0451** | 0.0446** | 0.0437** | 0.0084 | 0.0087 | 0.0097 | 0.0089 | ||
| 人均GDP(元/人) | 0.0001*** | 0.0001*** | 0.0001*** | 0.0001*** | 0.0001*** | 0.0001*** | 0.0001*** | 0.0001*** | 0.0001*** | 0.0001*** | |
| GDP | -0.1098*** | -0.1050*** | -0.1038*** | -0.1056*** | -0.1043*** | -0.1122*** | -0.1084*** | -0.1065*** | -0.1075*** | -0.1209*** | |
| 第二产业(亿元) | 0.0011*** | 0.0010*** | 0.0010*** | 0.0010*** | 0.0010*** | 0.0011*** | 0.0011*** | 0.0010*** | 0.0010*** | 0.0011*** | |
| 第三产业(亿元) | 0.0011*** | 0.0010*** | 0.0010*** | 0.0010*** | 0.0010*** | 0.0012*** | 0.0011*** | 0.0011*** | 0.0011*** | 0.0012*** | |
| 二产占比 | -0.1906 | -0.1753 | -0.0903 | -0.0937 | -0.2164 | -0.2068 | -0.1180 | -0.0980 | -0.2980*** | ||
| 三产占比 | 0.2315 | 0.2608 | 0.3327 | 0.3087 | 0.4070*** | 0.1336 | 0.1489 | 0.2254. | 0.2241. | ||
| 第二产业企业数量(个) | -0.00004 | -0.00005 | 0.00007 | 0.0001 | 0.0003* | 0.0003** | 0.0003*** | 0.0004*** | 0.0004*** | ||
| 第三产业企业数量(个) | -0.00002 | -0.00002 | -0.00004 | -0.00004 | -0.0002*** | -0.0002*** | -0.0002*** | -0.0003*** | -0.0003*** | ||
| 0.0911 | -0.1045 | -0.0094 | 0.0778 | -0.1453 | -0.1509 | ||||||
| 0.3692*** | 0.4378 | 0.4277*** | 0.2636 | 0.3816*** | 0.3629*** | ||||||
| AIC | 2135 | 2135 | 2116 | 2115 | 2110 | 2012 | 2013 | 2004 | 2003 | 2001 | |
| R2 | 0.725 | 0.67 | |||||||||
| Wald statistic | 2.6294 | 22.528*** | 1.6587 | 11.21*** | |||||||
| LR test | 23.94*** | 24.971*** | 12.933*** | 10.97*** | |||||||
注:*、**、***分别代表p < 0.1、p < 0.05、p < 0.01。 |
| [1] |
[ 吕景泉, 马雁, 杨延, 等. 职业教育: 供给侧结构性改革. 中国职业技术教育, 2016(9): 15-19.]
|
| [2] |
[ 于志晶, 刘海, 程宇, 等. 从职教大国迈向职教强国:中国职业教育2030研究报告. 职业技术教育, 2016, 37(6): 10-30.]
|
| [3] |
[ 何为. 职业本科教育: 时代价值与策略选择. 教育理论与实践, 2021, 41(33): 21-24.]
|
| [4] |
[ 乔榛, 王丹. 我国经济增长动力转换的新机制研究. 学习与探索, 2020(1): 123-130.]
|
| [5] |
[ 陈子季. 优化类型定位加快构建现代职业教育体系. 中国职业技术教育, 2021(12): 5-11.]
|
| [6] |
|
| [7] |
[ 袁振杰, 陈晓亮. 西方教育地理学研究评述与本土反思. 地理科学, 2019, 39(12): 1938-1945.]
|
| [8] |
[ 张博, 邓浩坤, 安宁, 等. 大数据背景下国内人文地理研究进展与方法审视. 人文地理, 2019, 34(3): 14-21, 90.]
|
| [9] |
|
| [10] |
[ 郭扬, 张建华. 区域职业教育均衡发展的基础与背景. 职教论坛, 2011(25): 18-21.]
|
| [11] |
|
| [12] |
|
| [13] |
[ 戚瑞双. 我国高等职业教育空间分布与生产力发展水平的关系研究. 职业技术教育, 2013, 34(10): 39-45.]
|
| [14] |
[ 李海东. 基于产业转型升级的职业教育供给侧改革研究. 教育与职业, 2019(5): 5-12.]
|
| [15] |
|
| [16] |
[ 宋亚峰, 王世斌, 潘海生. 我国高职院校空间布局: 形态、动因与优化. 中国职业技术教育, 2018(36): 16-23.]
|
| [17] |
|
| [18] |
[ 姜大源. 中国职业教育发展与改革: 经验与规律. 职业技术教育, 2011, 32(19): 5-10.]
|
| [19] |
[ 刘宏燕, 陈雯. 中国基础教育资源布局研究述评. 地理科学进展, 2017, 36(5): 557-568.]
|
| [20] |
[ 袁振杰, 郭隽万果, 杨韵莹, 等. 中国优质基础教育资源空间格局形成机制及综合效应. 地理学报, 2020, 75(2): 318-331.]
|
| [21] |
[ 胡新谱. 河南职业教育空间差异分析. 地域研究与开发, 2010, 29(4): 52-54.]
|
| [22] |
|
| [23] |
|
| [24] |
[ 赵枝琳. 我国西南地区中等职业教育的空间分布与均衡发展. 云南师范大学学报(哲学社会科学版), 2017, 49(4): 127-133.]
|
| [25] |
[ 赵枝琳. 云南民族职业教育发展的时空格局与对策. 学术探索, 2017(7): 152-156.]
|
| [26] |
[ 李嘉欣. 我国中等职业教育发展水平的空间分异及解析. 职业教育(下旬刊), 2021, 20(3): 27-37.]
|
| [27] |
[ 郭燕, 王强, 方绪军. 职业教育专业适应性发展的内在逻辑与应然选择. 成人教育, 2021, 41(12): 65-72.]
|
| [28] |
|
| [29] |
|
| [30] |
|
| [31] |
[ 匡瑛, 石伟平. 改革开放40年职业技术教育学科发展的回顾与思考. 教育研究, 2018, 39(10): 32-39.]
|
| [32] |
[ 劳昕, 薛澜. 我国高等教育资源的空间分布及其对地区经济增长的影响. 高等教育研究, 2016, 37(6): 26-33.]
|
| [33] |
|
| [34] |
[ 李薪茹, 韩永强. 职业教育与产业协同发展及其策略. 中国职业技术教育, 2017(6): 47-51.]
|
| [35] |
[ 金贵, 邓祥征, 赵晓东, 等. 2005—2014年长江经济带城市土地利用效率时空格局特征. 地理学报, 2018, 73(7): 1242-1252.]
|
/
| 〈 |
|
〉 |