
Evolution of spatial organization pattern of economic cooperation between Heilongjiang of China and Far East of Russia
Received date: 2021-09-13
Revised date: 2022-04-06
Online published: 2022-10-12
Supported by
National Natural Science Foundation of China(41801108)
Strategic Priority Research Program of Chinese Academy of Sciences(XDA19040403)
Key projects of National Natural Science Foundation of China(41630749)
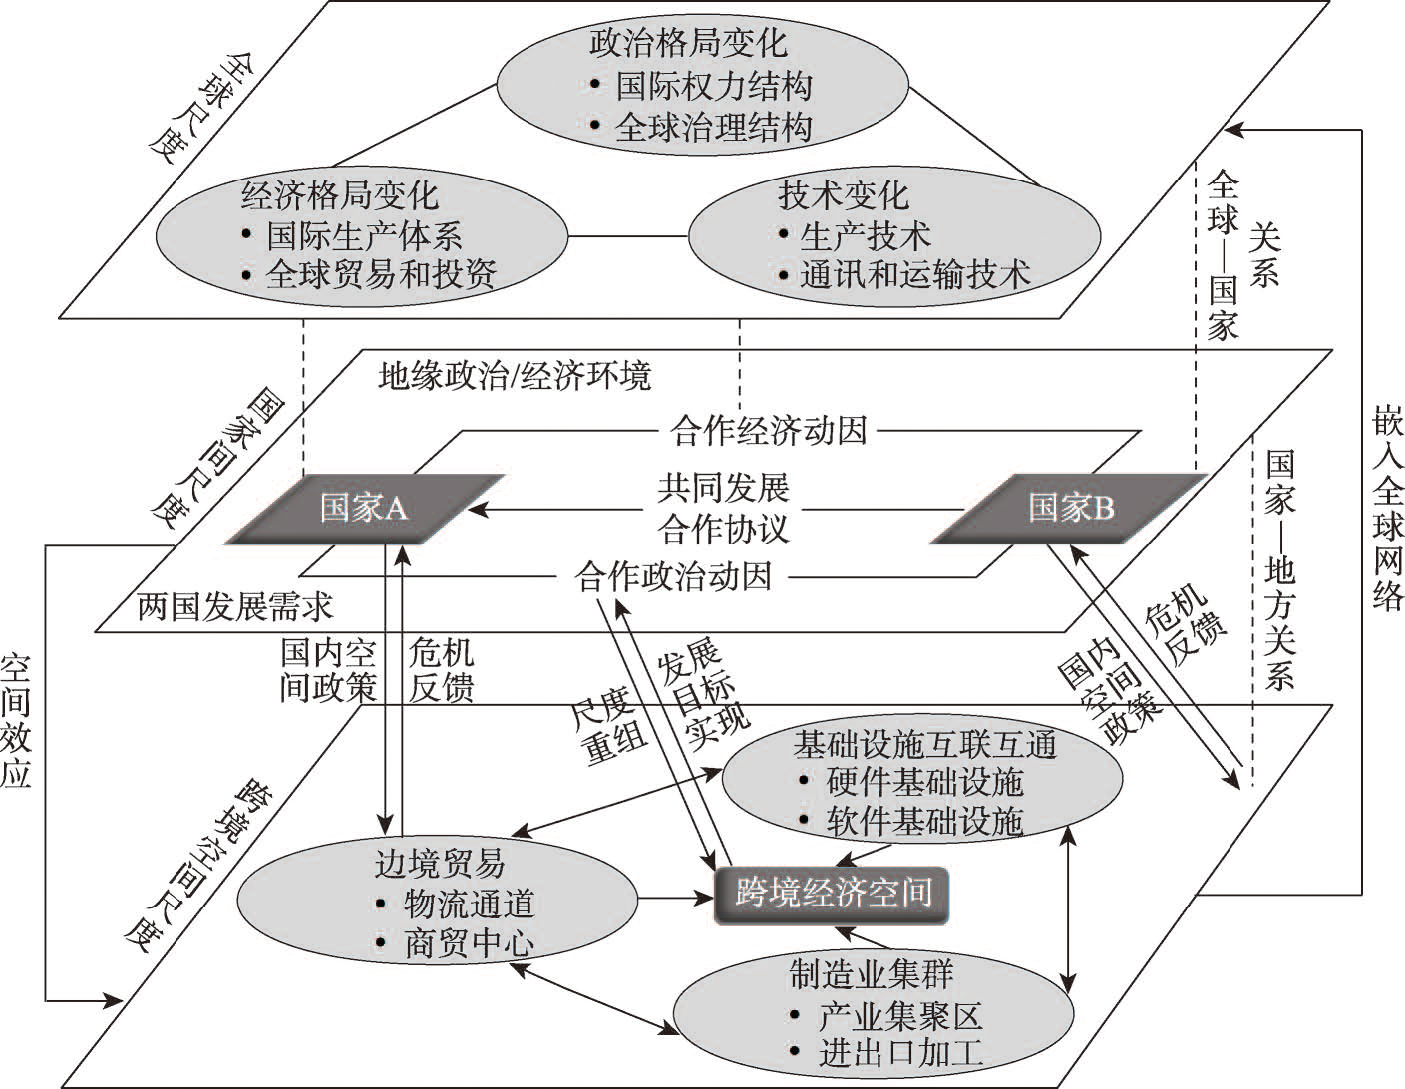
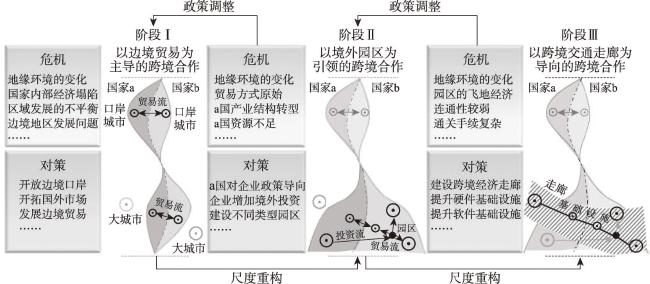
Since China's Belt and Road Initiative (BRI) in 2013, transborder economic cooperation has received increasing attentions. The existing studies have focused on the geopolitical environments and the contents of cooperation, but few have examined the historical evolution of the spatial organization models of transborder economic cooperation. This study aims to fill the gap to explore the evolutionary process of the spatial organization models of transborder economic cooperation between China and Russia. Taking Heilongjiang Province of China and the Far East of Russia as a case, we proposed a novel framework for understanding trans-border economic cooperation from multi-scalar perspective, based on Brenner's New Nation Space theory. Our results reveal that the spatial organization pattern of China-Russia trans-border economic cooperation since the 1990s has experienced three evolutionary stages: transborder trade-based stage in the 1990s, overseas industrial park-based stage between 2000 and 2013, and transport corridor-oriented stage from 2013 to present. After the borders in Heilongjiang were gradually opened in the late 1980s, Sino-Russian transborder trades entered into a rapid development stage. After the mid-1990s, disputes and crises emerged in the transborder economic cooperation pattern propelled by border trade, which led to a new round of reshaped cooperation pattern of industrial parks established by Chinese enterprises. After 2013, the new mode of transportation corridor-oriented cooperation emerged because of the multi-scalar and multi-dimensional reorganization in order to respond to the crisis of the old pattern. The evolution suggests that there is a certain degree of historical dependence between the new and old patterns. This study extends the theory of New Nation Space and provides scientific basis for promoting high-quality development of transborder cooperation between China and Russia.
LI Xiaoling , LIU Zhigao , TAN Shuang , XIU Chunliang , HE Hongshi . Evolution of spatial organization pattern of economic cooperation between Heilongjiang of China and Far East of Russia[J]. Acta Geographica Sinica, 2022 , 77(8) : 2083 -2096 . DOI: 10.11821/dlxb202208016
表1 1991—1998年黑龙江省对俄贸易情况Tab. 1 The development of Heilongjiang's border trade with Russia from 1991 to 1998 |
| 年份 | 全省进出口贸易 (亿美元) | 黑龙江对俄罗斯贸易 (亿美元) | 对俄边境 贸易总额 (亿美元) | 对俄贸易占全省进出口 贸易比重(%) | 对俄边境贸易占全省对俄贸易比重(%) | |||||||
|---|---|---|---|---|---|---|---|---|---|---|---|---|
| 贸易总额 | 进口额 | 出口额 | 贸易总额 | 进口额 | 出口额 | 贸易总额 | 贸易总额 | 进口额 | 出口额 | 贸易总额 | ||
| 1991 | 20.18 | 6.41 | 13.78 | 8.70 | 4.08 | 4.62 | 5.83 | 43.11 | 63.65 | 33.53 | 67.01 | |
| 1992 | 28.81 | 10.50 | 18.31 | 15.85 | 7.45 | 8.40 | - | 55.02 | 70.95 | 45.88 | - | |
| 1993 | 30.54 | 11.69 | 18.84 | 19.51 | 8.85 | 10.66 | - | 63.88 | 75.71 | 56.58 | - | |
| 1994 | 30.94 | 12.56 | 18.38 | 16.11 | 8.58 | 7.53 | 12.31 | 52.07 | 68.31 | 40.97 | 76.41 | |
| 1995 | 34.30 | 13.34 | 20.96 | 15.30 | 6.75 | 8.55 | 13.26 | 44.61 | 50.60 | 40.79 | 86.67 | |
| 1996 | 35.17 | 17.06 | 18.11 | 14.20 | 7.22 | 6.98 | 5.98 | 40.38 | 42.32 | 38.54 | 42.11 | |
| 1997 | 35.82 | 15.81 | 20.02 | 14.18 | 7.00 | 7.18 | 4.11 | 39.59 | 44.28 | 35.86 | 28.98 | |
| 1998 | 38.13 | 17.78 | 20.35 | 16.42 | 7.78 | 8.65 | 5.60 | 43.06 | 43.76 | 42.51 | 34.10 | |
注:1991年对俄边境贸易总额数据来自《黑龙江商务年鉴》(1991年),其余数据来自《黑龙江统计年鉴》(1991—1998年),“-”为缺失数据。 |
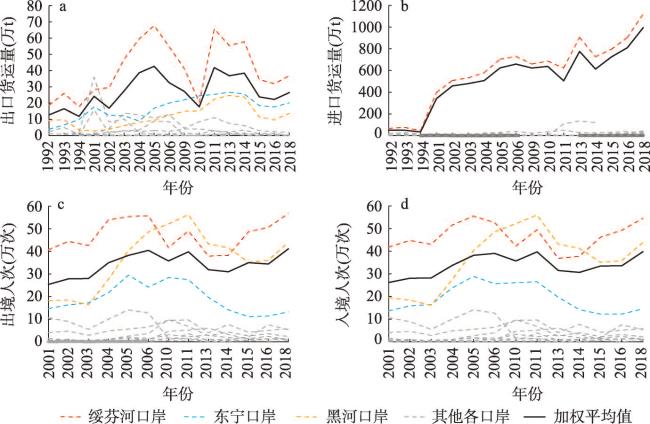
图2 黑龙江省各口岸对俄进出口货运量及出入境人次注:1992—1994年各口岸进出口货运量数据来自《黑龙江对外经济贸易年鉴》(1992—1994年),历年各口岸进出口货运量及出入境人次数据来自《中国口岸年鉴》(2001—2006年、2010—2011年、2015年、2018年),其他年份各口岸进出口货运量及出入境人次数据来自《黑龙江商务年鉴》(2013—2014年、2016年)。 Fig. 2 The import and export volume of goods to Russia and the number of people entering and leaving the country at ports in Heilongjiang Province |
表2 黑龙江省在俄罗斯远东地区建立境外园区Tab. 2 Overseas industrial parks established by Heilongjiang Province of China in the Far East of Russia |
| 序号 | 园区名称 | 创建年份 | 开发主体 | 空间分布 |
|---|---|---|---|---|
| 1 | 滨海华宇经济贸易合作区 | 2003 | 黑龙江华宇工贸集团 | 滨海边疆区 |
| 2 | 中俄(滨海边疆区)现代农业经济合作区 | 2004 | 东宁华信经济贸易有限责任公司 | 滨海边疆区 |
| 3 | 乌苏里斯克(城子)经贸合作区 | 2006 | 黑龙江省吉信工贸集团 | 滨海边疆区 |
| 4 | 东宁华洋境外绿色农业合作园区 | 2011 | 东宁华洋贸易有限公司 | 滨海边疆区 |
| 5 | 跃进高科技产业园 | 2012 | 绥芬河市跃进经贸公司 | 滨海边疆区 |
| 6 | 新友谊农场 | 2012 | 牡丹江农垦新友谊农业经济开发有限公司 | 滨海边疆区 |
| 7 | 中俄远东经贸合作区 | 2012 | 绥芬河曲美木业发展有限公司 | 滨海边疆区 |
| 8 | 龙跃林业经贸合作区 | 2013 | 牡丹江市龙跃经贸有限公司 | 犹太自治州 |
| 9 | 阿穆尔州和兴商贸物流园 | 2014 | 黑河和兴经贸有限公司 | 阿穆尔州 |
| 10 | 北极星林业经贸合作区 | 2014 | 黑龙江兴邦国际资源投资股份有限公司 | 后贝加尔边疆区 |
| 11 | 中俄农牧业产业示范园区 | 2014 | 黑龙江龙源润丰经贸有限公司 | 滨海边疆区 |
| 12 | 鹏瑞境外林业采伐加工区 | 2016 | 绥芬河鹏瑞经贸有限责任公司 | 滨海边疆区 |
| 13 | 阿穆尔州别列佐夫卡石化建材加工园区 | 2016 | 梦兰星河能源股份有限公司 | 阿穆尔州 |
| 14 | 春天农业产业经贸合作区 | 2016 | 牡丹江盛弘源经贸有限公司 | 阿穆尔州 |
| 15 | 黑河北丰中俄阿穆尔农业(畜牧)业园区 | 2016 | 黑河市北丰农业科技服务有限公司 | 阿穆尔州 |
| 16 | 阿穆尔综合园区 | 2016 | 黑龙江中铁龙兴投资发展有限公司 | 犹太自治州 |
注:资源来源于中国境外产业园区信息服务平台( https://oip.ccpit.org/ent/parkNew/138)及其他公开资料。 |
表3 2013—2020年黑龙江省对俄边境贸易发展情况Tab. 3 The development of Heilongjiang's border trade with Russia from 2013 to 2020 |
| 年份 | 黑龙江省对俄罗斯贸易 (亿美元) | 边境贸易总额 (亿美元) | 对俄边境贸易占黑龙江省 对俄罗斯比重(%) | ||||
|---|---|---|---|---|---|---|---|
| 贸易总额 | 进口额 | 出口额 | 贸易总额 | 贸易总额 | |||
| 2013 | 223.64 | 154.55 | 69.09 | 78.87 | 35.27 | ||
| 2014 | 232.83 | 142.80 | 90.03 | 73.36 | 31.51 | ||
| 2015 | 108.39 | 84.96 | 23.53 | 34.86 | 32.16 | ||
| 2016 | 91.95 | 74.94 | 17.01 | 26.53 | 28.86 | ||
| 2017 | 109.43 | 93.84 | 15.59 | 31.09 | 28.41 | ||
| 2018 | 184.45 | 173.19 | 11.27 | 28.24 | 15.31 | ||
| 2019 | 184.20 | 169.70 | 14.50 | 24.22 | 13.15 | ||
| 2020 | 149.11 | 134.53 | 14.59 | - | - | ||
注:2013—2017年黑龙江省对俄罗斯贸易数据来自《黑龙江商务年鉴》(2017年),2018—2020年黑龙江省对俄罗斯贸易数据根据哈尔滨海关2018年、2019年工作总结以及2020年哈尔滨海关统计数据整理计算而得;2013—2017年边境贸易总额数据来自《黑龙江商务年鉴》(2017年),2018年边境贸易数据来自《黑龙江年鉴》(2019),2019年边境贸易数据来自黑龙江省2019年国民经济和社会普查统计公报(黑龙江省统计局)(其中2017年没有边境贸易总额数据,经计算2013—2016年边境贸易总额数据与同年边境小额贸易数据几乎一致,故2017年边境贸易总额数据采用当年边境小额贸易数据替代);“-”为缺失数据。 |
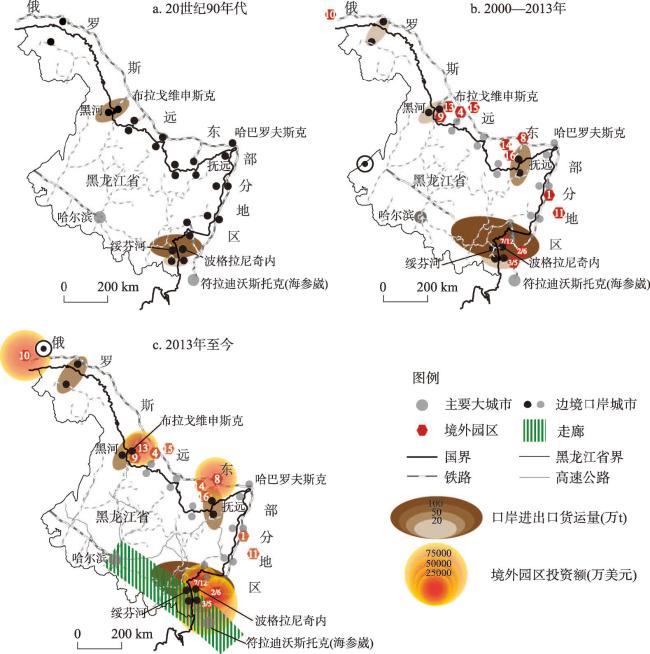
图3 中国黑龙江省与俄罗斯远东地区跨境经济合作空间组织模式演化注:基于自然资源部标准地图服务网站审图号为GS(2017)1268号的标准地图,底图边界无修改;口岸进出口货运量为各个阶段进出口货运量年平均值,境外园区投资额为2018年数据;边境口岸城市的黑色圆点代表在其所处阶段跨境活动活跃,灰色圆点代表在其所处阶段跨境活动不活跃。 Fig. 3 Evolution of spatial organization patterns of economic cooperation between Heilongjiang Province of China and the Far East of Russia |
| [1] |
|
| [2] |
|
| [3] |
|
| [4] |
|
| [5] |
|
| [6] |
|
| [7] |
|
| [8] |
[ 杨青山, 刘鉴, 张郁, 等. 满洲里口岸—城市关系演变的多尺度因素影响分析. 地理学报, 2020, 75(10): 2146-2163.]
|
| [9] |
|
| [10] |
|
| [11] |
|
| [12] |
|
| [13] |
|
| [14] |
|
| [15] |
[ 王淑芳, 周俊, 孟广文, 等. “一带一路”地缘经济的研究现状与热点: 基于文献计量法和知识图谱分析. 经济地理, 2020, 40(12): 1-11.]
|
| [16] |
|
| [17] |
[ 刘志高, 张薇, 刘卫东. 中国东北三省对外贸易空间格局研究. 地理科学, 2016, 36(9): 1349-1358.]
|
| [18] |
|
| [19] |
|
| [20] |
|
| [21] |
|
| [22] |
|
| [23] |
|
| [24] |
|
| [25] |
|
| [26] |
|
| [27] |
|
| [28] |
|
| [29] |
|
| [30] |
|
| [31] |
|
| [32] |
[ 黄季夏, 张天媛, 王利, 等. 俄罗斯油气资源空间分布格局及可达性评估. 地理学报, 2020, 75(9): 2009-2024.]
|
| [33] |
[ 初楠臣, 张平宇, 吴相利, 等. 俄罗斯东部城镇化与生态环境协调发展的时空演变特征. 生态学报, 2021, 41(24): 9717-9728.]
|
| [34] |
|
| [35] |
[ 董锁成, 杨洋, 李富佳, 等. 中蒙俄高铁建设的影响机理及对策. 地理学报, 2019, 74(2): 297-311.]
|
| [36] |
|
| [37] |
[ 陈才. 图们江流域的区域国际合作开发模式. 地理学报, 1999, 54(增刊): 65-75.]
|
| [38] |
[ 宋涛, 程艺, 刘卫东, 等. 中国边境地缘经济的空间差异及影响机制. 地理学报, 2017, 72(10): 1731-1745.]
|
| [39] |
|
| [40] |
|
| [41] |
|
| [42] |
|
/
| 〈 |
|
〉 |