
Dynamics of surface water area in the Yellow River Basin and its influencing mechanism during 1986-2019 based on Google Earth Engine
Received date: 2021-08-23
Revised date: 2022-03-18
Online published: 2022-07-20
Supported by
Young Elite Scientist Sponsorship by CAST(2017QNRC023)
National Natural Science Foundation of China(51779099)
National Natural Science Foundation of China(42041006)
Special Research Fund of the YRIHR(HKY-JBYW-2020-09)
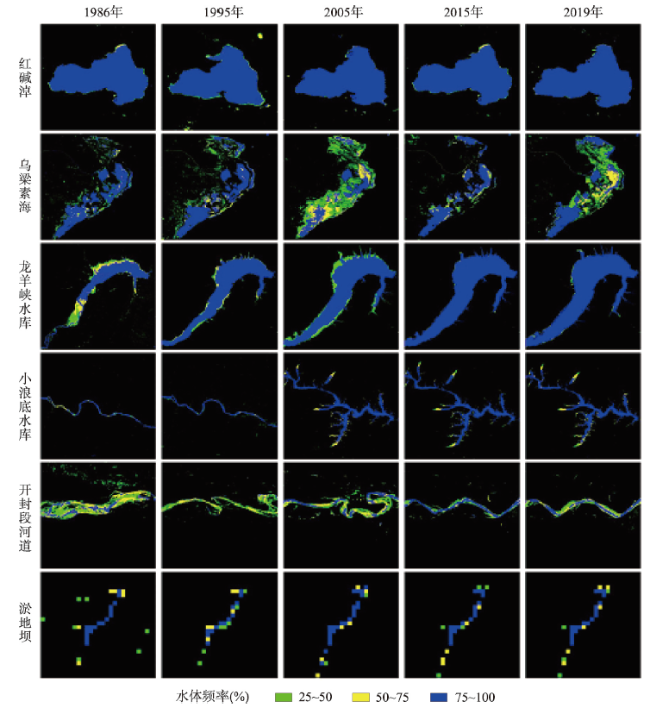
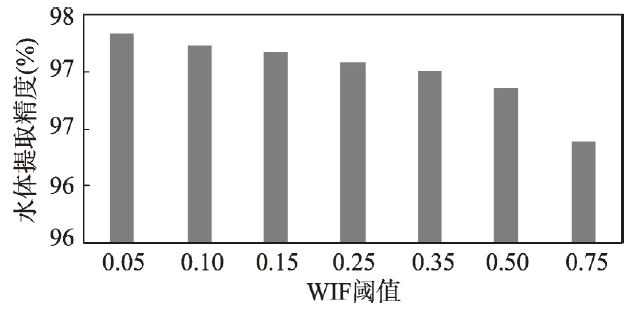
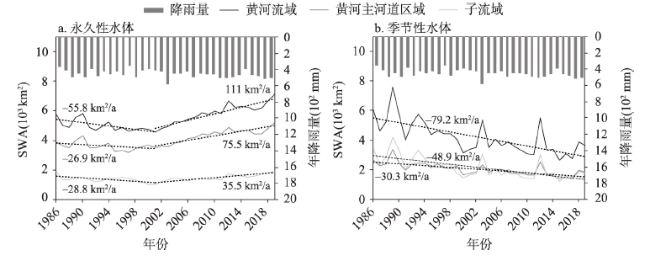
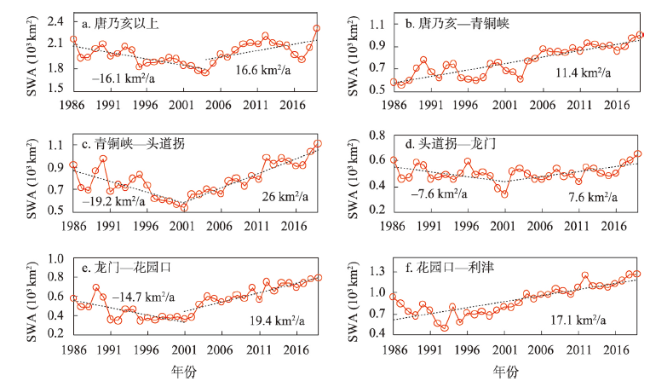
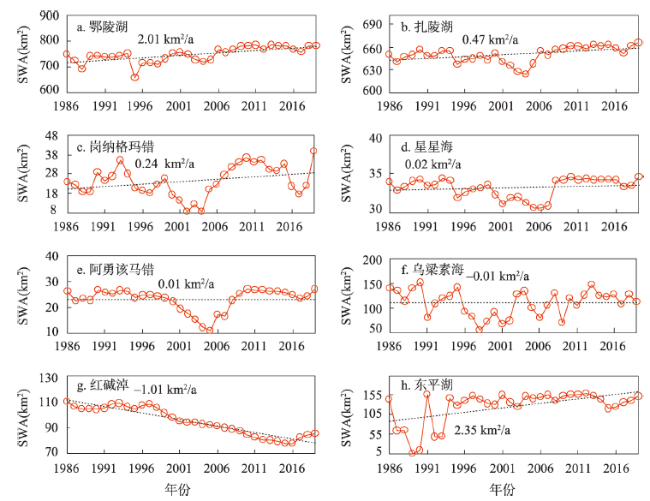
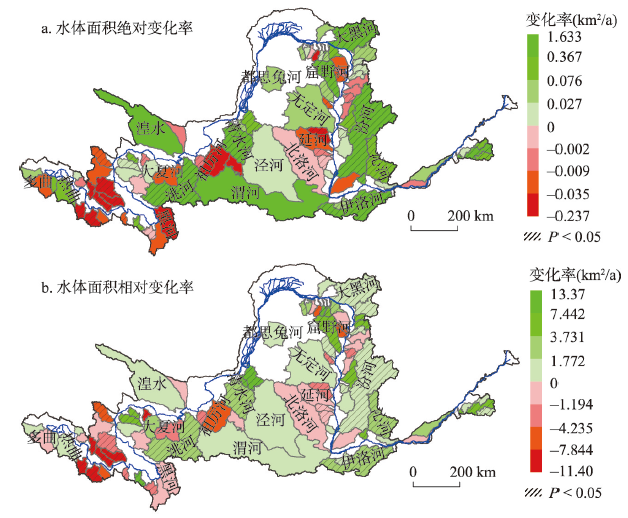
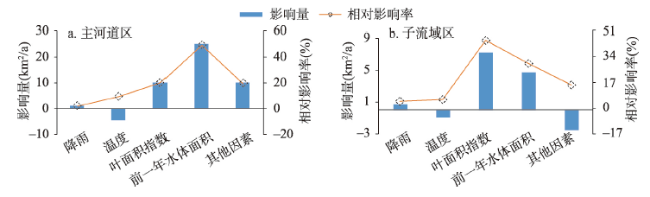
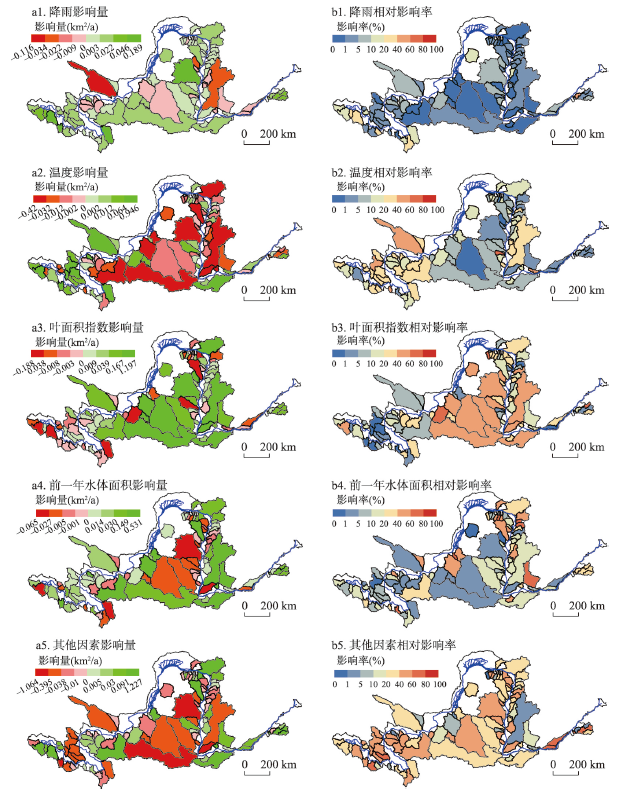
The Yellow River Basin (YRB) has been facing severe water shortages, hence the monitoring of long-term dynamics of surface water area (SWA) is essential to better understand the spatial and temporal variation of surface water resources and its driving factors. In this study, the spatial and temporal change characteristics of SWA in the YRB were revealed, and then the impacts and relative impact rate of precipitation (Pre), temperature (Temp), leaf area index (LAI), SWA in the previous year (Pre_SWA) and residual factors (e.g. water conservation measures and human water use activities) on SWA were determined in the combination of water detection index, linear slope, multiple linear regression and partial differential decomposition. The results show that: (1) the overall accuracy of classification of surface water bodies is 97%. The increase rate of year-long SWA in the study area from 1986 to 2019 is 49.82 km2/a, of which 83.2% was contributed by the SWA increment from the main river channel area, and the year 2001 is the turning point of SWA trend from decreasing to increasing; the seasonal SWA decreased at a rate of -79.2 km2/a, of which 61.8% was contributed by the SWA decrease in the sub-basin areas. (2) The SWA changes of all major natural lakes are relatively stable, and the only decreasing trend of SWA was observed in the Hongjiannao lake; the SWA of Xiaolangdi and Longyangxia reservoirs changed significantly with an increasing trend among the large reservoirs in the main river channel, and SWA increasing trends can be observed in the 50 sub-basins located in the middle and lower reaches. (3) Precipitation had the least effect on the increasing trend of SWA, and warming caused a decrease of SWA in the middle reaches, but led to an increase of SWA in the source area. The impacts of vegetation greening on the SWA trend in the main channel area and sub-basin areas are 10.12 km2/a and 7.26 km2/a, respectively. Residual factors had a negative reffect on the SWA trend in the sub-basin areas, where the SWA reduction induced by human water use was much greater than the SWA increment induced by small water conservancy projects. However, residual factors had a positive effect on the SWA increase due to the great regulating storage capacity of large reservoirs in the main river channel area.
LI Chongwei , WANG Zhihui , TANG Qiuhong , HU Qingfeng , XIAO Peiqing , LYU Xizhi , LIU Yang . Dynamics of surface water area in the Yellow River Basin and its influencing mechanism during 1986-2019 based on Google Earth Engine[J]. Acta Geographica Sinica, 2022 , 77(5) : 1153 -1168 . DOI: 10.11821/dlxb202205008
表1 数据详细参数介绍Tab. 1 All the datasets used in this study |
| 数据 | 时间范围 | 空间分辨率 | 时间分辨率 |
|---|---|---|---|
| Landsat 5 TM | 1986—2012 | 30 m | 15 d |
| Landsat 7 ETM+ | 1999—2002 | 30 m | 15 d |
| Landsat 8 OLI | 2013—2019 | 30 m | 15 d |
| ASTER DEM | - | 30 m | - |
| GLASS | 2000—2019 | 1 km | 8 d |
| GranD(v1.3) | 1986—2019 | - | 1 a |
| China lake dataset | 1986—2019 | - | 1 a |
| 降雨量、温度 | 1986—2019 | 295个站点 | 1 d |
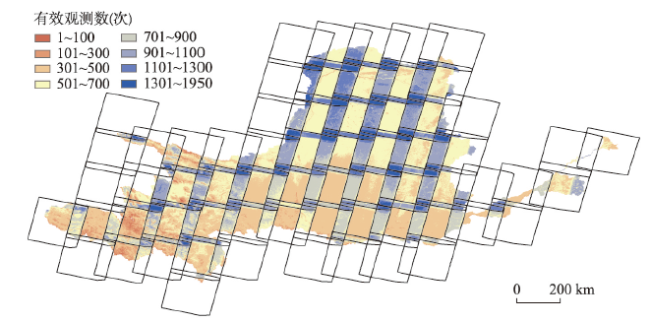
图2 1986—2019年Landsat有效观测次数在黄河流域的空间分布Fig. 2 Spatial distribution of the frenquecy of clear Landsat observations over the Yellow River Basin from 1986 to 2019 |
| [1] |
[汤秋鸿, 刘星才, 周园园, 等. “亚洲水塔”变化对下游水资源的连锁效应. 中国科学院院刊, 2019, 34(11): 1306-1312.]
|
| [2] |
[贾绍凤, 梁媛. 新形势下黄河流域水资源配置战略调整研究. 资源科学, 2020, 42(1): 29-36.]
|
| [3] |
[夏军, 彭少明, 王超, 等. 气候变化对黄河水资源的影响及其适应性管理. 人民黄河, 2014, 36(10): 1-4, 15.]
|
| [4] |
[刘昌明, 田巍, 刘小莽, 等. 黄河近百年径流量变化分析与认识. 人民黄河, 2019, 41(10): 11-15.]
|
| [5] |
[马柱国, 符淙斌, 周天军, 等. 黄河流域气候与水文变化的现状及思考. 中国科学院院刊, 2020, 35(1): 52-60.]
|
| [6] |
[张建云, 贺瑞敏, 齐晶, 等. 关于中国北方水资源问题的再认识. 水科学进展, 2013, 24(3): 303-310.]
|
| [7] |
[习近平. 在黄河流域生态保护和高质量发展座谈会上的讲话. 中国水利, 2019(20): 1-3.]
|
| [8] |
[刘建波, 戴昌达. TM图象在大型水库库情监测管理中的应用. 遥感学报, 1996(1): 54-58.]
|
| [9] |
[毕海芸, 王思远, 曾江源, 等. 基于TM影像的几种常用水体提取方法的比较和分析. 遥感信息, 2012, 27(5): 77-82.]
|
| [10] |
[陆家驹, 李士鸿. TM资料水体识别技术的改进. 环境遥感, 1992(1): 17-23.]
|
| [11] |
|
| [12] |
[徐涵秋. 利用改进的归一化差异水体指数(MNDWI)提取水体信息的研究. 遥感学报, 2005, 9(5): 589-595.]
|
| [13] |
|
| [14] |
|
| [15] |
|
| [16] |
|
| [17] |
|
| [18] |
|
| [19] |
|
| [20] |
|
| [21] |
|
| [22] |
|
| [23] |
|
| [24] |
|
| [25] |
|
| [26] |
|
| [27] |
[高吉喜, 王永财, 侯鹏, 等. 近20年黄河流域陆表水域面积时空变化特征研究. 水利学报, 2020, 51(9): 1157-1164.]
|
| [28] |
[刘晓燕. 黄河近年水沙锐减成因. 北京: 科学出版社, 2016.]
|
| [29] |
|
| [30] |
|
| [31] |
|
| [32] |
[刘志红,
|
| [33] |
|
| [34] |
|
| [35] |
|
| [36] |
|
| [37] |
[梁超. 近18年来黄河流域地表水体时空变化与降水影响分析[D]. 开封: 河南大学, 2020.]
|
| [38] |
|
| [39] |
|
| [40] |
|
| [41] |
|
| [42] |
|
/
| 〈 |
|
〉 |
