
Measuring the spatial accessibility of public services by optimal supply-demand allocation
Received date: 2020-12-18
Request revised date: 2021-08-18
Online published: 2022-06-20
Supported by
National Natural Science Foundation of China, No(41871307)
Key Scientific Research Project of Henan Institution of Higher Education, No(21A170007)
Copyright
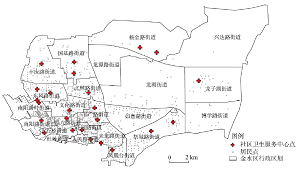
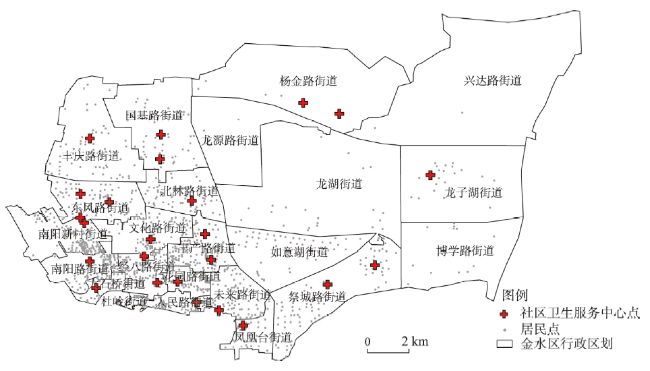
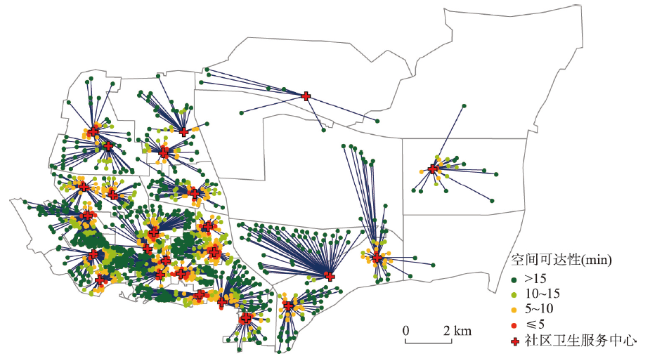
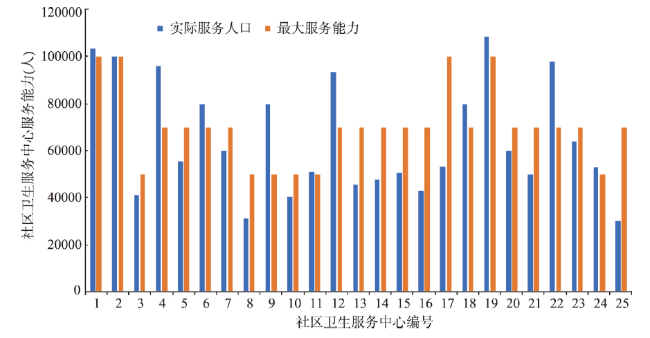
Spatial accessibility is an important index for measuring fairness in public services such as health care, education, and outdoor leisure. It has also been widely used in the layout planning of public facilities. However, the existing accessibility models cannot fully illustrate the direct relationship between service supply and demand, and thus, the accessibility indicators cannot be explained with explicit meanings. This article introduces a new method for measuring accessibility based on optimal supply and demand allocation, which is different from the supply-demand relationships in existing methods. Given the supply locations, the demand locations, their attributes, and the travel costs between them, the transportation problem model is used to allocate services to demands. The classical model can be easily solved with optimal total travel cost. Based on the model results, the spatial accessibility of services can be measured. The proposed method was tested on healthcare services in a district in Zhengzhou, Henan, China. There were 25 healthcare centres and 1333 residential communities in the study area. The instance model was effectively built by an open-source MIP solver in 2.2 seconds. The service area of each healthcare centre and the travel time from each community were obtained according to the modelling results. In addition, the coverage percentages with predefined service thresholds were calculated. The proposed method was also compared with popular methods, such as the two-step floating catchment area method (2SFCA), Gaussian 2SFCA, and gravity 2SFCA. Areas with poor healthcare services were identified by using the results from the three 2SFCA methods. However, the spatial variation in service accessibility might be very different when selecting different search thresholds and/or distance decay coefficients. The optimal supply-demand accessibility method (OSD) proposed in this study has advantages such as being parameter-free, easy to calculate, and easy to explain. The authors believe that the method has application potential to replace the existing methods in evaluating public services and facility planning.
ZHAI Shiyan , HE Xinxin , KONG Yunfeng , LUO Jingjing , SONG Genxin . Measuring the spatial accessibility of public services by optimal supply-demand allocation[J]. Acta Geographica Sinica, 2022 , 77(4) : 1028 -1038 . DOI: 10.11821/dlxb202204017
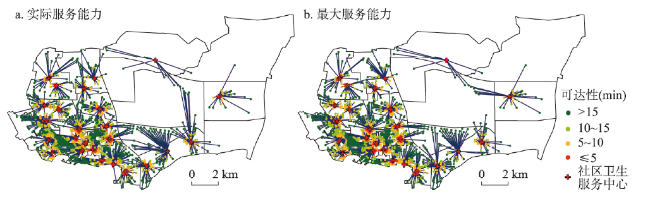
表1 郑州市金水区不同时间阈值下医疗服务覆盖统计Tab. 1 The coverage percentages of healthcare services within different time thresholds in Jinshui District, Zhengzhou |
| 分类(min) | 实际服务能力最优分配 | 最大服务能力最优分配 | 服务现状 | |||||
|---|---|---|---|---|---|---|---|---|
| 人数(人) | 占比(%) | 人数(人) | 占比(%) | 人数(人) | 占比(%) | |||
| ≤ 5 | 134038 | 8.29 | 141442 | 8.75 | 120419 | 7.45 | ||
| 5~10 | 368009 | 22.76 | 385789 | 23.86 | 321689 | 19.89 | ||
| 10~15 | 358494 | 22.17 | 359843 | 22.25 | 310973 | 19.23 | ||
| > 15 | 756538 | 46.78 | 730005 | 45.14 | 863998 | 53.43 | ||
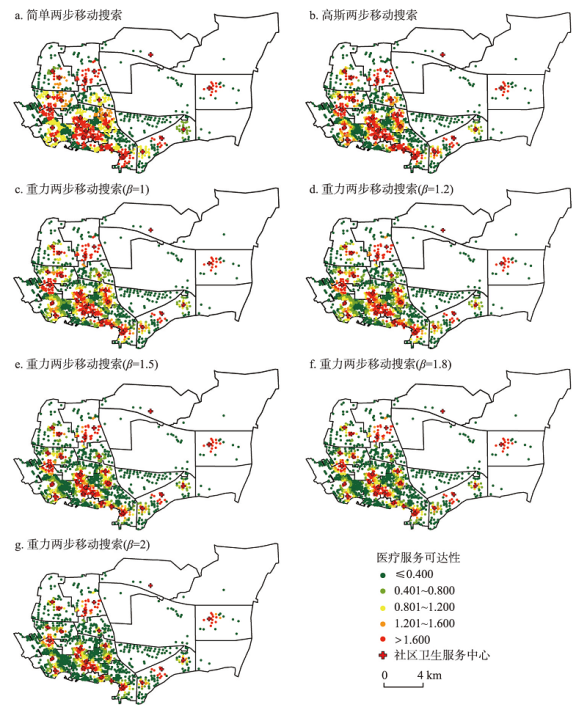
表2 基于2SFCA“15 min”步行搜索半径下医疗服务可达性统计(%)Tab. 2 Statistics of healthcare service accessibility within a "15-minute" walking search radius by 2SFCA |
| 可达性计算方法 | 差(≤ 0.4) | 较差(0.4~0.8) | 一般(0.8~1.2) | 较好(1.2~1.4) | 好(> 1.4) |
|---|---|---|---|---|---|
| 简单2SFCA | 42.82 | 4.12 | 22.16 | 7.94 | 22.95 |
| 高斯2SFCA | 51.51 | 6.63 | 9.57 | 7.97 | 24.32 |
| 重力2SFCA(β=1) | 43.43 | 17.26 | 10.75 | 6.95 | 21.62 |
| 重力2SFCA(β=1.2) | 46.01 | 19.13 | 8.60 | 7.44 | 18.82 |
| 重力2SFCA(β=1.5) | 52.93 | 15.63 | 9.06 | 7.34 | 15.03 |
| 重力2SFCA(β=1.8) | 59.97 | 13.54 | 8.93 | 3.93 | 13.63 |
| 重力2SFCA(β=2) | 63.60 | 14.09 | 6.56 | 3.10 | 12.65 |
| [1] |
[ 解利剑, 周素红. 区域一体化下的广州市居民城际通勤特征分析. 城市观察, 2010(4):85-93.]
|
| [2] |
Hansen,
|
| [3] |
|
| [4] |
|
| [5] |
|
| [6] |
|
| [7] |
|
| [8] |
|
| [9] |
[ 廖心治, 王华, 赵万民. 融合地图数据的山地城市医疗设施服务覆盖评估方法研究. 地球信息科学学报, 2021, 23(4):604-616.]
|
| [10] |
|
| [11] |
|
| [12] |
|
| [13] |
|
| [14] |
[ 杨文越, 李昕, 陈慧灵, 等. 基于多出行模式两步移动搜索法的广州多尺度绿地可达性与公平性研究. 生态学报, 2021, 41(15):6064-6074.]
|
| [15] |
[ 韩增林, 董梦如, 刘天宝, 等. 社区生活圈基础教育设施空间可达性评价与布局优化研究: 以大连市沙河口区为例. 地理科学, 2020, 40(11):1774-1783.]
|
| [16] |
|
| [17] |
|
| [18] |
|
| [19] |
|
| [20] |
|
| [21] |
|
| [22] |
|
| [23] |
[ 赵鹏军, 罗佳, 胡昊宇. 基于大数据的生活圈范围与服务设施空间匹配研究: 以北京为例. 地理科学进展, 2021, 40(4):541-553.]
|
| [24] |
|
| [25] |
|
| [26] |
[ 施迅, 王法辉. 地理信息技术在公共卫生与健康领域的应用. 北京: 高等教育出版社, 2016: 183-186.]
|
| [27] |
|
| [28] |
|
| [29] |
|
| [30] |
[ 程敏, 连月娇. 基于改进潜能模型的城市医疗设施空间可达性: 以上海市杨浦区为例. 地理科学进展, 2018, 37(2):266-275.]
|
| [31] |
|
| [32] |
|
| [33] |
|
| [34] |
|
| [35] |
|
| [36] |
|
| [37] |
[ 王成金. 中国交通流的衰减函数模拟及特征. 地理科学进展, 2009, 28(5):690-696.]
|
| [38] |
[ 刘瑜, 龚俐, 童庆禧. 空间交互作用中的距离影响及定量分析. 北京大学学报(自然科学版), 2014, 50(3):526-534.]
|
| [39] |
|
| [40] |
[ 王奇. 基于改进两步移动搜索法的上海市医疗服务可达性分析[D]. 武汉: 武汉大学, 2019.]
|
| [41] |
[ 江道琪. 实用线性规划方法及其支持系统. 北京: 清华大学出版社, 2006: 193-197.]
|
| [42] |
[ 傅家良. 运筹学方法与模型. 上海: 复旦大学出版社, 2014: 118-121.]
|
| [43] |
National Health Commission of the People's Republic of China. Standard of service capacity of community health service centers (2018 edition). http://www.nhc.gov.cn/jws/s7882/201809/d77cd05877b84909b0bd0e8b92a3e5f8.shtml, 2018-08-22.
[中华人民共和国国家卫生健康委员会. 社区卫生服务中心服务能力标准(2018年版). http://www.nhc.gov.cn/jws/s7882/201809/d77cd05877b84909b0bd0e8b92a3e5f8.shtml, 2018-08-22.]
|
| [44] |
National Health and Family Planning Commission of the People's Republic of China. More than 80% of residents can reach the nearest medical point within 15 minutes. http://www.nhc.gov.cn/libin/mtbd/201710/d25a52d908b64ba492dcd 212b5a91b86.shtml, 2017-10-22.
[中华人民共和国国家卫生何计划生育委员会. 80%以上居民15分钟内就能到达最近的医疗点. http://www.nhc.gov.cn/libin/mtbd/201710/d25a52d908b64ba492dcd212b5a91b86.shtml, 2017-10-22.]
|
| [45] |
[ 陶海燕, 陈晓翔, 黎夏. 公共医疗卫生服务的空间可达性研究: 以广州市海珠区为例. 测绘与空间地理信息, 2007(1):7-11.]
|
| [46] |
[ 王远飞. GIS与Voronoi多边形在医疗服务设施地理可达性分析中的应用. 测绘与空间地理信息, 2006, 29(3):77-80.]
|
/
| 〈 |
|
〉 |