
Effect of population flow control in restraining COVID-19 in China
Received date: 2020-10-09
Request revised date: 2021-06-09
Online published: 2022-04-19
Supported by
National Natural Science Foundation of China(41630749)
National Natural Science Foundation of China(42001176)
Youth Foundation of Humanities and Social Sciences of Ministry of Education(20YJCZH241)
Youth Foundation of Natural Science Foundation of Shandong Province(ZR2020QD009)
Copyright
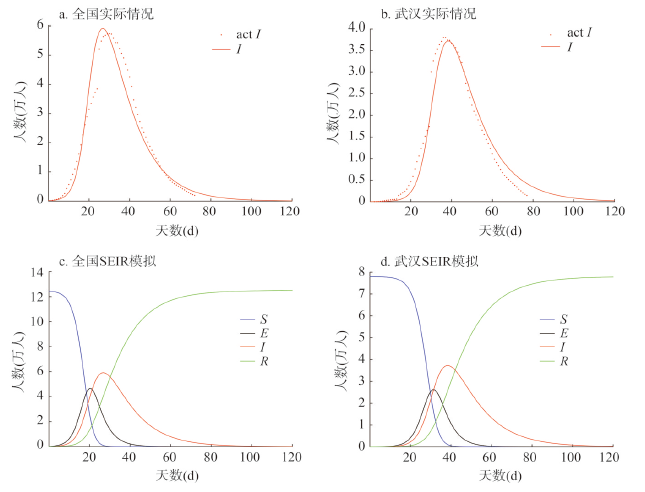
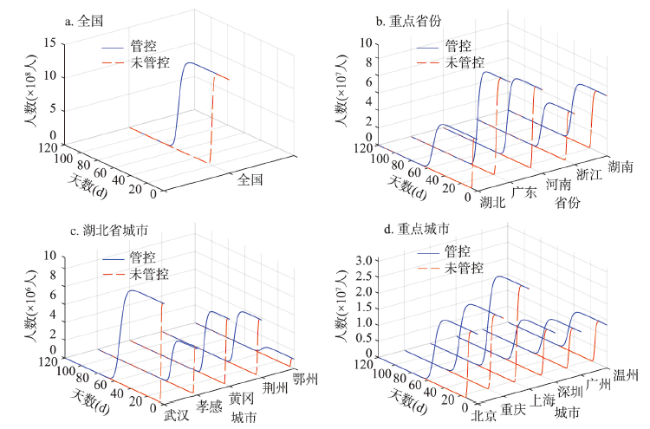
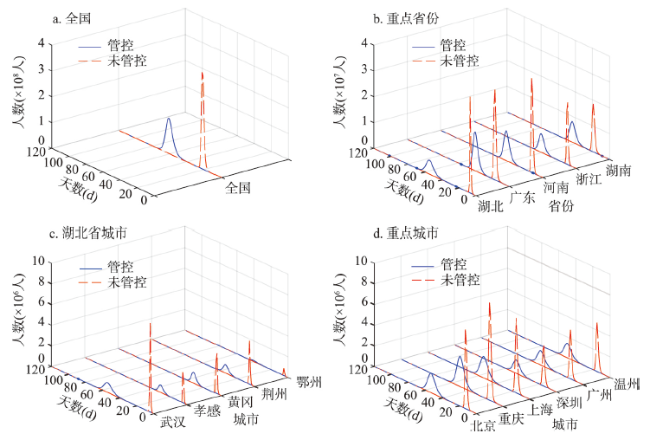
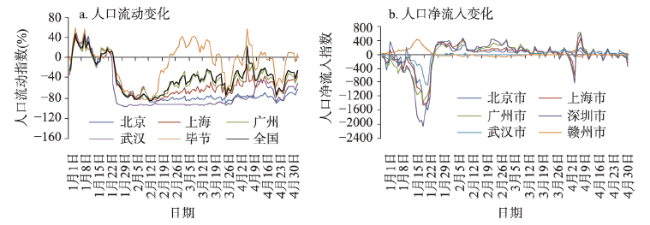
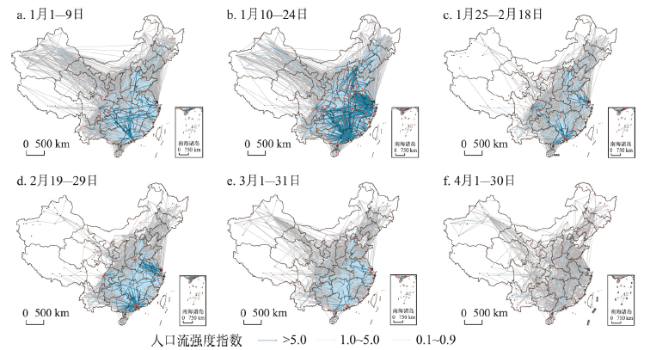
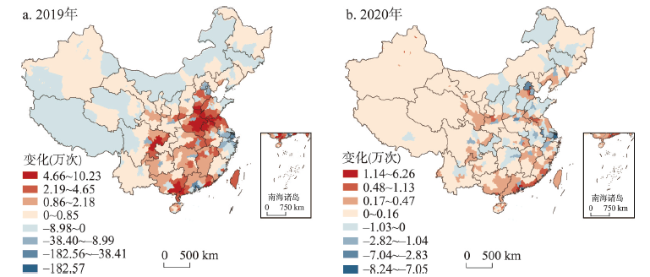
The Chinese government has curbed the rapid transmission of COVID-19 through a population flow control rarely seen in history. What is the effect of population flow control on pandemic prevention and control? How does it affect China's population mobility and short-term population distribution? In this paper, an SEIR model of virus transmission dynamics is used to evaluate the effectiveness of the control measures, and mobile location data are employed to track the temporal and spatial changes of population mobility in China, in order to review the positive and negative effects of population flow control during the major outbreaks of COVID-19: (1) Population flow control has significantly stabilized the daily new infection, serving as an essential part of China's non-pharmacological intervention measures in response to major public emergencies of COVID-19. Population flow control postponed the arrival of the peak day of daily new infections in China by 1.9 times, and reduced the number of newly infected people on that day by 63.4%. In the selected 5 provinces, 5 cities in Hubei, and 6 cities outside Hubei, the peak days were postponed by 1.4-8 times, 5.6-16.7 times, and 2.3-7.2 times, respectively, and the number of newly infected people on that day was reduced by 56.9%-85.5%, 62.2%-89.2%, and 67.1%-86.2%, respectively. Therefore, population flow control bought valuable buffer time for the prevention and control of the pandemic, and greatly weakened the impact of concentrated transmissions on medical facilities. (2) Population flow control limited intercity population flow. From January to April 2020, the average daily population flow intensity in China decreased by 40.18% compared with the same period in 2019. In particular, the coming-back-to-work flow after the Spring Festival travel rush in 2020 (from January 25 to February 18) decreased by 66.4% on average. (3) Population flow control and people's fear of the pandemic greatly affected the Spring Festival travel rush in 2020, and the spatial and temporal and distribution of China's population was changed for a short period. This paper helps the understanding of the impact of the population flow control strategy introduced by the government on major public emergencies, as well as the influences of geographical characteristics upon on the population flow and distribution.
Key words: COVID-19; traffic control; population flow; SEIR model; population geography; China
ZHAO Ziyu , HAN Zhonghui , WEI Ye , WANG Shijun . Effect of population flow control in restraining COVID-19 in China[J]. Acta Geographica Sinica, 2022 , 77(2) : 426 -442 . DOI: 10.11821/dlxb202202011
表1 回归变量及预期效应Tab. 1 Regression variables and expected effects |
| 变量名称 | 变量含义 | 预期效应 |
|---|---|---|
| NI_d | 武汉直接流入人口强度 | + |
| NI_u | 武汉间接流入人口强度 | + |
| Loc | 交通枢纽定位次数 | + |
| Dist | 到武汉直线距离 | - |
表2 确诊人数影响因素回归结果Tab. 2 Regression analysis of the influencing factors of the number of confirmed cases |
| 未标准化系数 | 标准误差 | 标准化系数 | VIF | |
|---|---|---|---|---|
| (常量) | -9.203 | 8.880 | ||
| NI_d | 1.634 | 0.026 | 0.939*** | 1.757 |
| NI_u | 0.600 | 0.164 | 0.069*** | 2.792 |
| Loc | 0.127 | 0.071 | 0.025* | 1.512 |
| Dist | 0.007 | 0.007 | 0.012 | 1.384 |
注:***和*分别代表p < 1%和p < 10%。 |
表3 空间分层异质性回归结果Tab. 3 Regression results of spatial stratified heterogeneity |
| NI_d | NI_u | Loc | Dist | |
|---|---|---|---|---|
| q统计 | 0.942 | 0.447 | 0.019 | 0.183 |
| p值 | 0.000 | 0.000 | 0.514 | 0.000 |
表4 新增传染人数波峰到达天数与当日感染人数模拟Tab. 4 Simulation of the peak arrival days and number of infected persons on the same day |
| 分组 | 单元 | 新增传染人数峰值到达天数(d) | 新增传染人数峰值(万人) | ||||||
|---|---|---|---|---|---|---|---|---|---|
| 管控 | 不管控 | 差值 | 倍数 | 管控 | 不管控 | 差值 | 百分比(%) | ||
| 全国 | 全国 | 60 | 21 | 39 | 1.9 | 13660 | 37367 | -23707 | -63.4 |
| 重点省份 | 湖北 | 54 | 6 | 48 | 8.0 | 541 | 3729 | -3188 | -85.5 |
| 广东 | 39 | 16 | 23 | 1.4 | 1507 | 3497 | -1990 | -56.9 | |
| 河南 | 42 | 12 | 30 | 2.5 | 1159 | 3649 | -2490 | -68.2 | |
| 浙江 | 40 | 9 | 31 | 3.4 | 719 | 2410 | -1691 | -70.2 | |
| 湖南 | 43 | 18 | 25 | 1.4 | 799 | 1867 | -1069 | -57.2 | |
| 湖北城市 | 武汉 | 53 | 3 | 50 | 16.7 | 93 | 863 | -770 | -89.2 |
| 孝感 | 30 | 4 | 26 | 6.5 | 73 | 297 | -224 | -75.4 | |
| 黄冈 | 31 | 4 | 27 | 6.8 | 105 | 392 | -287 | -73.2 | |
| 荆州 | 33 | 5 | 28 | 5.6 | 81 | 419 | -338 | -80.6 | |
| 鄂州 | 39 | 3 | 36 | 12.0 | 10 | 26 | -16 | -62.2 | |
| 重点城市 | 北京 | 52 | 12 | 40 | 3.3 | 188 | 766 | -578 | -75.5 |
| 重庆 | 50 | 15 | 35 | 2.3 | 293 | 944 | -651 | -69.0 | |
| 上海 | 53 | 15 | 38 | 2.5 | 209 | 727 | -518 | -71.3 | |
| 深圳 | 46 | 14 | 32 | 2.3 | 129 | 391 | -262 | -67.1 | |
| 广州 | 49 | 14 | 35 | 2.5 | 139 | 474 | -334 | -70.6 | |
| 温州 | 49 | 6 | 43 | 7.2 | 82 | 595 | -513 | -86.2 | |
| [1] |
|
| [2] |
|
| [3] |
[ 刘卫东. 新冠肺炎疫情对经济全球化的影响分析. 地理研究, 2020, 39(7): 1439-1449.]
|
| [4] |
|
| [5] |
|
| [6] |
|
| [7] |
|
| [8] |
|
| [9] |
|
| [10] |
[ 赵梓渝, 魏冶, 杨冉, 等. 中国人口省际流动重力模型的参数标定与误差估算. 地理学报, 2019, 74(2): 203-221.]
|
| [11] |
|
| [12] |
|
| [13] |
[ 周成虎, 裴韬, 杜云艳, 等. 新冠肺炎疫情大数据分析与区域防控政策建议. 中国科学院院刊, 2020, 35(2): 200-203.]
|
| [14] |
[ 王姣娥, 杜德林, 魏冶, 等. 新冠肺炎疫情的空间扩散过程与模式研究. 地理研究, 2020, 39(7): 1450-1462.]
|
| [15] |
|
| [16] |
|
| [17] |
|
| [18] |
[ 朱宇, 丁金宏, 王桂新, 等. 近40年来的中国人口地理学: 一个跨学科研究领域的进展. 地理科学进展, 2017, 36(4): 466-482.]
|
| [19] |
[ 赵梓渝, 魏冶, 庞瑞秋, 等. 中国春运人口省际流动的时空与结构特征. 地理科学进展, 2017, 36(8): 952-964.]
|
| [20] |
|
| [21] |
|
| [22] |
|
| [23] |
|
| [24] |
|
| [25] |
|
| [26] |
[ 王霞, 唐三一, 陈勇, 等. 新型冠状病毒肺炎疫情下武汉及周边地区何时复工? 数据驱动的网络模型分析. 中国科学: 数学, 2020, 50(7): 969-978.]
|
| [27] |
|
| [28] |
|
| [29] |
|
| [30] |
|
| [31] |
|
| [32] |
|
| [33] |
|
| [34] |
|
| [35] |
|
| [36] |
|
| [37] |
|
| [38] |
[ 王劲峰, 徐成东. 地理探测器: 原理与展望. 地理学报, 2017, 72(1): 116-134.]
|
| [39] |
|
| [40] |
[ 赵梓渝, 王士君. 2015年我国春运人口省际流动的时空格局. 人口研究, 2017, 41(3): 101-112.]
|
| [41] |
|
| [42] |
Epidemiology Working Group for NCIP Epidemic Response, Chinese Center for Disease Control and Prevention. The epidemiological characteristics of an outbreak of 2019 novel coronavirus diseases (COVID-19) in China. Chinese Journal of Epidemiology, 2020, 41(2): 145-151.
|
| [43] |
|
| [44] |
|
| [45] |
|
| [46] |
|
/
| 〈 |
|
〉 |
