
China's changing population distribution and influencing factors: Insights from the 2020 census data
Received date: 2021-07-09
Request revised date: 2021-11-11
Online published: 2022-04-19
Supported by
Major Program of National Social Science Foundation of China(20&ZD173)
Copyright
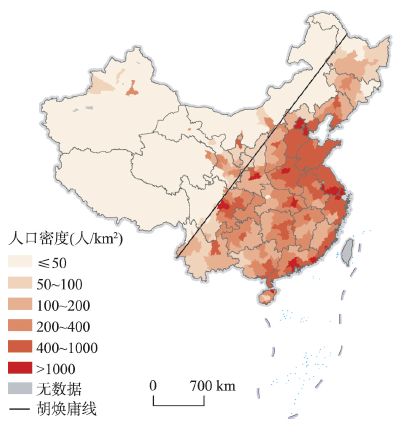
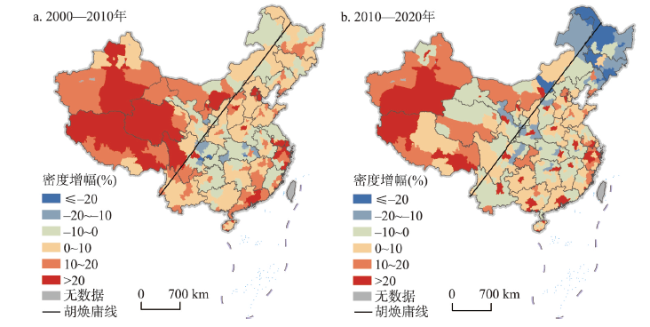
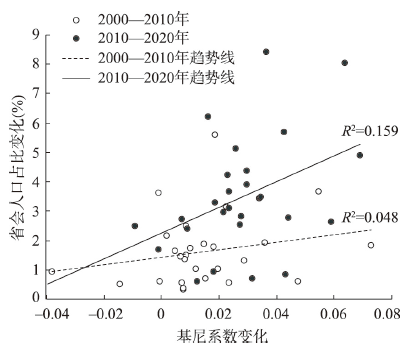
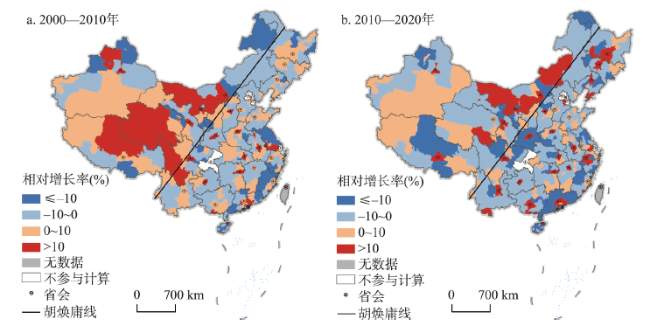
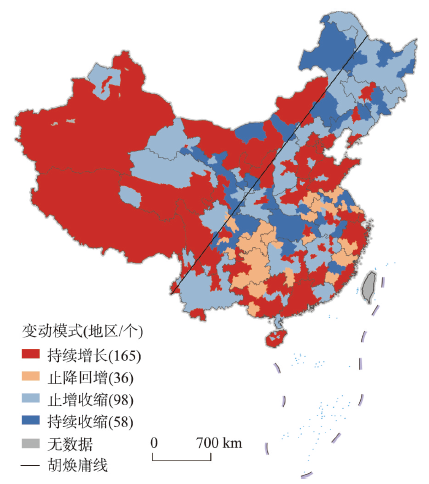
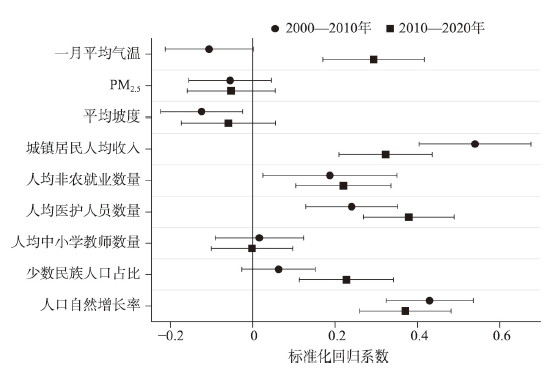
Using data of the latest three decennial censuses, this paper systematically analyzes the overall spatial pattern, changing trends, and influence mechanisms of China's population distribution since 2000. The study reveals that the general population distribution pattern of "dense east and sparse west" in China has not changed, which is determined by the differences in natural geographic environments on the two sides of Hu Line. In the first decade of the century, population concentration was mainly found in the southeastern area, but it has been observed in all regions in the recent decade. Provincial capitals have become the winners of population competition and the advantages of population growth of provincial capitals have been further strengthened in the recent decade compared with 2000-2010. However, the administrative power-led effects of the increasing dominance of provincial capitals will gradually weaken with the development of their provinces. The regional differentiation of population changes is also apparent: coastal region gradually forms a dense belt of population and towns with solid population attraction based on the development of urban agglomerations; the northeast region almost turns to a complete population shrinking status; central provinces still compete fiercely for population based on their capitals; the population of Sichuan, Chongqing, and Guizhou has stopped the decline and returned to growth; and the northwest region faces the risk of population loss. In addition, this paper finds that the driving factors of regional population growth have gradually changed from economic factors to both economic and amenity factors, and the difference of amenities among regions may become an important factor for future changes in China's population geography.

Key words: population distribution; Hu Line; spatial pattern; public services; population census; China
LIU Tao , PENG Rongxi , ZHUO Yunxia , CAO Guangzhong . China's changing population distribution and influencing factors: Insights from the 2020 census data[J]. Acta Geographica Sinica, 2022 , 77(2) : 381 -394 . DOI: 10.11821/dlxb202202008
表1 变量描述性统计Tab. 1 Descriptive statistics of variables |
| 变量 | 符号 | 2000年 | 2010年 | |||||||
|---|---|---|---|---|---|---|---|---|---|---|
| 均值 | 标准差 | 最小值 | 最大值 | 均值 | 标准差 | 最小值 | 最大值 | |||
| 常住人口增长率(%) | growth | 7.39 | 13.22 | -21.04 | 72.00 | 3.28 | 15.31 | -26.56 | 69.53 | |
| 基期人口密度(千人/km2) | density | 0.39 | 0.39 | 0.00 | 3.61 | 0.44 | 0.51 | 0.00 | 5.33 | |
| 省会 | capital | 0.11 | 0.31 | 0.00 | 1.00 | 0.11 | 0.31 | 0.00 | 1.00 | |
| 所在省份人均GDP(万元) | provpcGDP | 0.73 | 0.32 | 0.28 | 2.77 | 3.07 | 1.18 | 1.32 | 7.46 | |
| 省域人口分布基尼系数 | provgini | 0.34 | 0.18 | 0.11 | 0.79 | 0.36 | 0.17 | 0.12 | 0.75 | |
| 一月平均气温(℃) | temJan | -1.36 | 9.96 | -25.99 | 20.56 | 0.25 | 9.34 | -24.80 | 21.21 | |
| PM2.5 | pm25 | 22.38 | 11.63 | 0.79 | 62.33 | 36.30 | 17.30 | 2.78 | 74.80 | |
| 平均坡度(°) | slope | 5.34 | 3.90 | 0.16 | 18.12 | 5.34 | 3.90 | 0.16 | 18.12 | |
| 城镇居民人均收入(千元) | incomeu | 5.92 | 2.05 | 3.22 | 21.63 | 17.15 | 4.44 | 8.26 | 35.69 | |
| 人均非农就业数量 | pcemp | 0.26 | 0.10 | 0.02 | 0.65 | 0.35 | 0.10 | 0.12 | 0.68 | |
| 每百人医护人员数 | pcmedp | 0.35 | 0.13 | 0.03 | 1.01 | 0.44 | 0.13 | 0.16 | 0.96 | |
| 每百人中小学教师数 | pctch | 0.82 | 0.15 | 0.20 | 1.46 | 0.83 | 0.16 | 0.42 | 1.33 | |
| 少数民族人口占比(%) | ethp | 11.64 | 21.78 | 0.04 | 97.73 | 11.53 | 21.67 | 0.01 | 96.91 | |
| 人口自然增长率(‰) | ngrowth | 5.88 | 3.35 | -1.17 | 17.42 | 4.89 | 3.27 | -2.74 | 16.14 | |
注:常住人口增长率在2000年和2010年的值分别为2000—2010年和2010—2020年的常住人口增长率;其他变量均为当年数值。 |
表2 2000—2020年各区域人口分布基尼系数变化Tab. 2 The change of Gini coefficients of the four regions of China from 2000 to 2020 |
| 2000年 | 2010年 | 2020年 | ||
|---|---|---|---|---|
| 全国 | 0.711 | 0.718 | 0.735 | |
| 胡焕庸线两侧 | 东南半壁 | 0.517 | 0.534 | 0.566 |
| 西北半壁 | 0.754 | 0.748 | 0.752 | |
| 四大地区 | 东部 | 0.365 | 0.398 | 0.427 |
| 中部 | 0.302 | 0.305 | 0.336 | |
| 西部 | 0.773 | 0.765 | 0.771 | |
| 东北 | 0.449 | 0.459 | 0.504 | |
表3 回归分析结果Tab. 3 Results of econometric models |
| 变量 | (1) 基期人口密度 | (2) 基期人口密度×胡焕庸线 | (3) 基期人口密度×四大地区 | |||||
|---|---|---|---|---|---|---|---|---|
| 2000—2010年 | 2010—2020年 | 2000—2010年 | 2010—2020年 | 2000—2010年 | 2010—2020年 | |||
| density | 4.54(1.27) | 6.37***(3.91) | 4.82(1.38) | 6.21***(3.73) | 5.46(1.47) | 4.82***(2.78) | ||
| northwest | 4.02(1.26) | 6.36**(2.26) | ||||||
| density×northwest | 2.23(0.10) | 13.04(0.61) | ||||||
| central | 0.26(0.11) | -11.95***(-4.22) | ||||||
| density×central | -3.71(-0.73) | 18.69***(3.21) | ||||||
| west | -0.15(-0.05) | -8.74***(-2.79) | ||||||
| density×west | -6.57(-0.91) | 23.32***(2.97) | ||||||
| northeast | -5.42*(-1.67) | -19.54***(-6.08) | ||||||
| density×northeast | -8.00(-0.90) | 37.06***(5.53) | ||||||
| 控制变量 | 控制 | 控制 | 控制 | 控制 | 控制 | 控制 | ||
| 常数项 | -37.39*** (-5.38) | -53.89*** (-7.22) | -37.27*** (-5.36) | -54.06*** (-7.37) | -28.98*** (-3.24) | -39.14*** (-4.77) | ||
| 观测数 | 290 | 290 | 290 | 290 | 290 | 290 | ||
| 调整R2 | 0.569 | 0.568 | 0.574 | 0.637 | 0.578 | 0.670 | ||
| 变量 | (4) 省会 | (5) 省会×省基尼系数 | (6) 省会×省人均GDP | |||||
| 2000—2010年 | 2010—2020年 | 2000—2010年 | 2010—2020年 | 2000—2010年 | 2010—2020年 | |||
| density | 4.10(1.23) | 5.56***(2.95) | 3.10(0.91) | 6.84***(4.72) | 3.46(1.02) | 6.80***(4.77) | ||
| capital | 6.67***(3.65) | 15.31***(5.92) | 8.49**(2.04) | 18.09***(3.19) | 8.54*(1.83) | 35.51***(6.83) | ||
| provgini | 5.66(1.56) | 3.49(0.87) | ||||||
| capital×provgini | -6.67(-0.71) | -2.10(-0.14) | ||||||
| provpcGDP | 1.49(0.65) | 0.17(0.29) | ||||||
| capital×provpcGDP | -3.14(-0.49) | -6.24***(-4.57) | ||||||
| 控制变量 | 控制 | 控制 | 控制 | 控制 | 控制 | 控制 | ||
| 常数项 | -36.57*** (-5.50) | -49.06*** (-7.39) | -37.57*** (-5.51) | -54.27*** (-7.15) | -35.00*** (-5.22) | -54.36*** (-8.57) | ||
| 观测数 | 290 | 290 | 286 | 286 | 286 | 286 | ||
| 调整R2 | 0.588 | 0.691 | 0.568 | 0.723 | 0.565 | 0.738 | ||
注:括号内为采用稳健标准误的t值;*p < 0.1,**p < 0.05,***p < 0.01。 |
| [1] |
|
| [2] |
[ 马颖忆, 陆玉麒, 张莉. 江苏省人口空间格局演化特征. 地理科学进展, 2012, 31(2): 167-175.]
|
| [3] |
|
| [4] |
[ 毛其智, 龙瀛, 吴康. 中国人口密度时空演变与城镇化空间格局初探: 从2000年到2010年. 城市规划, 2015, 39(2): 38-43.]
|
| [5] |
|
| [6] |
|
| [7] |
[ 刘睿文, 封志明, 杨艳昭, 等. 基于人口集聚度的中国人口集疏格局. 地理科学进展, 2010, 29(10): 1171-1177.]
|
| [8] |
[ 李佳洺, 陆大道, 徐成东, 等. 胡焕庸线两侧人口的空间分异性及其变化. 地理学报, 2017, 72(1): 148-160.]
|
| [9] |
[ 封志明, 唐焰, 杨艳昭, 等. 中国地形起伏度及其与人口分布的相关性. 地理学报, 2007, 62(10): 1073-1082.]
|
| [10] |
[ 吕晨, 樊杰, 孙威. 基于ESDA的中国人口空间格局及影响因素研究. 经济地理, 2009, 29(11): 1797-1802.]
|
| [11] |
[ 胡焕庸. 中国人口之分布: 附统计表与密度图. 地理学报, 1935, 2(2): 33-74.]
|
| [12] |
[ 刘睿文, 封志明, 游珍. 中国人口集疏格局与形成机制研究. 中国人口·资源与环境, 2010, 20(3): 89-94.]
|
| [13] |
[ 李雨停, 丁四保, 王荣成. 地理成本与人口空间分布格局研究. 中国人口·资源与环境, 2009, 19(5): 82-87.]
|
| [14] |
[ 葛美玲, 封志明. 中国人口分布的密度分级与重心曲线特征分析. 地理学报, 2009, 64(2): 202-210.]
|
| [15] |
[ 柏中强, 王卷乐, 杨雅萍, 等. 基于乡镇尺度的中国25省区人口分布特征及影响因素. 地理学报, 2015, 70(8): 1229-1242.]
|
| [16] |
[ 葛美玲, 封志明. 基于GIS的中国2000年人口之分布格局研究: 兼与胡焕庸1935年之研究对比. 人口研究, 2008, 32(1): 51-57.]
|
| [17] |
[ 杨波. 中国县域人口空间分布格局研究. 西北人口, 2014, 35(3): 33-36, 42.]
|
| [18] |
[ 曾永明, 张利国. 中国人口空间分布格局演变与非均衡性测度: 基于分县尺度人口普查数据: 1990—2010. 南方人口, 2017, 32(5): 68-80.]
|
| [19] |
[ 杨强, 李丽, 王运动, 等. 1935—2010年中国人口分布空间格局及其演变特征. 地理研究, 2016, 35(8): 1547-1560.]
|
| [20] |
[ 刘涛, 齐元静, 曹广忠. 中国流动人口空间格局演变机制及城镇化效应: 基于2000和2010年人口普查分县数据的分析. 地理学报, 2015, 70(4): 567-581.]
|
| [21] |
[ 刘盛和, 邓羽, 胡章. 中国流动人口地域类型的划分方法及空间分布特征. 地理学报, 2010, 65(10): 1187-1197.]
|
| [22] |
[ 朱传耿, 顾朝林, 马荣华, 等. 中国流动人口的影响要素与空间分布. 地理学报, 2001, 56(5): 548-559.]
|
| [23] |
|
| [24] |
[ 白永平, 周鹏, 武荣伟, 等. 中国地级及以上城市人口流动对城镇化效应分析. 干旱区资源与环境, 2016, 30(9): 78-84.]
|
| [25] |
[ 邹湘江. 基于“六普”数据的我国人口流动与分布分析. 人口与经济, 2011(6): 23-27, 33.]
|
| [26] |
[ 马红旗, 陈仲常. 我国省际流动人口的特征: 基于全国第六次人口普查数据. 人口研究, 2012, 36(6): 87-99.]
|
| [27] |
[ 车冰清, 仇方道. 基于镇域尺度的江苏省人口分布空间格局演变. 地理科学, 2015, 35(11): 1381-1387.]
|
| [28] |
|
| [29] |
[ 武前波, 惠聪聪. 新时期我国中心城市人口城镇化特征及其空间格局. 世界地理研究, 2020, 29(3): 523-535.]
|
| [30] |
[ 陈明星, 李扬, 龚颖华, 等. 胡焕庸线两侧的人口分布与城镇化格局趋势: 尝试回答李克强总理之问. 地理学报, 2016, 71(2): 179-193.]
|
| [31] |
[ 段成荣, 刘涛, 吕利丹. 当前我国人口流动形势及其影响研究. 山东社会科学, 2017(9): 63-69.]
|
| [32] |
[ 孙志燕, 侯永志. 对我国区域不平衡发展的多视角观察和政策应对. 管理世界, 2019, 35(8): 1-8.]
|
| [33] |
[ 蔡昉, 陈晓红, 张军, 等. 研究阐释党的十九届五中全会精神笔谈. 中国工业经济, 2020(12): 5-27.]
|
| [34] |
|
| [35] |
[ 张耀军, 岑俏. 中国人口空间流动格局与省际流动影响因素研究. 人口研究, 2014, 38(5): 54-71.]
|
| [36] |
[ 段成荣, 谢东虹, 吕利丹. 中国人口的迁移转变. 人口研究, 2019, 43(2): 12-20.]
|
| [37] |
[ 戚伟, 刘盛和, 赵美风. “胡焕庸线”的稳定性及其两侧人口集疏模式差异. 地理学报, 2015, 70(4): 551-566.]
|
| [38] |
[ 李聪, 宗会明, 肖磊. 中国典型人口流出地区人口流动格局: 以川渝地区为例. 热带地理, 2021, 41(3): 516-527.]
|
| [39] |
[ 魏守华, 杨阳, 陈珑隆. 城市等级、人口增长差异与城镇体系演变. 中国工业经济, 2020(7): 5-23.]
|
| [40] |
[ 翟振武, 刘雯莉. 七普数据质量与中国人口新“变化”. 人口研究, 2021, 45(3): 46-56.]
|
/
| 〈 |
|
〉 |