
Spatiotemporal characteristics and influencing factors of the epidemic disasters for the past 3000 years in China
Received date: 2020-06-05
Request revised date: 2021-07-08
Online published: 2021-10-25
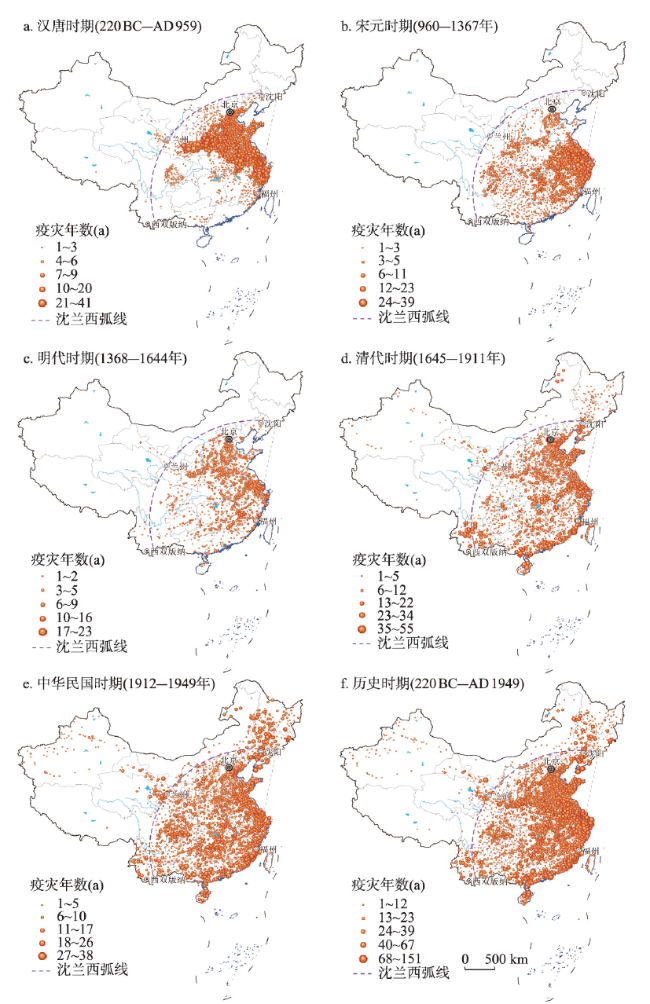
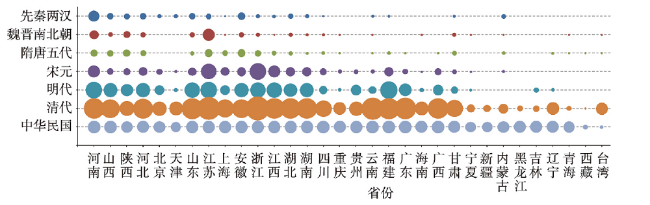
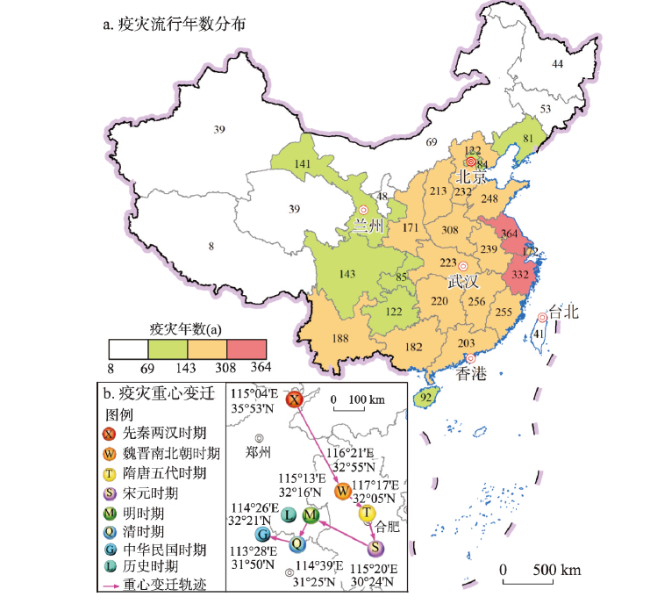
Supported by
National Natural Science Foundation of China(41171408)
National Social Science Foundation of China(12&ZD145)
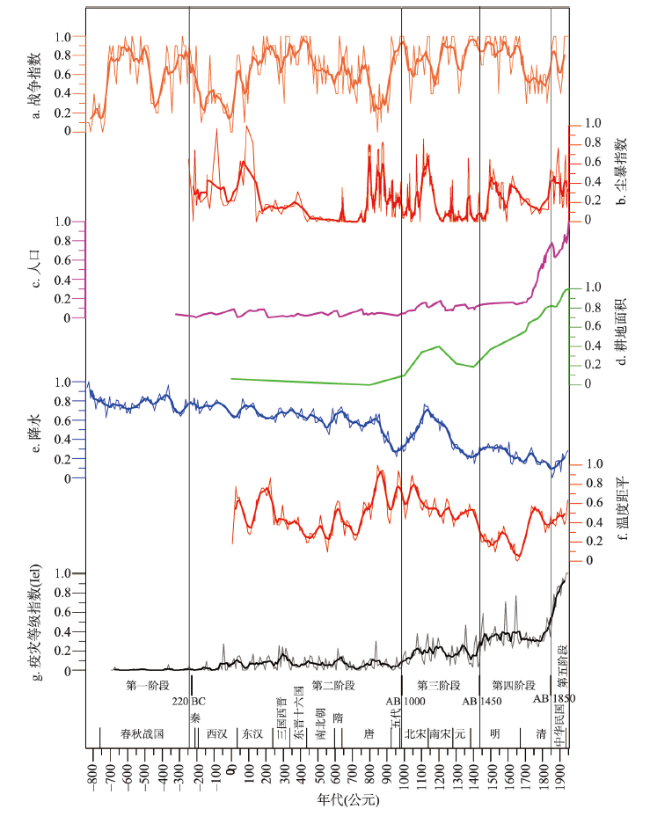
Copyright
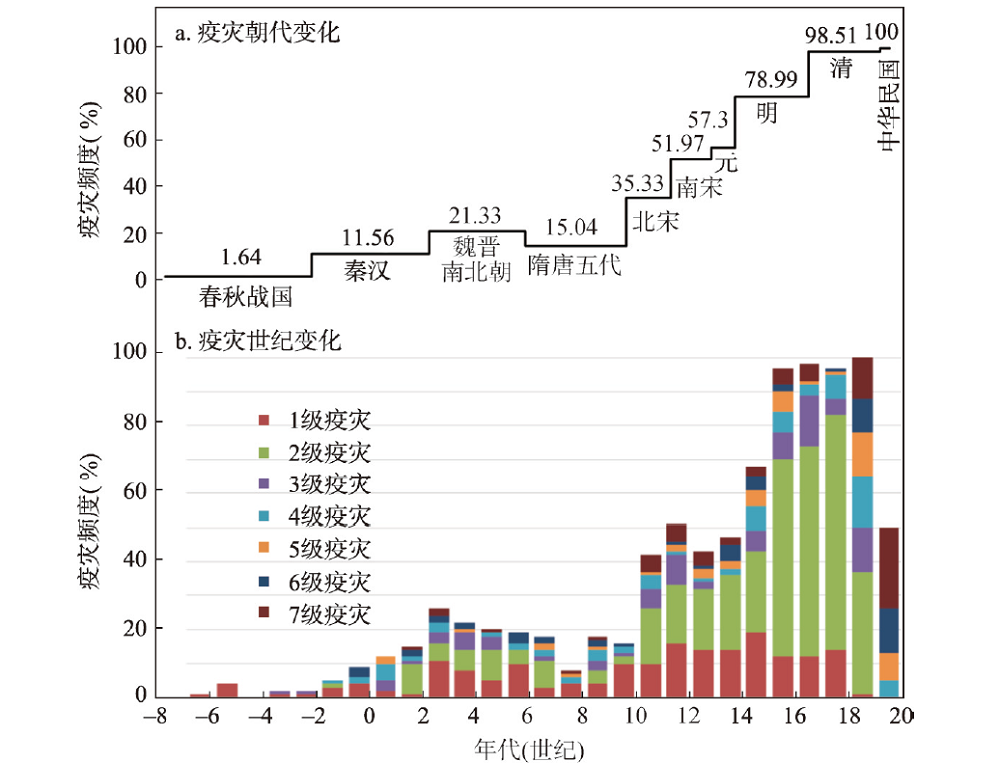
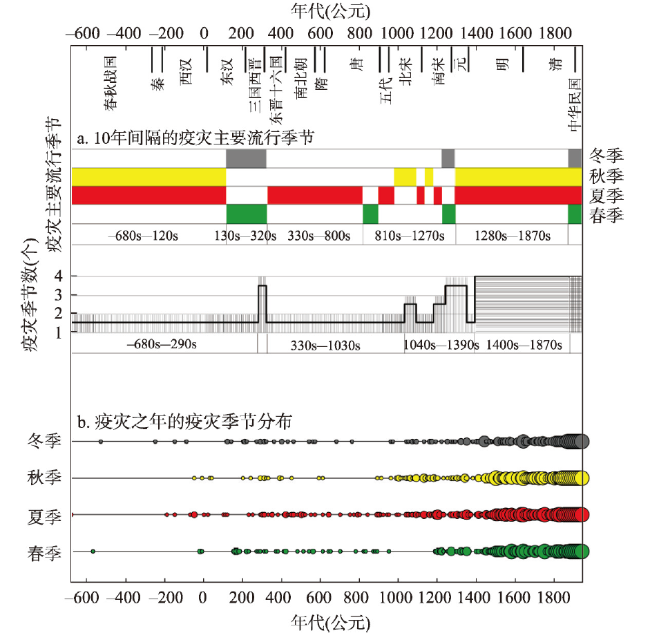
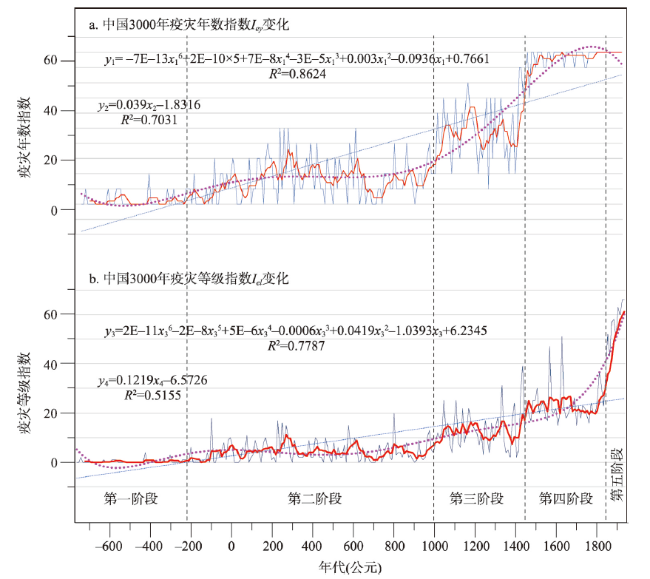
Epidemics are one of the most severe events in the human disaster network. On the basis of establishing the epidemic sequence by using historical epidemic data, and using the methods such as historical section analysis, factor correlation analysis, and time sequence analysis, this article examines the spatiotemporal characteristics and causes of the epidemic disasters for the past 2720 years (770 BC-AD 1949) in China. The results show that: (1) The frequency and intensity of epidemic disasters in China have a long-term upward trend, with troughs in the warm periods and peaks in the cold periods. (2) The epidemic prevalence in China generally occurred mainly in summer and autumn, but varied with time, so that since the 1450s, the seasonal difference tended to be less significant due to the increase of the kinds and frequency of epidemics. (3) China's epidemic fluctuation cycles are mainly 620-610 a, 320-310 a, 230-220 a, 170 a, 90 a, etc., which confirms the existence of "Twelve Earthly Branches" cycle and the significant impact of sunspot activity on the epidemic cycles. (4) For the past 3000 years, within the China's territory, the Epidemic Widespread is 93.51%, which indicates the percentage of the number of affected counties to the total number of counties, and the Epidemic Thickness is 16.86 layers, which represents the ratio of cumulative affected counties to the total number of administrative counties. The epidemics in the southeast half of China occurred much more frequently and severely than those in the northwest half. (5) The expansion of the epidemic prevalent areas in China is synchronized with the areal land exploration. The change of the epidemic centers of gravity is obviously affected by the spatial changes of the economic centers of gravity. The centers shifted from north to south before the Southern Song Dynasty, and moved from east to west after that. The import of foreign infectious diseases has a great impact on the distribution pattern of epidemics in China. (6) The prevalence of epidemics is not only a natural phenomenon, but also a sociocultural phenomenon. The change in the spatiotemporal distribution of epidemics reflects the change of human-environmental relationship. The densely populated areas, the areas along the traffic line, the surrounding areas of the capital city, the natural foci areas and the disaster-prone areas are all epidemic-prone areas. (7) The geographical environment has a basic impact on the spatial distribution of epidemics, that is, low altitude, warm and humid areas are prone to the prevalence of epidemics. Natural disasters can induce epidemics, so the disaster-prone area is also the epidemic-prone area, and the disaster-prone period is also the epidemic-prone period. Climate change has impacts on epidemic fluctuations, so epidemics are more frequent in the cold periods than in the warm periods. The land excessive development and the conflict between human and land resulting from population growth intensified the epidemic prevalence. Moreover, epidemics always follow wars, that is, the frequent periods of war are also the frequent periods of epidemic.
GONG Shengsheng , LI Zimo , XIE Haichao , WANG Xiaowei , ZHANG Tao , SHI Guoning , CHEN Fahu . Spatiotemporal characteristics and influencing factors of the epidemic disasters for the past 3000 years in China[J]. Acta Geographica Sinica, 2021 , 76(8) : 1976 -1996 . DOI: 10.11821/dlxb202108012
表1 中国3000年疫灾等级划分标准Tab. 1 Division standard of epidemic levels for the past 3000 years in China |
| 定性描述 | 微疫 | 小疫 | 中疫 | 大疫 | 巨疫 | 特大疫 | 超大疫 |
|---|---|---|---|---|---|---|---|
| Le | 1级 | 2级 | 3级 | 4级 | 5级 | 6级 | 7级 |
| Nec (个) | 1~3 | 4~29 | 30~50 | 51~190 | 191~419 | 420~644 | 645~833 |
| Ned (人) | ≤ 2000 | 2000~5000 | 5000~10000 | 10000~30000 | 30000~50000 | 50000~100000 | > 100000 |
表2 中国3000年各世纪的疫灾等级结构表Tab. 2 The structure of levels of epidemic disasters for the past 3000 years in China |
| 世纪 | BC7 | BC6 | BC5 | BC4 | BC3 | BC2 | BC1 | 1 | 2 | 3 | 4 | 5 | 6 | 7 | 8 | 9 | 10 | 11 | 12 | 13 | 14 | 15 | 16 | 17 | 18 | 19 | 20 | 小计 |
|---|---|---|---|---|---|---|---|---|---|---|---|---|---|---|---|---|---|---|---|---|---|---|---|---|---|---|---|---|
| 1级疫灾 | 1 | 4 | 0 | 1 | 1 | 3 | 4 | 2 | 1 | 11 | 8 | 5 | 10 | 3 | 4 | 4 | 10 | 10 | 16 | 14 | 14 | 19 | 12 | 12 | 14 | 1 | 0 | 184 |
| 2级疫灾 | 0 | 0 | 0 | 0 | 0 | 1 | 0 | 0 | 9 | 5 | 6 | 9 | 4 | 8 | 0 | 4 | 2 | 16 | 17 | 18 | 22 | 24 | 58 | 62 | 69 | 36 | 0 | 370 |
| 3级疫灾 | 0 | 0 | 0 | 1 | 1 | 0 | 0 | 3 | 1 | 3 | 5 | 4 | 0 | 1 | 0 | 3 | 1 | 6 | 9 | 2 | 0 | 6 | 8 | 15 | 5 | 13 | 0 | 87 |
| 4级疫灾 | 0 | 0 | 0 | 0 | 0 | 1 | 2 | 5 | 1 | 3 | 0 | 1 | 2 | 2 | 2 | 3 | 2 | 4 | 1 | 1 | 2 | 7 | 6 | 3 | 7 | 15 | 5 | 75 |
| 5级疫灾 | 0 | 0 | 0 | 0 | 0 | 0 | 0 | 2 | 0 | 0 | 1 | 0 | 0 | 2 | 1 | 1 | 0 | 1 | 2 | 3 | 2 | 5 | 6 | 1 | 1 | 13 | 8 | 49 |
| 6级疫灾 | 0 | 0 | 0 | 0 | 0 | 0 | 3 | 0 | 2 | 2 | 2 | 0 | 3 | 2 | 0 | 2 | 1 | 0 | 1 | 1 | 5 | 4 | 2 | 0 | 1 | 10 | 13 | 54 |
| 7级疫灾 | 0 | 0 | 0 | 0 | 0 | 0 | 0 | 0 | 1 | 2 | 0 | 1 | 0 | 0 | 1 | 1 | 0 | 5 | 5 | 4 | 2 | 3 | 5 | 5 | 0 | 12 | 24 | 71 |
| 合计 | 1 | 4 | 0 | 2 | 2 | 5 | 9 | 12 | 15 | 26 | 22 | 20 | 19 | 18 | 8 | 18 | 16 | 42 | 51 | 43 | 47 | 68 | 97 | 98 | 97 | 100 | 50 | 890 |
注:20世纪的疫灾为1900—1949年的疫灾,即仅半个世纪的疫灾。 |
表3 中国3000年疫灾流行的主周期Tab. 3 Main cycles of epidemic prevalence for the past 3000 years in China |
| 疫灾指数序列 | 全时段(770 BC—AD 1949) | 前时段(770 BC—AD 960) | 后时段(AD 960—AD 1949) |
|---|---|---|---|
| 疫灾年数指数序列Iey | 910 a、620 a、220 a | 320 a、170 a | 610 a、370 a、230 a;310*a、170*a |
| 疫灾等级时点序列Ley | 612 a | 72 a | 96 a |
| 疫灾等级指数序列Iel | 1300 a、620 a | 410 a、250 a | 220 a、90 a |
| 疫灾等级平均序列Ael | 1330 a、960 a、590 a | 960 a、390 a、260 a | 560 a、90 a、230 a |
注:*为Iec对数序列周期;除Ley为即年的时点序列外,其余均为10 a间隔的时期序列。 |
表4 中国历史时期各时间断面的疫灾空间分异Tab. 4 Spatial differentiation of epidemic disasters in different sections of Chinese historical period |
| 区域范围 | 政区县数(个) | 项目 | 汉唐时期 | 宋元时期 | 明代时期 | 清代时期 | 中华民国时期 | 历史时期 |
|---|---|---|---|---|---|---|---|---|
| 全国版图 | 2435 | Nec (个) | 1207 | 1499 | 953 | 1754 | 2201 | 2277 |
| ∑Nec (县次) | 5116 | 4903 | 3019 | 10480 | 17546 | 41064 | ||
| Wec (%) | 49.57 | 61.56 | 39.14 | 72.03 | 90.39 | 93.51 | ||
| Te (层) | 2.10 | 2.01 | 1.24 | 4.30 | 7.21 | 16.86 | ||
| 东南半壁 | 1927 | Nec (个) | 1171 | 1495 | 937 | 1558 | 1854 | 1911 |
| ∑Nec (县次) | 5079 | 4898 | 2994 | 9711 | 15148 | 37830 | ||
| Wec (%) | 60.77 | 77.58 | 48.62 | 80.85 | 96.21 | 99.17 | ||
| Te (层) | 2.64 | 2.54 | 1.55 | 5.04 | 7.86 | 19.63 | ||
| 西北半壁 | 508 | Nec (个) | 36 | 4 | 16 | 196 | 347 | 366 |
| ∑Nec (县次) | 37 | 5 | 25 | 769 | 2398 | 3234 | ||
| Wec (%) | 7.09 | 0.79 | 3.15 | 38.58 | 68.31 | 72.05 | ||
| Te (层) | 0.07 | 0.01 | 0.05 | 1.51 | 4.72 | 6.37 |
表5 中国3000年疫灾与地理环境、自然灾害、气候变迁的相关系数Tab. 5 Correlation coefficient of epidemic disasters with geographical environment, natural disasters and climate change for the past 3000 years in China |
| 分析阶段 | 历年数(a) | 站点数(个) | 时空关系 | 年均气温/ 气温指数 | 年均降水/ 干湿指数 | 平均 海拔 | 旱灾 | 水灾 | 蝗灾 | 地震 | 饥荒 |
|---|---|---|---|---|---|---|---|---|---|---|---|
| 汉唐时期 200 BC—AD 959 | 1160 | 63 | 空间站点相关 | 0.55*** | 0.48*** | -0.37** | 0.82*** | 0.65*** | 0.61*** | 0.64*** | 0.64*** |
| 时间序列相关 | -0.37*** | -0.14 | - | 0.09 | 0.15 | 0.17 | 0.24*** | 0.18** | |||
| 宋元时期 960—1396年 | 410 | 454 | 空间站点相关 | 0.29*** | 0.29*** | -0.16*** | 0.16*** | 0.19*** | -0.12** | 0.22*** | 0.21*** |
| 时间序列相关 | -0.28* | -0.32** | - | 0.18* | 0.41*** | 0.23 | 0.44*** | 0.33** | |||
| 明代时期 1360—1649年 | 290 | 238 | 空间站点相关 | 0.16** | 0.07 | -0.44*** | 0.66*** | 0.68*** | 0.56*** | 0.39*** | - |
| 时间序列相关 | -0.61*** | -0.35* | - | 0.86*** | 0.74*** | 0.68*** | 0.64*** | - | |||
| 清代时期 1640—1909年 | 270 | 638 | 空间站点相关 | 0.05 | 0.09 | -0.40*** | 0.54*** | 0.52*** | 0.43*** | 0.40*** | 0.51*** |
| 时间序列相关 | -0.09 | -0.19 | - | 0.18 | 0.40** | 0.39** | 0.34* | 0.35** |
注:***表示显著水平为0.01,**表示显著水平为0.05,*表示显著水平为0.1。表中相关系数系对原始数据进行归一化处理后计算所得。 |
表6 中国3000年疫灾变化与气候变迁、土地开发、战争动乱的相关系数表Tab. 6 Correlation coefficient of epidemic disasters and climate change, land development and war/disturbance for the past 3000 years in China |
| 相关分析区间 | 温度距平 | 降水量 | 尘暴指数 | 人口总数 | 耕地面积 | 战争指数 |
|---|---|---|---|---|---|---|
| 近3000年疫灾指数 (840 BC—AD 1949) | -0.31*** | -0.79*** | 0.10* | 0.65*** | 0.99*** | 0.25*** |
| 近2000年疫灾指数 (0—1949年) | -0.31*** | -0.71*** | 0.17** | 0.64** | 0.92** | 0.15** |
| 近1000年疫灾指数 (960—1949年) | -0.60*** | -0.51*** | 0.27** | 0.54*** | 0.82*** | -0.21** |
感谢匿名评审专家提出的宝贵意见,他们认真严谨的审阅和建设性建议使拙文质量得到了提升!
| [1] |
[ 程杨, 杨林生, 李海蓉. 全球环境变化与人类健康. 地理科学进展, 2006, 25(2):46-58.]
|
| [2] |
|
| [3] |
[ 吴晓旭, 田怀玉, 周森, 等. 全球变化对人类传染病发生与传播的影响. 中国科学: 地球科学, 2013, 43(11):1743-1759.]
|
| [4] |
[ 龚胜生. 中国疫灾的时空分布变迁规律. 地理学报, 2003, 58(6):870-878.]
|
| [5] |
[ 龚胜生. 中国三千年疫灾史料汇编. 济南: 齐鲁书社, 2019.]
|
| [6] |
[ 龚胜生. 历史医学地理学刍议. 中国历史地理论丛, 1998, 13(4):71-91.]
|
| [7] |
[ 龚胜生, 刘杨, 张涛. 先秦两汉时期疫灾地理研究. 中国历史地理论丛, 2010, 25(3):96-112.]
|
| [8] |
[ 龚胜生, 叶护平. 魏晋南北朝时期疫灾时空分布规律研究. 中国历史地理论丛, 2007, 22(3):5-20.]
|
| [9] |
[ 龚胜生. 隋唐五代时期疫灾地理研究. 暨南史学(第三辑). 2004: 32-51.]
|
| [10] |
[ 龚胜生, 刘卉. 北宋时期疫灾地理研究. 中国历史地理论丛, 2011, 26(4):22-34.]
|
| [11] |
[ 龚胜生, 龚冲亚, 王晓伟. 南宋时期疫灾地理研究. 中国历史地理论丛, 2015, 30(1):19-34.]
|
| [12] |
[ 龚胜生, 王晓伟, 龚冲亚. 元朝疫灾地理研究. 中国历史地理论丛, 2015, 30(2):24-40.]
|
| [13] |
[ 韩毅. 宋代瘟疫的流行与防治. 北京: 商务印书馆, 2015: 11-108.]
|
| [14] |
[ 王晓伟. 宋元时期疫灾时空分布与环境机理研究[D]. 武汉: 华中师范大学, 2016.]
|
| [15] |
[ 张涛. 明代疫灾时空分布及环境机理研究[D]. 武汉: 华中师范大学, 2015.]
|
| [16] |
[ 李孜沫. 清代疫灾流行的环境机理研究[D]. 武汉: 华中师范大学, 2018.]
|
| [17] |
[ 程杨, 李海蓉, 杨林生. 中国明清时期疫病时空分布规律的定量研究. 地理研究, 2009, 28(4):1059-1068.]
|
| [18] |
[ 张泰山. 民国时期的传染病与社会. 北京: 社会科学文献出版社, 2008: 42-69.]
|
| [19] |
[ 孙关龙. 中国历史大疫的时空分布及其规律研究. 地域研究与开发, 2004, 23(6):123-128.]
|
| [20] |
[ 刘静, 殷淑燕. 中国历史时期重大疫灾时空分布规律及其与气候变化关系. 自然灾害学报, 2016, 25(1):137-146.]
|
| [21] |
[ 龚胜生, 谢海超, 陈发虎. 2200年来我国瘟疫灾害的时空变化及其与生存环境的关系. 中国科学: 地球科学, 2020, 50(5):719-722.]
|
| [22] |
[ 龚胜生, 王晓伟, 张涛. 明代江南地区的疫灾地理. 地理研究, 2014, 33(8):1569-1578.]
|
| [23] |
[ 王晓伟, 龚胜生. 清代江南地区疫灾地理研究. 中国历史地理论丛, 2015, 30(3):18-30.]
|
| [24] |
[ 龚胜生, 石国宁, 李孜沫. 民国时期江南地区疫灾地理研究. 历史地理研究, 2020, 40(1):18-30,153-154.]
|
| [25] |
[ 赖文, 李永宸. 岭南瘟疫史. 广州: 广东人民出版社, 2004: 61-248.]
|
| [26] |
[ 龚胜生, 李孜沫. 清代山西地区疫灾时空分布研究. 干旱区资源与环境, 2017, 31(6):1-7.]
|
| [27] |
[ 龚胜生. 湖北瘟疫灾害的时空分布规律: 770BC—AD1911. 华中师范大学学报(自然科学版), 2003, 37(3):411-417.]
|
| [28] |
[ 李孜沫. 地理环境对清代疫灾空间分异格局的影响. 干旱区资源与环境, 2020, 34(10):78-86.]
|
| [29] |
[ 李孜沫. 清代(1816—1911年)霍乱流行的时空特征、危险模拟与边界探测. 地理研究, 2020, 39(1):129-139.]
|
| [30] |
[ 张志斌. 古代疫病流行的诸种因素初探. 中华医史杂志, 1990, 20(1):28-35.]
|
| [31] |
[ 张萍. 脆弱环境下的瘟疫传播与环境扰动: 以1932年陕西霍乱灾害为例. 历史研究, 2017(2):73-87, 191.]
|
| [32] |
[ 李永宸, 赖文. 霍乱在岭南的流行及其与旱灾的关系(1820—1911年). 中国中医基础医学杂志, 2000, 6(3):52-56.]
|
| [33] |
|
| [34] |
[ 仇立慧, 黄春长. 黄河中游古代瘟疫与环境变化的关系及其对城市发展影响研究. 干旱区资源与环境, 2007, 21(4):37-41.]
|
| [35] |
|
| [36] |
[ 周琼, 李梅. 清代云南生态环境与瘴气区域变迁初探. 史学集刊, 2008(3):78-85.]
|
| [37] |
[ 余新忠. 咸同之际江南瘟疫探略: 兼论战争与瘟疫之关系. 近代史研究, 2002(5):79-99.]
|
| [38] |
[ 张善文, 雷英杰, 冯有前. MATLAB在时间序列分析中的应用. 西安: 西安电子科技大学出版社, 2007: 4.]
|
| [39] |
[ 龚胜生, 陈云. 中国人口疏密区分界线的历史变迁及数学拟合与地理意义. 地理学报, 2019, 74(10):2147-2162.]
|
| [40] |
|
| [41] |
|
| [42] |
[ 陈发虎, 董广辉, 陈建徽, 等. 亚洲中部干旱区气候变化与丝路文明变迁研究: 进展与问题. 地球科学进展, 2019, 34(6):561-572.]
|
| [43] |
[ 余柏康, 李峯. 欧洲历史上气候变化与鼠疫的关系. 中国科学: 地球科学, 2018, 48(2):165-180.]
|
| [44] |
|
| [45] |
|
| [46] |
|
| [47] |
|
| [48] |
Compilation Team of Chinese military history. Chronology of wars in ancient China. Beijing: Chinese People's Liberation Army Publishing House, 2003.
[中国军事史编写组. 中国历代战争年表. 北京: 解放军出版社, 2003.]
|
| [49] |
|
| [50] |
[ 龚胜生. 2000年来中国瘴病分布变迁的初步研究. 地理学报, 1993, 48(4):304-316.]
|
| [51] |
[ 李峯, 章典, 裴卿, 等. 中国近五百年旱涝灾害与内乱关系的定量分析. 中国科学: 地球科学, 2017, 47(12):1395-1405.]
|
| [52] |
|
| [53] |
[ 徐焰. 战争与瘟疫. 北京: 人民出版社, 2014: 1, 85.]
|
| [54] |
[ 龚胜生, 李孜沫, 刘国旭, 等. 中国历史时期兵疫灾害的时空变迁研究. 灾害学, 2019, 34(1):78-86.]
|
/
| 〈 |
|
〉 |
