
Research of China-EU trade based on the Northern Sea Route
Received date: 2020-06-23
Request revised date: 2021-03-23
Online published: 2021-07-25
Supported by
China Postdoctoral Science Foundation(2018M641458)
Chinese Academy of Sciences(ZDRW-ZS-2017-4)
National Natural Science Foundation of China(42071151)
National Natural Science Foundation of China(41701118)
Copyright
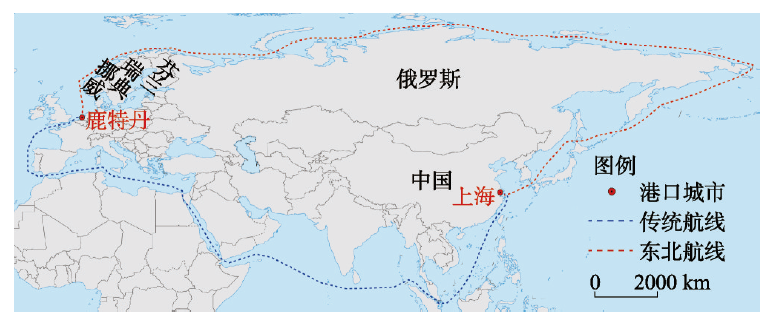
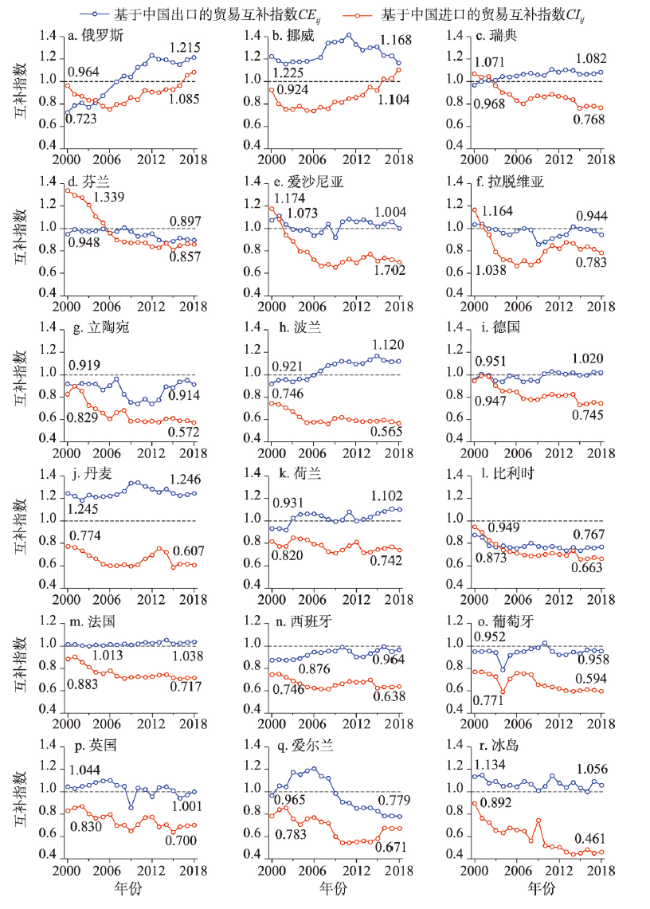
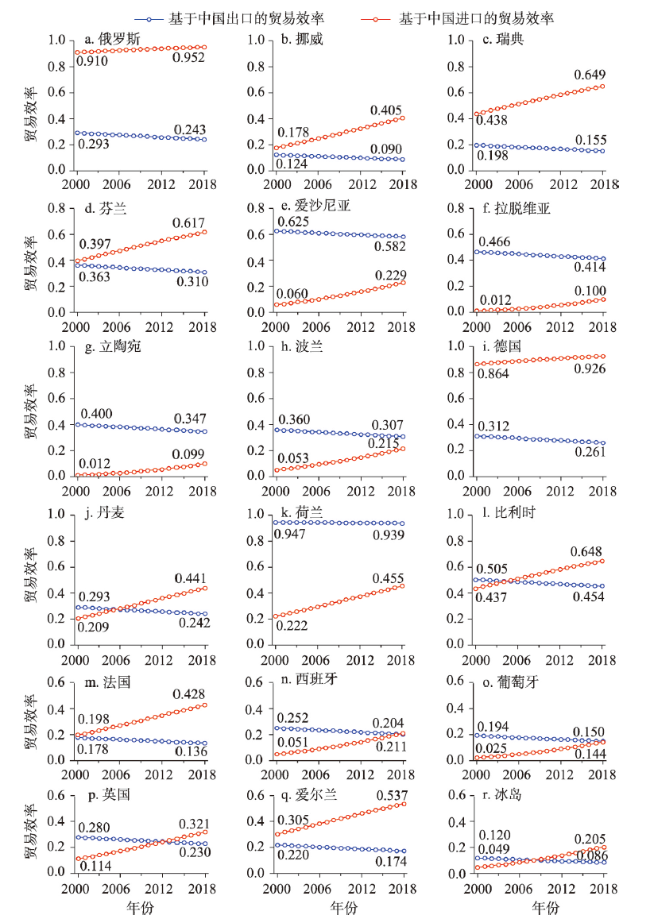
The Northern Sea Route has been increasingly attracting the attention from countries all over the world due to its important strategic status. By calculating the economic costs of shipping among China-EU ports through the Northern Sea Route and China-EU trade complementarity index, this study builds a trade gravity model in stochastic frontier based on the Northern Sea Route, and explores the influencing factors of China’s import from and export trade to 18 European countries, which shows the following: (1) Taking the traffic volume of 12000 TEU for comparison, the economic costs of shipping along the Northern Sea Route are 1.58-2.80 times those based on the traditional passage among China-EU ports. (2) In 2000-2018, the proportion of the China-EU trade complementarity index based on China’s export (CEij) greater than 1 accounted for 52.63%, and countries with higher CEij included Iceland, Denmark, Norway, France, Sweden and the United Kingdom, while the proportion of the China-EU trade complementarity index based on China’s import (CIij) less than 1 accounted for 94.74%, with a declining trend. So, China’s import and export with 18 European countries were less complementary. (3) In terms of trade scale of China’s export to 18 European countries, the economic scale of trade partner countries has a greater influence than that of China, and the economic costs of shipping are significantly negatively correlated with the trade scale based on the Northern Sea Route; in terms of trade scale of China’s import from 18 European countries, the economic scale of trade partner countries has a greater influence than that of China, and the positive correlation relationship between the economic costs of shipping and the trade scale has lower confidence based on the Northern Sea Route. (4) If the Northern Sea Route was taken for the China-EU trade, the trade efficiencies of China’s export to 18 European countries and import from them declined and rose to varying degrees, respectively, which means that the trade efficiency of China’s import and export had large room for improvement. This study can strengthen the research foundation of relationship between China-EU shipping and trade based on the Northern Sea Route, and provide references for China on participating in the construction of the Northern Sea Route, exploiting and utilizing Arctic resources, and reinforcing the trade between China and Europe.
WANG Wulin , WANG Chengjin . Research of China-EU trade based on the Northern Sea Route[J]. Acta Geographica Sinica, 2021 , 76(5) : 1105 -1121 . DOI: 10.11821/dlxb202105005
TSij = YS+SS+HS+DSij+RSij+OSij+PSij+MSij+XSij+WSij+ISij
TNij = BN+HN+DNij+RNij+ONij+PNij+MNij+XNij+WNij+INij
表1 基于东北航线与传统航线的12000 TEU集装箱船船航运经济成本参数估值Tab. 1 Estimation of economic cost parameters of 12000 TEU container shipping through Northern Sea Route and the Traditional Passage |
| 航线 | YS | SS | HN或 HS | BN | DNij或 DSij | RNij或 RSij | ONij或 OSij | PNij或 PSij | MNij或 MSij | XNij或 XSij | WNij或 WSij | INij或 ISij |
|---|---|---|---|---|---|---|---|---|---|---|---|---|
| 东北航线 | - | - | 72 | 180 | 9.6 | 7.2 | 0.0441 | 1.44 | 0.72 | 0.1728 | 0.09 | 0.1749 |
| 传统航线 | 50 | 7 | 28 | - | 1.11 | 4 | 0.0259 | 0.463 | 0.2315 | 0.0756 | 0.0556 | 0.1944 |
表2 变量描述性统计Tab. 2 Descriptive statistics of variables |
| 变量类型 | 变量 | 观测数量 | 最小值 | 最大值 | 均值 | 标准差 |
|---|---|---|---|---|---|---|
| 因变量 | lnEXijt | 342 | 16.68 | 25.08 | 22.02 | 1.89 |
| lnIMijt | 342 | 14.84 | 25.39 | 21.19 | 2.30 | |
| 影响因素 | lnGDPit | 342 | 27.82 | 30.24 | 29.15 | 0.82 |
| lnGDPjt | 342 | 22.46 | 29.00 | 26.38 | 1.68 | |
| lnECij | 342 | 9.05 | 9.21 | 9.12 | 0.04 | |
| lnCEijt | 342 | -0.32 | 0.35 | 0.0028 | 0.13 | |
| lnCIijt | 342 | -0.82 | 0.29 | -0.2981 | 0.18 |
表3 12000 TEU运输量下东北航线较传统航线的航运经济成本增量(万美元)Tab. 3 Economic cost increment of shipping along the Northern Sea Route compared with the Traditional Passage under the traffic volume of 12000 TEU (10000 dollars) |
| 港口 | 大连 | 秦皇岛 | 天津 | 青岛 | 连云港 | 上海 | 宁波 | 厦门 | 深圳 | 广州 | 防城港 | 海口 | 平均 |
|---|---|---|---|---|---|---|---|---|---|---|---|---|---|
| 摩尔曼斯克 | 394.21 | 400.88 | 402.77 | 397.15 | 400.65 | 404.66 | 409.13 | 456.25 | 491.11 | 492.18 | 523.87 | 513.37 | 440.52 |
| 圣彼得堡 | 620.63 | 630.71 | 632.60 | 626.98 | 630.48 | 634.49 | 638.96 | 686.08 | 720.94 | 722.01 | 753.70 | 743.20 | 670.07 |
| 奥斯陆 | 598.18 | 604.85 | 606.74 | 601.11 | 604.62 | 608.63 | 613.10 | 660.22 | 695.08 | 696.15 | 727.84 | 717.34 | 644.49 |
| 哥德堡 | 598.69 | 602.51 | 604.40 | 598.78 | 602.28 | 606.30 | 610.76 | 657.88 | 692.74 | 693.82 | 725.50 | 715.00 | 642.39 |
| 赫尔辛基 | 636.81 | 642.71 | 644.60 | 638.98 | 642.48 | 646.49 | 650.96 | 698.08 | 732.94 | 734.01 | 765.70 | 755.20 | 682.41 |
| 塔林 | 635.82 | 642.35 | 644.24 | 638.61 | 642.12 | 646.13 | 650.60 | 697.72 | 732.58 | 733.65 | 765.34 | 754.84 | 682.00 |
| 里加 | 625.85 | 632.37 | 634.27 | 628.64 | 632.15 | 636.16 | 640.63 | 687.75 | 722.60 | 723.68 | 755.37 | 744.87 | 672.03 |
| 克莱佩达 | 618.96 | 625.49 | 627.38 | 621.75 | 625.26 | 629.27 | 633.74 | 680.86 | 715.72 | 716.79 | 748.48 | 737.98 | 665.14 |
| 格但斯克 | 619.68 | 626.35 | 628.24 | 622.62 | 626.12 | 630.13 | 634.60 | 681.72 | 716.58 | 717.65 | 749.34 | 738.84 | 665.99 |
| 汉堡 | 612.51 | 619.18 | 621.07 | 615.44 | 618.95 | 622.96 | 627.43 | 674.55 | 709.41 | 710.48 | 742.17 | 731.67 | 658.82 |
| 哥本哈根 | 607.56 | 614.08 | 615.97 | 610.35 | 613.85 | 617.87 | 622.33 | 669.45 | 704.31 | 705.38 | 737.07 | 726.57 | 653.73 |
| 鹿特丹 | 625.16 | 631.83 | 633.72 | 628.09 | 631.60 | 635.61 | 640.08 | 687.20 | 722.06 | 723.13 | 754.82 | 744.32 | 671.47 |
| 安特卫普 | 631.62 | 638.29 | 640.18 | 634.56 | 638.06 | 642.07 | 646.54 | 693.66 | 728.52 | 729.59 | 761.28 | 750.78 | 677.93 |
| 勒阿弗尔 | 648.21 | 654.88 | 656.77 | 651.15 | 654.65 | 658.66 | 663.13 | 710.25 | 745.11 | 746.18 | 777.87 | 767.37 | 694.52 |
| 毕尔巴鄂 | 701.53 | 708.05 | 709.94 | 704.32 | 707.82 | 711.84 | 716.30 | 763.42 | 798.28 | 799.36 | 831.05 | 820.54 | 747.70 |
| 里斯本 | 745.64 | 752.31 | 754.21 | 748.58 | 752.09 | 756.10 | 760.56 | 807.68 | 842.54 | 843.62 | 875.31 | 864.80 | 791.95 |
| 南安普顿 | 650.13 | 656.66 | 658.55 | 652.93 | 656.43 | 660.44 | 664.91 | 712.03 | 746.89 | 747.96 | 779.65 | 769.15 | 696.31 |
| 都柏林 | 641.15 | 647.67 | 649.57 | 643.94 | 647.45 | 651.46 | 655.93 | 703.05 | 737.90 | 738.98 | 770.67 | 760.17 | 687.33 |
| 雷克雅未克 | 605.66 | 612.33 | 614.23 | 608.60 | 612.11 | 616.12 | 620.59 | 667.71 | 702.56 | 703.64 | 735.33 | 724.83 | 651.98 |
| 平均 | 622.00 | 628.60 | 630.50 | 624.87 | 628.38 | 632.39 | 636.86 | 683.98 | 718.83 | 719.91 | 751.60 | 741.10 | —— |
表4 面板数据单位根检验结果Tab. 4 Result of unit root test of panel data |
| 变量 | LLC检验统计量 | P值 | 结论 |
|---|---|---|---|
| lnEXijt | -8.9735 | 0.000 | 平稳 |
| lnIMijt | -7.4359 | 0.000 | 平稳 |
| lnGDPit | -6.4064 | 0.000 | 平稳 |
| lnGDPjt | -7.8754 | 0.000 | 平稳 |
| lnCEijt | -3.5680 | 0.000 | 平稳 |
| lnCIijt | -4.8176 | 0.000 | 平稳 |
| lnEXijt、lnGDPit、lnGDPjt、lnCEijt协整检验 | T统计量: -4.9656 | 0.000 | 存在协整关系 |
| lnIMXijt、lnGDPit、lnGDPjt、lnCIijt协整检验 | T统计量: -4.6801 | 0.000 | 存在协整关系 |
表5 基于东北航线的面板随机前沿贸易引力模型回归结果Tab. 5 Regression result of trade gravity model in stochastic frontier based on the Northern Sea Route |
| 因变量lnEXijt | 系数 | 因变量lnIMijt | 系数 |
|---|---|---|---|
| 常数项 | -7.15*** | 常数项 | -63.38* |
| lnGDPit | 0.62* | lnGDPit | 0.28*** |
| lnGDPjt | 0.98*** | lnGDPjt | 0.87*** |
| lnECij | -1.90* | lnECij | 7.72 |
| lnCEij | -0.06 | lnCIij | 0.03 |
| Bij | 0.31 | Bij | 0.39* |
| FTAij | -0.16 | FTAij | -0.48** |
| μ | 0.00 | μ | 0.00 |
| η | -0.01 | η | 0.04 |
| γ | 0.91 | γ | 0.95 |
| 0.69 | 1.61 | ||
| 0.07 | 0.08 | ||
| 对数似然值 | -110.50 | 对数似然值 | -95.93 |
| LR | 399.37 | LR | 467.69 |
注:***、**和*分别表示在1%、5%和10%水平上显著。 |
| [1] |
|
| [2] |
|
| [3] |
|
| [4] |
|
| [5] |
|
| [6] |
|
| [7] |
|
| [8] |
|
| [9] |
[ 寿建敏, 冯远. 基于航运成本的北极东北航道集装箱运输潜力研究. 极地研究, 2015,27(1):65-73.]
|
| [10] |
|
| [11] |
|
| [12] |
[ 李振福, 尤雪, 王文雅, 等. 北极东北航线集装箱运输的经济性分析. 集美大学学报(哲学社会科学版), 2015,18(1):34-40.]
|
| [13] |
|
| [14] |
[ 徐骅, 尹志芳. 北冰洋东北航道夏季集装箱航运经济性研究. 世界地理研究, 2013,22(3):10-17.]
|
| [15] |
[ 张爱锋, 宋艳平. 基于海冰影响的北极航线经济性研究. 大连海事大学学报, 2014,40(2):43-46.]
|
| [16] |
[ 钱作勤, 徐立, 严新平, 等. 北极东北航道通航策略及经济性研究. 极地研究, 2015,27(2):203-211.]
|
| [17] |
|
| [18] |
[ 张侠, 屠景芳, 郭培清, 等. 北极航线的海运经济潜力评估及其对我国经济发展的战略意义. 中国软科学, 2009(Suppl.2):86-93.]
|
| [19] |
|
| [20] |
|
| [21] |
|
| [22] |
|
| [23] |
|
| [24] |
|
| [25] |
|
| [26] |
|
| [27] |
|
| [28] |
|
| [29] |
|
| [30] |
|
| [31] |
|
| [32] |
|
| [33] |
|
| [34] |
|
| [35] |
[ 贺书锋, 平瑛, 张伟华. 北极航道对中国贸易潜力的影响: 基于随机前沿引力模型的实证研究. 国际贸易问题, 2013(8):3-12.]
|
| [36] |
[ 李振福, 闫倩倩, 刘翠莲. 北极航线经济腹地范围和等级划分研究. 世界地理研究, 2016,25(5):22-28.]
|
| [37] |
|
| [38] |
[ 李振福, 孙建平. 北极航线地缘政治的规范博弈机制分析. 世界地理研究, 2011,20(1):56-62.]
|
| [39] |
[ 杨剑. 域外因素的嵌入与北极治理机制. 社会科学, 2014(1):4-13.]
|
| [40] |
[ 刘卫东, 宋周莺, 刘志高, 等. “一带一路”建设研究进展. 地理学报, 2018,73(4):620-636.]
|
| [41] |
[ 李振福, 彭琰. “通权论”与“冰上丝绸之路”建设研究. 东北师大学报(哲学社会科学版), 2019(4):23-32.]
|
| [42] |
|
| [43] |
|
| [44] |
[ 蔡敬伟. 全球超大型集装箱船市场形势及发展趋势. 世界海运, 2018,41(1):5-11.]
|
| [45] |
|
| [46] |
|
| [47] |
|
| [48] |
|
| [49] |
[ 尤雪. 北极东北航线集装箱运输经济性的仿真研究[D]. 大连: 大连海事大学, 2015.]
|
| [50] |
[ 陈羽. 高燃油成本对集装箱船油耗管理的影响. 集装箱化, 2008,19(12):19-22.]
|
| [51] |
[ 于津平. 中国与东亚主要国家和地区间的比较优势与贸易互补性. 世界经济, 2003,26(5):33-40, 80.]
|
| [52] |
|
| [53] |
|
| [54] |
|
| [55] |
[ 蔡宏波. 我国自由贸易区的贸易流量效应:基于面板数据的引力模型分析. 国际贸易问题, 2010(1):25-31.]
|
| [56] |
|
| [57] |
|
| [58] |
[ 叶滨鸿, 程杨, 王利, 等. 北极地区地缘关系研究综述. 地理科学进展, 2019,38(4):489-505.]
|
| [59] |
[ 戴长雷, 张晓红, 于淼, 等. 大连至北冰洋季克西港陆河联运路线的可行性研究. 地理学报, 2019,74(6):1224-1235.]
|
/
| 〈 |
|
〉 |
