
Connectivity characteristics for city networks in China based on innovative enterprises
Received date: 2019-10-16
Request revised date: 2020-09-24
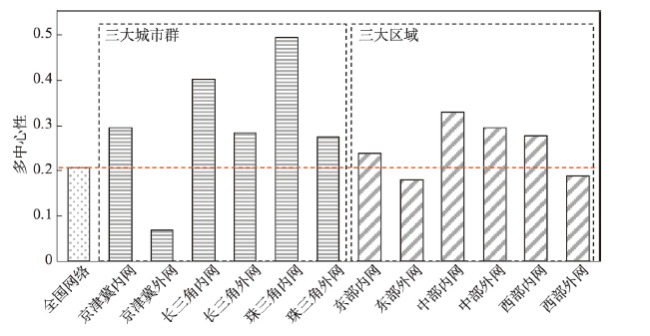
Online published: 2021-06-25
Supported by
National Natural Science Foundation of China(41971209)
National Natural Science Foundation of China(41571151)
Copyright
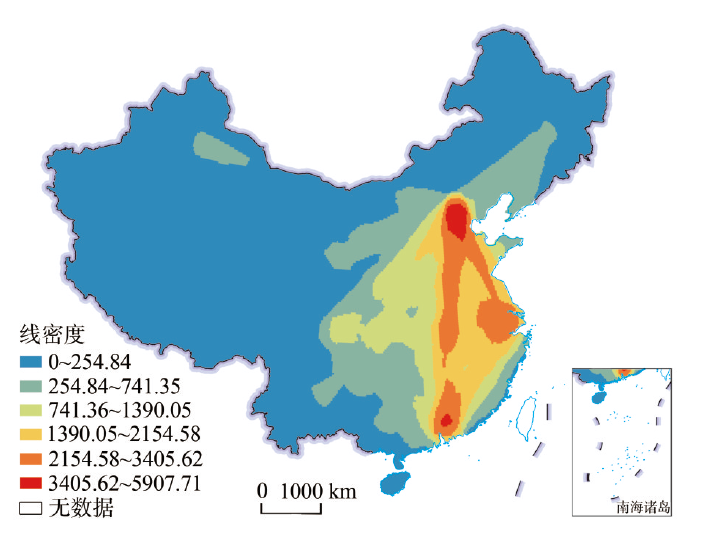
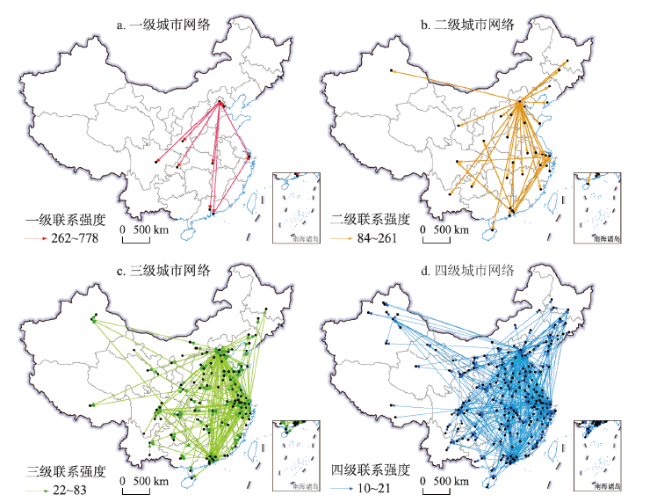
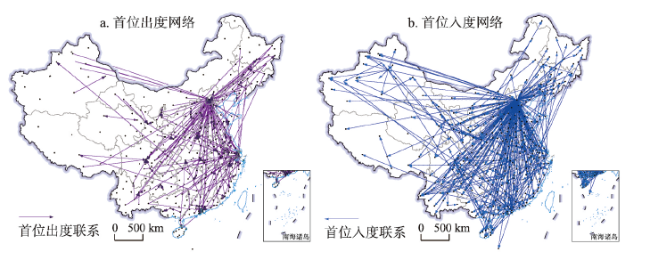
Improving the connectivity of multi-sector enterprises at a cross-regional level can enhance knowledge and technology transfer and stimulate innovation and synergies among cities. Therefore, the study of city networks, which comprise a large number of multi-sector enterprises, can provide an important knowledge base for innovation and development at the regional and national levels. Based on an evaluation of innovative enterprises in China by authoritative institutions, data were collected on 1778 multi-sector enterprises, which included details on the headquarters, the branches (a total of 30,625) and the locations. A city-based network for the country was established, using the data for the multi-sector linkages and a model for the headquarters-branches, to explore the network connectivity characteristics via social network analysis, the GIS method and the spatial interactive model. The results showed that (1) although the network covered 353 cities across China, the spatial distribution of the network was extremely uneven. For instance, a diamond-shaped connectivity pattern emerged gradually as the network hierarchy decreased. The Beijing-Tianjin-Hebei region, the Yangtze River Delta and the Pearl River Delta were found to be the three key hubs of the network. (2) The intercity linkages between innovative enterprise sectors (innovative enterprise flows), had a clear administrative center and a provincial boundary effect. Moreover, the innovative enterprises were strongly attracted to the municipalities and provincial capitals. Beijing was at the heart of the network, followed by Shanghai and Shenzhen. (3) Differences existed in regional connectivity. There was a striking difference between the eastern region and the central-western region. The former had a high connectivity with respect to both the internal and the external networks, while the latter had lower connectivity for the internal network but a higher connectivity at the external level. At the same time, although the network structures for all the three eastern megalopolises showed strong cohesion, their connectivity characteristics were quite different. (4) The input and output of innovative enterprise flows were to varying degrees influenced by the indicator attributes for each city, and these in turn were related to the administrative hierarchy, the economic strength and the innovative environment of the region, as well as proximity indicators, which were related to geographical, technological and institutional factors. Foreign capital was not conducive to innovative enterprise flows and to the formation of innovative intercity company-based networks in China.
HUANG Xiaodong , MA Haitao , MIAO Changhong . Connectivity characteristics for city networks in China based on innovative enterprises[J]. Acta Geographica Sinica, 2021 , 76(4) : 835 -852 . DOI: 10.11821/dlxb202104005
表1 创新企业来源名单及其选取办法Tab. 1 List of innovative enterprises and selection criteria |
| 名单 | 评选单位 | 批次及数量 | 评选标准 |
|---|---|---|---|
| 创新型企业试点 | 中国科技部、国资委、总工会 | 2006—2012年5批,共计676家企业 | 技术创新、品牌创新、体制机制创新、经营管理创新、理念和文化创新 |
| 国家技术创新示范企业 | 中国工信部、财政部 | 2011—2017年7批,共计495家企业 | 创新机制、技术与人才、产出与效益 |
| 中国企业创新能力1000强 | 中国人民大学等 | 2017年1000家企业 | 创新投入、创新成果、创新价值扩散、创新网络宣传以及创新市场收益 |
| 中国大陆创新企业百强 | Clarivate Analytic | 2016、2017年两批,每批次100家 | 企业发明总量、专利授权率、全球化和影响力 |
| 2017 Global Innovation 1000 | Strategy | 2017年中国大陆企业113家 | 全球研发支出最高的1000家上市公司 |
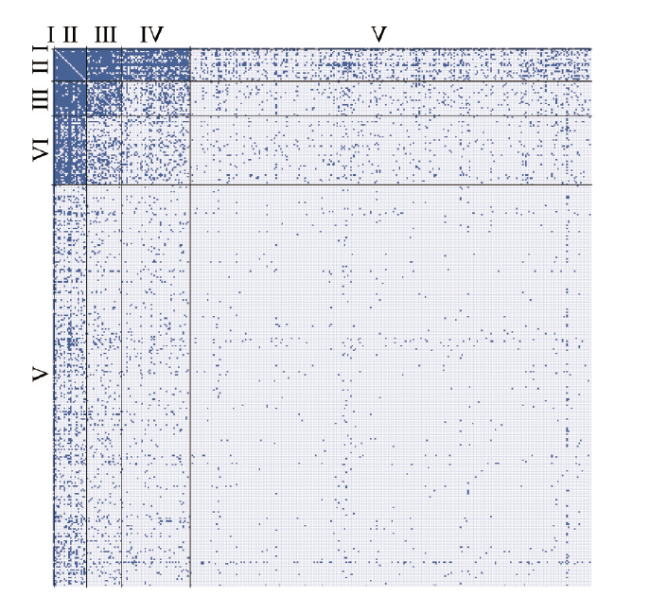
图2 基于创新企业的中国城市网络关联矩阵注:城市间存在联系则相应单元格被填充为蓝色。 Fig. 2 The connectivity matrixes for a city network in China based on innovative enterprises |
表2 基于创新企业的中国城市网络路径长度Tab. 2 The path lengths of a city-based network in China based on innovative enterprises |
| 路径长度 | 路径数量(条) | 占比(%) | 累积占比(%) |
|---|---|---|---|
| 1 | 9110 | 7.33 | 7.33 |
| 2 | 100132 | 80.58 | 87.91 |
| 3 | 14798 | 11.91 | 99.82 |
| 4 | 216 | 0.17 | 100 |
注:路径长度衡量两个节点城市之间最短路径的距离,研究未考虑节点间的联系权重。 |
表3 重要城市的节点属性(Top5)Tab. 3 The top five node attributes for the cities in the network |
| 序列 | 出度 | 入度 | 中心度 | 辐射城市数 | 吸引城市数 |
|---|---|---|---|---|---|
| 1 | 北京(9926) | 北京(3788) | 北京(13714) | 北京(297) | 北京(139) |
| 2 | 深圳(3423) | 上海(3493) | 上海(6271) | 深圳(168) | 上海(138) |
| 3 | 上海(2778) | 深圳(1901) | 深圳(5324) | 上海(146) | 成都(95) |
| 4 | 杭州(1737) | 成都(1457) | 杭州(2822) | 南京(137) | 深圳(93) |
| 5 | 广州(1221) | 天津(1303) | 广州(2493) | 成都(134) | 广州(84) |
表4 中国三大区域和三大城市群内外部创新联系特征Tab. 4 The characteristics for internal and external connectivity for the three regions and the three megalopolises in China |
| 区域内部创新企业流 | 区域外部创新企业流 | ||||||
|---|---|---|---|---|---|---|---|
| 总强度 | 平均强度 | 首位占比 | 总强度 | 平均强度 | 首位占比 | ||
| 东部区域 | 20586 | 179.01 | 0.19 | 17563 | 73.79 | 0.33 | |
| 中部区域 | 2208 | 17.25 | 0.11 | 11939 | 53.30 | 0.14 | |
| 西部区域 | 1762 | 16.59 | 0.18 | 8554 | 35.06 | 0.21 | |
| 京津冀城市群 | 1556 | 119.69 | 0.43 | 15063 | 44.30 | 0.82 | |
| 长三角城市群 | 3393 | 130.50 | 0.23 | 13180 | 40.31 | 0.36 | |
| 珠三角城市群 | 1016 | 112.89 | 0.33 | 8686 | 25.25 | 0.53 | |
注:首位占比指首位城市的创新企业流占区域内(外)部创新企业流总量的比例。 |
表5 基于创新企业的中国城市网络影响因素的估计结果Tab. 5 Regression results for the factors influencing city networks in China based on innovative enterprises |
| 模型1 | 模型2 | 模型3 | 模型4 | 模型5 | |
|---|---|---|---|---|---|
| 流发出城市属性指标 | |||||
| UAD | 0.096** | 0.162*** | 0.243*** | ||
| (0.04) | (0.04) | (0.031) | |||
| PGDP | 0.275*** | 0.311*** | 0.386*** | ||
| (0.044) | (0.043) | (0.034) | |||
| PCH | 0.028*** | 0.022*** | 0.026*** | ||
| (0.008) | (0.008) | (0.006) | |||
| STE | 0.062*** | 0.061*** | 0.065*** | ||
| (0.004) | (0.004) | (0.003) | |||
| TIZ | 0.055* | 0.069** | 0.009 | ||
| (0.029) | (0.029) | (0.024) | |||
| AUFDI | -0.022*** | -0.024*** | -0.025*** | ||
| (0.005) | (0.005) | (0.004) | |||
| 流接收城市属性指标 | |||||
| UAD | 0.135*** | 0.180*** | 0.284*** | ||
| (0.041) | (-0.042) | (0.031) | |||
| PGDP | 0.402*** | 0.409*** | 0.379*** | ||
| (0.048) | (0.048) | (0.036) | |||
| PCH | 0.074*** | 0.086*** | 0.055*** | ||
| (0.009) | (0.009) | (0.006) | |||
| STE | 0.019*** | 0.013*** | 0.036*** | ||
| (0.005) | (-0.004) | (0.003) | |||
| TIZ | 0.144*** | 0.192*** | 0.113*** | ||
| (0.032) | (-0.032) | (0.025) | |||
| AUFDI | 0.013** | 0.014** | -0.006 | ||
| (0.006) | (0.006) | (0.005) | |||
| 城市关系邻近性指标 | |||||
| GEOPRO | -0.161*** | -0.129*** | -0.114*** | ||
| (0.025) | (0.026) | (0.02) | |||
| TECPRO | 0.312** | -1.617*** | 1.241*** | ||
| (0.135) | (0.137) | (0.121) | |||
| INSTPRO | 0.380*** | 0.366*** | 0.811*** | ||
| (0.047) | (0.049) | (0.037) | |||
| 常数项 | 1.174*** | 0.875*** | 1.051*** | 2.377*** | -1.450*** |
| (0.058) | (0.131) | (0.055) | (0.131) | (0.127) | |
| lnα | -0.162*** | -0.202*** | -0.072*** | -0.110*** | -0.888*** |
| (0.021) | (0.021) | (0.02) | (0.02) | (0.026) | |
| 样本量 | 5124 | 5124 | 5124 | 5124 | 5124 |
注:显著性水平*:P < 0.10,**:P < 0.05,***:P < 0.01;括号内数字为标准误。 |
| [1] |
[ 马海涛. 知识流动空间的城市关系建构与创新网络模拟. 地理学报, 2020,75(4):708-721.]
|
| [2] |
|
| [3] |
|
| [4] |
[ 马学广, 李贵才. 全球流动空间中的当代世界城市网络理论研究. 经济地理, 2011,31(10):1630-1637.]
|
| [5] |
|
| [6] |
|
| [7] |
|
| [8] |
[ 李仙德. 基于上市公司网络的长三角城市网络空间结构研究. 地理科学进展, 2014,33(12):1587-1600.]
|
| [9] |
[ 武前波, 宁越敏. 中国城市空间网络分析: 基于电子信息企业生产网络视角. 地理研究, 2012,31(2):207-219.]
|
| [10] |
[ 尹俊, 甄峰, 王春慧. 基于金融企业布局的中国城市网络格局研究. 经济地理, 2011,31(5):754-759.]
|
| [11] |
[ 王成金. 中国物流企业的空间组织网络. 地理学报, 2008,63(2):135-146.]
|
| [12] |
[ 马海涛. 基于知识流动的中国城市网络研究进展与展望. 经济地理, 2016,36(11):207-213, 223.]
|
| [13] |
|
| [14] |
|
| [15] |
Central Committee of the Communist Party of China and the State Council. Outline of National Innovation-driven Development Strategy. Beijing: Xinhua News Agency, 2016.
[ 中共中央国务院. 国家创新驱动发展战略纲要. 北京: 新华社, 2016.]
|
| [16] |
[ 姚士谋, 朱英明, 陈振光. 中国城市群. 合肥: 中国科学技术大学出版社, 2001.]
|
| [17] |
[ 许倞, 张志宏, 等. 2017全国技术市场统计年度报告. 北京: 兵器工业出版社, 2017: 4.]
|
| [18] |
[ 王士君, 冯章献, 刘大平, 等. 中心地理论创新与发展的基本视角和框架. 地理科学进展, 2012,31(10):1256-1263.]
|
| [19] |
[ 杨永春, 冷炳荣, 谭一洺, 等. 世界城市网络研究理论与方法及其对城市体系研究的启示. 地理研究, 2011,30(6):1009-1020.]
|
| [20] |
|
| [21] |
|
| [22] |
[ 金彪, 颜丽玲, 沙晋明, 等. 中国省域信息流、资金流强度的空间差异: 以2015年京东手机交易为例. 地理科学, 2018,38(2):223-232]
|
| [23] |
[ 甄峰, 王波, 陈映雪. 基于网络社会空间的中国城市网络特征: 以新浪微博为例. 地理学报, 2012,67(8):1031-1043.]
|
| [24] |
|
| [25] |
|
| [26] |
[ 刘承良, 管明明, 段德忠. 中国城际技术转移网络的空间格局及影响因素. 地理学报, 2018,73(8):1462-1477.]
|
| [27] |
[ 吕拉昌, 梁政骥, 黄茹. 中国主要城市间的创新联系研究. 地理科学, 2015,35(1):30-37.]
|
| [28] |
[ 马海涛, 黄晓东, 李迎成. 粤港澳大湾区城市群知识多中心的演化过程与机理. 地理学报, 2018,73(12):2297-2314.]
|
| [29] |
|
| [30] |
|
| [31] |
[ 李丹丹, 汪涛, 魏也华, 等. 中国城市尺度科学知识网络与技术知识网络结构的时空复杂性. 地理研究, 2015,34(3):525-540.]
|
| [32] |
[ 段德忠, 杜德斌, 谌颖, 等. 中国城市创新技术转移格局与影响因素. 地理学报, 2018,73(4):738-754.]
|
| [33] |
[ 刘承良, 牛彩澄. 东北三省城际技术转移网络的空间演化及影响因素. 地理学报, 2019,74(10):2092-2107.]
|
| [34] |
|
| [35] |
|
| [36] |
[ 马海涛. 基于人才流动的城市网络关系构建. 地理研究, 2017,36(1):161-170.]
|
| [37] |
[ 段德忠, 杜德斌, 桂钦昌, 等. 中国企业家成长路径的地理学研究. 人文地理, 2018,33(4):102-112.]
|
| [38] |
[ 吕拉昌, 李勇. 基于城市创新职能的中国创新城市空间体系. 地理学报, 2010,65(2):177-190.]
|
| [39] |
[ 段德忠, 杜德斌, 谌颖, 等. 中国城市创新网络的时空复杂性及生长机制研究. 地理科学, 2018,38(11):1759-1768.]
|
| [40] |
[ 刘承良, 管明明. 基于专利转移网络视角的长三角城市群城际技术流动的时空演化. 地理研究, 2018,37(5):981-994.]
|
| [41] |
|
| [42] |
[ 苗长虹, 魏也华, 吕拉昌. 新经济地理学. 北京: 科学出版社, 2011: 236-238.]
|
| [43] |
|
| [44] |
|
| [45] |
|
| [46] |
|
| [47] |
|
| [48] |
[ 苗长虹. 马歇尔产业区理论的复兴及其理论意义. 地域研究与开发, 2004,23(1):1-6.]
|
| [49] |
[ 杨伟聪, 王长建. 全球生产网络、价值捕捉轨迹与区域发展. 热带地理, 2017,37(5):628.]
|
| [50] |
|
| [51] |
|
| [52] |
|
| [53] |
|
| [54] |
[ 苗长虹, 魏也华. 技术学习与创新: 经济地理学的视角. 人文地理, 2007,22(5):1-9, 18.]
|
| [55] |
[ 马海涛, 方创琳, 吴康. 链接与动力: 核心节点助推国家创新网络演进. 中国软科学, 2012,27(2):88-95.]
|
| [56] |
[ 王丰龙, 曾刚, 叶琴, 等. 基于创新合作联系的城市网络格局分析: 以长江经济带为例. 长江流域资源与环境, 2017,26(6):797-805.]
|
| [57] |
|
| [58] |
|
| [59] |
[ 杨佩, 杨永春, 卢红. 中国西北地区城市网络体系分析: 基于民营企业布局. 地域研究与开发, 2014,33(5):55-58.]
|
| [60] |
[ 赵新正, 李秋平, 芮旸, 等. 基于财富500强中国企业网络的城市网络空间联系特征. 地理学报, 2019,74(4):694-709.]
|
| [61] |
[ 杜德斌. 培育最有爆发力最有影响力的创新企业. 文汇报, 2018-12-26.]
|
| [62] |
[ 崔万田, 马喆, 于畅. 知识型企业的区位选择. 经济管理, 2013,35(2):52-62.]
|
| [63] |
|
| [64] |
[ 魏后凯. 中国城市行政等级与规模增长. 城市与环境研究, 2014,1(1):4-17.]
|
| [65] |
[ 夏丽丽. 科技进步对区位论发展影响之初探. 经济地理, 1999,19(5):6-9.]
|
| [66] |
[ 王缉慈. 知识创新和区域创新环境. 经济地理, 1999,19(1):12-16.]
|
| [67] |
[ 朱平芳, 徐伟民. 政府的科技激励政策对大中型工业企业R&D投入及其专利产出的影响: 上海市的实证研究. 经济研究, 2003,38(6):45-53, 94.]
|
| [68] |
[ 刘颖, 郭琪, 贺灿飞. 城市区位条件与企业区位动态研究. 地理研究, 2016,35(7):1301-1313.]
|
| [69] |
|
| [70] |
|
| [71] |
[ 夏丽娟, 谢富纪, 王海花. 制度邻近、技术邻近与产学协同创新绩效: 基于产学联合专利数据的研究. 科学学研究, 2017,35(5):782-791.]
|
| [72] |
[ 刘承良, 桂钦昌, 段德忠, 等. 全球科研论文合作网络的结构异质性及其邻近性机理. 地理学报, 2017,72(4):737-752.]
|
| [73] |
[ 刘秉镰, 朱俊丰. 区域市场分割的影响因素及其空间邻近效应分析: 基于1989—2014年中国省际面板数据. 经济地理, 2018,38(10):36-45.]
|
| [74] |
|
| [75] |
|
/
| 〈 |
|
〉 |
