
Characteristics of ventilation channel and ventilation efficiency assessment: A case study of main built-up area in Guangzhou
Received date: 2019-11-26
Request revised date: 2020-10-22
Online published: 2021-05-25
Supported by
National Natural Science Foundation of China(41771001)
Guangzhou Industry-University-Research Collaborative Innovation Major ProjectNo(201704020136)
Copyright
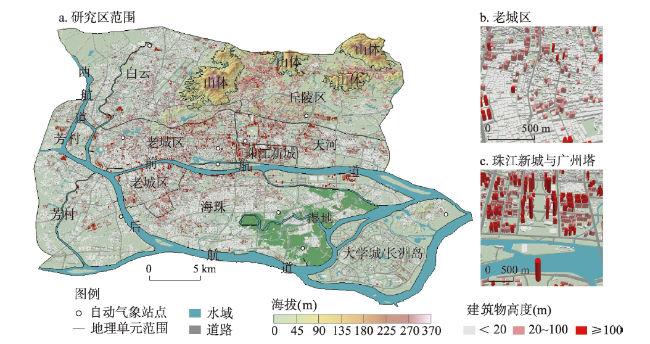
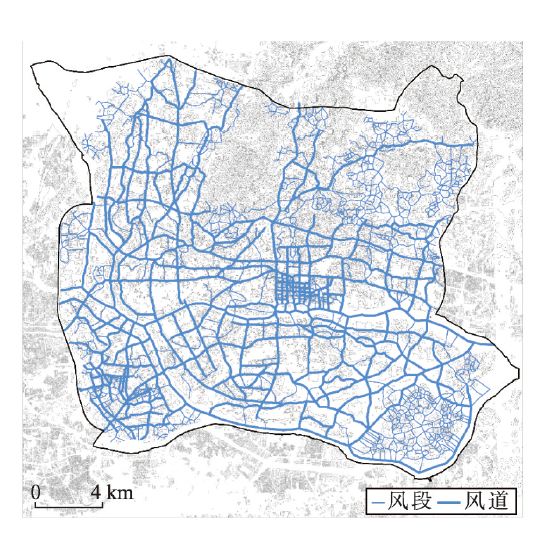
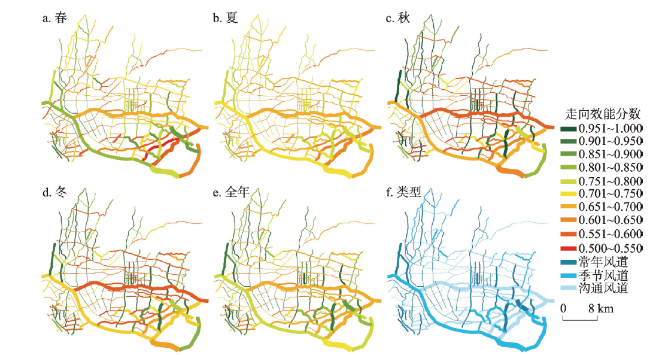
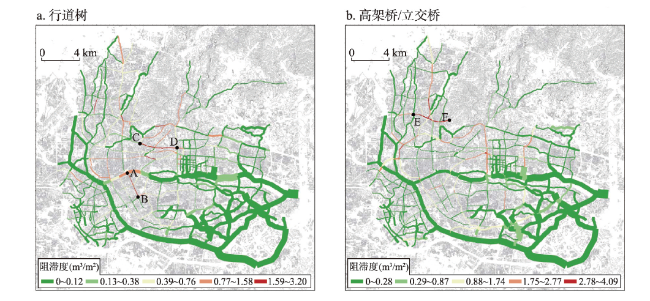
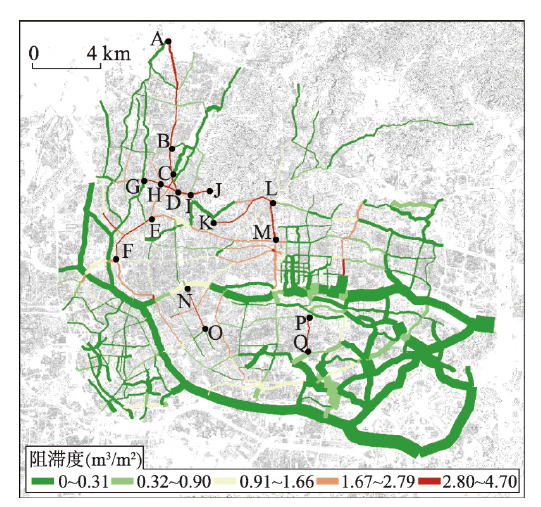
This paper attempts to explore the feature and efficiency of the ventilation channel in the main built-up area of Guangzhou, one of the four first-tier cities in China. Building groups were simplified and then the centerlines of open areas were sketched out, and finally proceeded to the identification of the ventilation channels. Data of hourly wind direction and velocity of the year 2016 were used. Indicators based on GIS for measuring the physical and thermal properties of ventilation channels were proposed, which facilitate the analysis of the characteristics of the ventilation channels and the evaluation of their efficiency. The results show that: (1) There are 2451 potential ventilation channel centerlines at a 40-m resolution, when composed, 142 meet the standard of ventilation channel. The total ventilation area reached 96.49 km2, accounting for 21.59% of the study area. (2) Centering around the Pearl River New Town, the potential ventilation network in the study area presents dense-sparse-dense concentric characteristics, and inclines slightly to the northeast direction. The ventilation area of the old town is relatively limited. The width-height ratio of ventilation channel in the Pearl River New Town is 6.54 while in wetland area it reaches the highest to 74.43, illustrating that width-height ratio among different districts varies greatly. Green lands and waters cover more than 90% of the ventilation area of the peripheral region outside the main urban area. (3) According to the similarity in spatial distribution of direction efficiency, there exist three patterns: spring, summer and autumn/winter. In line with the seasonal variation rule of efficiency, three categories of ventilation channel are classified: perennial paths, seasonal paths, and communication paths. The result of seasonal ventilation efficiency assessment shows that autumn outperforms winter which outperforms spring which outperforms summer (autumn > winter > spring > summer). (4) Regarding retardation degree, the contribution of overpassing bridge is two times and ever higher than that of street trees. The maximum retardation in the study area is 4.70 m3/m2 and most of the high retardation values concentrated west of the study area, especially around Sanyuanli where high-density overpassing bridges exist.

CHEN Xiang , SUN Wu , SHEN Zitong , ZHU Linlin , ZHANG Jiabin , XU Wei . Characteristics of ventilation channel and ventilation efficiency assessment: A case study of main built-up area in Guangzhou[J]. Acta Geographica Sinica, 2021 , 76(3) : 694 -712 . DOI: 10.11821/dlxb202103014
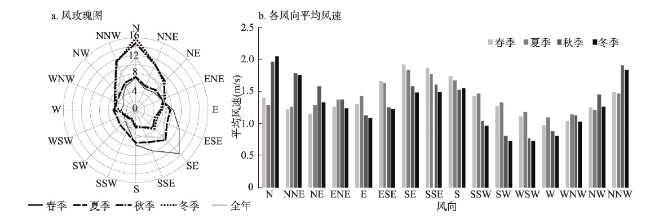
表1 各类风向的频率(%)与平均风速(m/s)Tab. 1 Frequencies and average speed (%) of various wind directions (m/s) |
| 季节 | N-S | NNE-SSW | NE-SW | ENE-WSW | E-W | ESE-WNW | SE-NW | SSE-NNW | |||||||||||||||
|---|---|---|---|---|---|---|---|---|---|---|---|---|---|---|---|---|---|---|---|---|---|---|---|
| 频率 | 风速 | 频率 | 风速 | 频率 | 风速 | 频率 | 风速 | 频率 | 风速 | 频率 | 风速 | 频率 | 风速 | 频率 | 风速 | ||||||||
| 春季 | 15 | 1.59 | 9 | 1.32 | 9 | 1.20 | 9 | 1.46 | 11 | 1.22 | 13 | 1.05 | 18 | 1.77 | 16 | 1.74 | |||||||
| 夏季 | 15 | 1.49 | 11 | 1.37 | 11 | 1.31 | 11 | 1.44 | 12 | 1.31 | 12 | 1.15 | 14 | 1.63 | 14 | 1.65 | |||||||
| 秋季 | 19 | 1.88 | 13 | 1.66 | 11 | 1.42 | 9 | 1.23 | 10 | 1.02 | 9 | 1.13 | 12 | 1.52 | 16 | 1.84 | |||||||
| 冬季 | 19 | 1.96 | 13 | 1.63 | 11 | 1.21 | 10 | 1.15 | 10 | 0.98 | 10 | 1.04 | 12 | 1.38 | 15 | 1.75 | |||||||
表2 风段的物理属Tab. 2 Physical properties of ventilation path segments |
| 区域 | 风段数量 (条) | 风段长度 | 风段宽度 | 宽高比 | 通风面积 | |||||||
|---|---|---|---|---|---|---|---|---|---|---|---|---|
| 均值(m) | 均方差 | 均值(m) | 均方差 | 均值 | 均方差 | 总和(km2) | 占比(%) | |||||
| 老城区 | 154 | 705.40 | 483.99 | 105.66 | 84.13 | 8.44 | 11.77 | 8.96 | 19.36 | |||
| 珠江新城 | 190 | 219.97 | 118.88 | 128.51 | 117.19 | 6.54 | 13.04 | 4.43 | 72.26 | |||
| 芳村 | 366 | 366.85 | 242.29 | 147.98 | 96.09 | 18.12 | 18.06 | 15.19 | 37.76 | |||
| 天河 | 147 | 517.40 | 346.21 | 159.13 | 132.68 | 14.04 | 23.20 | 8.94 | 32.93 | |||
| 海珠 | 113 | 784.43 | 487.24 | 185.32 | 149.63 | 23.83 | 37.52 | 22.30 | 23.67 | |||
| 白云 | 318 | 583.24 | 464.27 | 169.04 | 128.91 | 21.32 | 24.55 | 12.67 | 22.74 | |||
| 珠江 | 125 | 639.22 | 514.81 | 627.03 | 276.45 | 70.94 | 68.52 | 44.10 | 114.79 | |||
| 湿地 | 62 | 948.72 | 506.26 | 471.13 | 252.60 | 74.43 | 61.78 | 18.98 | 145.66 | |||
| 丘陵区域 | 578 | 361.77 | 264.35 | 202.77 | 136.85 | 22.77 | 25.61 | 29.37 | 42.31 | |||
| 大学城/长洲岛 | 398 | 303.07 | 235.09 | 207.11 | 149.30 | 19.73 | 25.11 | 19.03 | 73.06 | |||
| 全区 | 2451 | 449.15 | 381.95 | 205.45 | 184.20 | 23.07 | 33.97 | 183.97 | 44.16 | |||
表3 不同走向风道与风段数量的空间分布(条)Tab. 3 Spatial distribution of ventilation channel: directions and sections (line) |
| 走向 | N-S | NNE-SSW | NE-SW | ENE-WSW | E-W | ESE-WNW | SE-NW | SSE-NNW | |||||||||||||||
|---|---|---|---|---|---|---|---|---|---|---|---|---|---|---|---|---|---|---|---|---|---|---|---|
| 风道 | 风段 | 风道 | 风段 | 风道 | 风段 | 风道 | 风段 | 风道 | 风段 | 风道 | 风段 | 风道 | 风段 | 风道 | 风段 | ||||||||
| 老城区 | 2 | 18 | 0 | 13 | 3 | 21 | 2 | 25 | 3 | 30 | 1 | 15 | 1 | 6 | 4 | 26 | |||||||
| 珠江新城 | 7 | 66 | 0 | 15 | 1 | 6 | 0 | 14 | 5 | 54 | 0 | 15 | 0 | 7 | 0 | 13 | |||||||
| 芳村 | 4 | 49 | 2 | 27 | 5 | 42 | 3 | 63 | 5 | 60 | 1 | 29 | 3 | 45 | 3 | 51 | |||||||
| 天河 | 3 | 40 | 4 | 20 | 0 | 3 | 0 | 4 | 1 | 35 | 2 | 28 | 0 | 6 | 1 | 11 | |||||||
| 海珠 | 5 | 19 | 1 | 19 | 1 | 9 | 1 | 6 | 6 | 31 | 4 | 10 | 0 | 8 | 1 | 11 | |||||||
| 白云 | 7 | 52 | 4 | 48 | 3 | 39 | 0 | 25 | 3 | 49 | 1 | 39 | 3 | 23 | 1 | 33 | |||||||
| 珠江 | 2 | 11 | 1 | 10 | 1 | 15 | 0 | 21 | 2 | 22 | 2 | 26 | 1 | 10 | 0 | 10 | |||||||
| 湿地 | 2 | 6 | 3 | 12 | 0 | 4 | 3 | 9 | 2 | 4 | 2 | 14 | 3 | 5 | 0 | 8 | |||||||
| 东北丘陵区域 | 1 | 86 | 2 | 76 | 1 | 60 | 1 | 73 | 2 | 98 | 1 | 70 | 1 | 57 | 0 | 58 | |||||||
| 大学城/长洲岛 | 0 | 48 | 0 | 49 | 0 | 46 | 0 | 45 | 0 | 48 | 1 | 50 | 1 | 64 | 0 | 48 | |||||||
| 全区 | 33 | 395 | 17 | 289 | 15 | 245 | 10 | 285 | 29 | 431 | 15 | 296 | 13 | 241 | 10 | 269 | |||||||
注:风道若横跨多个区域,则以其面积占比最大的区域作为所属区域。 |
表4 风段的热力属性Tab. 4 Thermal properties of ventilation channel sections |
| 区域 | 绿地 | 水域 | 道路 | |||||
|---|---|---|---|---|---|---|---|---|
| 面积(km2) | 占比(%) | 面积(km2) | 占比(%) | 面积(km2) | 占比(%) | |||
| 老城区 | 3.55 | 39.62 | 0.88 | 9.82 | 3.01 | 33.59 | ||
| 珠江新城 | 1.91 | 43.12 | 0.75 | 16.93 | 1.11 | 25.06 | ||
| 芳村 | 5.94 | 39.10 | 1.74 | 11.45 | 2.51 | 16.52 | ||
| 天河 | 3.74 | 41.83 | 0.59 | 6.60 | 2.59 | 28.97 | ||
| 海珠 | 5.53 | 24.80 | 2.01 | 9.01 | 2.92 | 13.09 | ||
| 白云 | 7.70 | 60.77 | 1.59 | 12.55 | 4.27 | 33.70 | ||
| 珠江 | 9.72 | 22.04 | 31.06 | 70.43 | 1.99 | 4.51 | ||
| 湿地 | 15.14 | 79.77 | 3.53 | 18.60 | 2.04 | 10.75 | ||
| 东北丘陵 | 24.80 | 84.44 | 1.31 | 4.46 | 4.23 | 14.40 | ||
| 大学城/长洲岛 | 15.42 | 81.03 | 4.01 | 21.07 | 2.58 | 13.56 | ||
| 全区 | 93.45 | 50.80 | 47.47 | 25.80 | 27.25 | 14.81 | ||
表5 各走向效能平均得分Tab. 5 Average value of direction efficiency |
| 走向类型 | N-S | NNE-SSW | NE-SW | ENE-WSW | E-W | ESE-WNW | SE-NW | SSE-NNW |
|---|---|---|---|---|---|---|---|---|
| 春季 | 0.81 | 0.69 | 0.58 | 0.57 | 0.66 | 0.76 | 0.88 | 0.90 |
| 夏季 | 0.77 | 0.72 | 0.65 | 0.64 | 0.66 | 0.71 | 0.77 | 0.80 |
| 秋季 | 0.97 | 0.88 | 0.71 | 0.59 | 0.56 | 0.62 | 0.79 | 0.93 |
| 冬季 | 0.94 | 0.85 | 0.69 | 0.57 | 0.53 | 0.59 | 0.75 | 0.89 |
| 全年 | 0.87 | 0.78 | 0.66 | 0.59 | 0.60 | 0.67 | 0.80 | 0.88 |
| [1] |
|
| [2] |
|
| [3] |
[ 李磊, 吴迪. 基于数值模拟的城市街区详细规划通风评估研究. 环境科学学报, 2012,32(4):946-953.]
|
| [4] |
|
| [5] |
|
| [6] |
[
|
| [7] |
[ 任超, 吴恩融. 城市环境气候图. 北京:中国建筑工业出版社, 2012.]
|
| [8] |
[ 武汉大学, 香港大学, 武汉市国土资源和规划信息中心. 武汉市城市风道规划管理研究, 2013.]
|
| [9] |
[ 成田健一, 清田诚良. 克利玛城市环境地图集. 东京: 行政学会印刷所, 2000.]
|
| [10] |
|
| [11] |
|
| [12] |
|
| [13] |
|
| [14] |
[ 匡晓明, 陈君, 孙常峰. 基于计算机模拟的城市街区尺度绿带通风效能评价. 城市发展研究, 2015,22(5):91-95, 157.]
|
| [15] |
|
| [16] |
|
| [17] |
|
| [18] |
|
| [19] |
|
| [20] |
[ 刘姝宇, 沈济黄. 基于局地环流的城市通风道规划方法: 以德国斯图加特市为例. 浙江大学学报(工学版), 2010,44(10):1985-1991.]
|
| [21] |
[ 刘乐乐, 赵小锋, 赵颜创, 等. 基于城市环境气候图的宁波大气环境分析与调控对策. 生态学报, 2017,37:606-618.]
|
| [22] |
[ 刘勇洪, 张硕, 程鹏飞, 等. 面向城市规划的热环境与风环境评估研究与应用: 以济南中心城为例. 生态环境学报, 2017,26(11):1892-1903.]
|
| [23] |
|
| [24] |
|
| [25] |
|
| [26] |
|
| [27] |
|
| [28] |
[ 詹庆明, 欧阳婉璐, 金志诚, 等. 基于RS和GIS的城市通风潜力研究与规划指引. 规划师, 2015,11(5):95-99.]
|
| [29] |
|
| [30] |
[ 齐宏纲, 孙武, 李庆祥, 等. 指数律参数选取对指数和廓线精度的影响. 华南师范大学学报(自然科学版), 2017,49(5):72-78.]
|
| [31] |
Ministry of Land, Infrastructure, Transport and Tourism, National Institute for Land and Infrastructure Management. Urban Development Guidance for Urban Heat Island Countermeasures Utilizing "Kaze-no-Michi". Technical Note of National Institute for Land and Infrastructure Management, 2013.
[ 日本国土技术行政综合研究所. 利用“风道”减轻热岛强度的城市规划指南. 2013.]
|
| [32] |
|
| [33] |
|
| [34] |
[ 张凯, 赵天良, 曹乐, 等. 街道峡谷对近地层风场影响的观测和模拟分析. 环境科学学报, 2019,39(12):4187-4195.]
|
| [35] |
[ 孙武, 王义明, 王越雷, 等. 珠江三角洲地面风场的特征及其城市群风道的构建. 生态学报, 2012,32(18):5630-5636.]
|
| [36] |
|
| [37] |
|
| [38] |
[ 冯章献, 王士君, 金珊合, 等. 长春市城市形态及风环境对地表温度的影响. 地理学报, 2019,74(5):902-911.]
|
| [39] |
|
| [40] |
[ 孙武, 李国, 李涛, 等. 民国时期广州市建成区主体建筑立体形态的恢复及其特征. 热带地理, 2013,33(5):518-526.]
|
| [41] |
[ 苏建忠, 魏清泉, 郭恒亮. 广州市的蔓延机理与调控. 地理学报, 2005,60(4):626-636.]
|
| [42] |
[ 刘沛, 龚斌, 蔡志磊, 等. 基于CFD模拟分析的湿热地区中小城市广义通风道的研究: 以广东省南雄市为例. 青岛: 中国城市规划学会会议, 2013.]
|
| [43] |
[ 吴珍珍, 鄢涛, 付祥钊. 基于CFD模拟技术的深圳市城市风环境分析. 工程质量, 2009,27(11):49-53.]
|
| [44] |
[ 曹昊, 周文杰, 官燕玲. 西安市城区通风环境数值建模及分析. 中国科技论文, 2015,10(13):1573-1577.]
|
| [45] |
[ 黄铁兰, 刘慧忠, 柯锦灿. 基于Landsat TM卫星数据的广州城市热岛效应特征研究. 北京测绘, 2018,32(8):891-896.]
|
| [46] |
[ 张正栋, 蒙金华. 基于城市热岛效应的城市降温通道规划研究: 以广州市为例. 资源科学, 2013,35(6):1261-1267.]
|
| [47] |
[ 周红妹, 周成虎, 葛伟强, 等. 基于遥感和GIS的城市热场分布规律研究. 地理学报, 2001,56(2):189-197.]
|
| [48] |
[ 王伟武, 黎菲楠, 王頔, 等. 基于通风潜力及风特征量化分析的城市风道构建. 浙江大学学报(工学版), 2019,53(3):470-481.]
|
| [49] |
|
| [50] |
|
| [51] |
|
| [52] |
|
| [53] |
|
| [54] |
|
| [55] |
[ 施成熙, 卡毓明, 朱晓原, 等. 确定水面蒸发模型. 地理科学, 1984,4(1):1-11.]
|
| [56] |
|
| [57] |
|
| [58] |
|
| [59] |
|
| [60] |
|
| [61] |
|
| [62] |
|
| [63] |
|
| [64] |
|
| [65] |
|
| [66] |
|
| [67] |
|
| [68] |
[ 洪星园, 傅云飞, 冼桃, 等. 热带海表风速与海表温度日变化关系分析. 气候与环境研究, 2014,19(4):470-481.]
|
| [69] |
[ 陈康林, 龚建周, 陈晓越. 广州市热岛强度的空间格局及其分异特征. 生态学杂志, 2017,36(3):792-799.]
|
| [70] |
|
| [71] |
|
| [72] |
|
| [73] |
[ 张棋斐, 文雅, 吴志峰, 等. 高密度建成区湖泊水体的热缓释效应及其季相差异: 以广州市中心城区为例. 生态环境学报, 2018,27(7):1323-1334.]
|
| [74] |
|
| [75] |
|
| [76] |
|
| [77] |
|
/
| 〈 |
|
〉 |