
An assessment of the effectiveness of China's nature reserves for mitigating anthropogenic pressures based on propensity score matching
Received date: 2020-03-22
Request revised date: 2020-12-20
Online published: 2021-05-25
Supported by
National Natural Science Foundation of China(41531176)
National Key R&D Program of China(2017YFA0604402)
Copyright
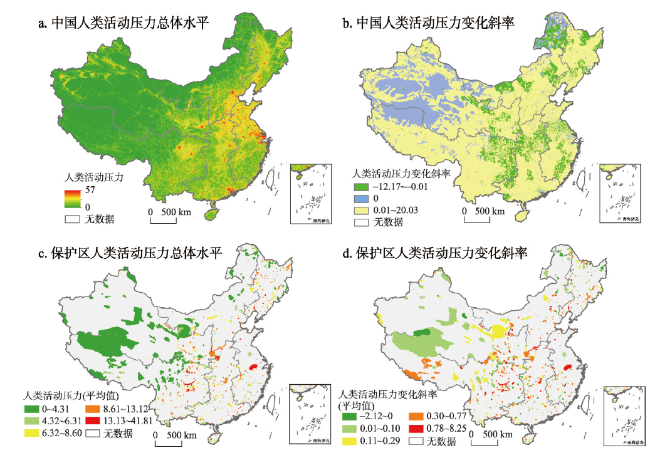
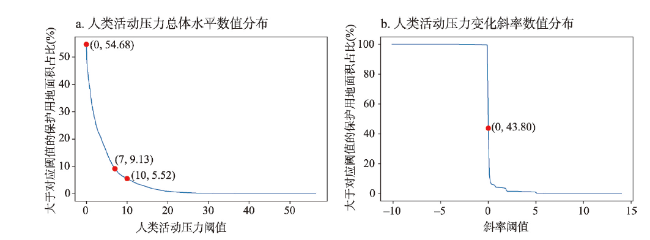
Assessing the effectiveness of nature reserves for mitigating anthropogenic pressures is essential for effective nature protection. The current research at national scale in China only compares anthropogenic pressures inside nature reserves to that outside, but fails to solve the problem of sample selection deviation, which will lead to bias in assessment results. In order to solve this problem, we adopted propensity score matching method to improve the accuracy of the results in the evaluation of nature reserves. The multi-source data were firstly integrated to build Anthropogenic Pressure Index in 2013, 2015, and 2017, then the propensity score matching method was applied to match the random points inside and outside the nature reserves, to make sure that the observed variables of the two comparison groups were as similar as possible. Finally, we used relative effectiveness indicator and panel model to assess the effectiveness of 680 nature reserves in China for mitigating anthropogenic pressures from 2013 to 2017 at different levels. The results show that: (1) From 2013 to 2017, 86.72% of China's nature reserves experienced a positive trend of anthropogenic pressures, which accounted for 43.80% of the total area. (2) Some 69.85% of nature reserves performed well in mitigating anthropogenic pressures. Except for marine coasts, wild plants, and wild animals, the types of nature reserves were under sound protection, and the higher the level of nature reserves, the better the protection effectiveness. (3) From 2013 to 2017, anthropogenic pressures were mitigated by 22.90% by the construction of China's nature reserves, and there were regional differences regarding the degree of mitigation. The results can provide a more scientific reference for future monitoring, assessment and management of nature reserves in China.

ZHANG Han , LI Xia , SHI Hong , LIU Xiaojuan . An assessment of the effectiveness of China's nature reserves for mitigating anthropogenic pressures based on propensity score matching[J]. Acta Geographica Sinica, 2021 , 76(3) : 680 -693 . DOI: 10.11821/dlxb202103013
表1 6种单一压力得分分配的规则Tab. 1 The rules of assigning scores to six individual pressures |
| 压力 | 得分 | 描述 |
|---|---|---|
| 城市建设用地 | 0, 10 | 所有城市建设用地像元得分均为10 |
| 人口密度 | 0~10 | 人口密度大于1000人/km2的像元得分为10,其余按公式计算 |
| 电力设施 | 0~10 | 对夜间灯光数据进行分位数分级 |
| 农田 | 0, 7 | 所有农田像元得分均为7 |
| 公路 | 0~10 | 公路像元得分为10,公路外部按距离以指数递减,一直到距离公路15 km处 |
| 铁路 | 0, 10 | 所有铁路像元得分为10 |
表2 中国自然保护区缓解人类活动压力评估所使用的数据集Tab. 2 The datasets used in the assessment of the effectiveness of China's nature reserves for mitigating anthropogenic pressures |
| 数据 | 数据属性 | 年份 | 数据来源 |
|---|---|---|---|
| 中国自然保护区矢量边界 | 矢量数据 | - | http://www.papc.cn/ |
| 中国自然保护区名录 | 统计数据 | 2017 | http://www.mee.gov.cn/ |
| VIIRS DNB夜间灯光影像 | 遥感影像 | 2013、2015、2017 | https://www.ngdc.noaa.gov/eog/viirs/ download_dnb_composites.html |
| 中国城市建设用地面积 | 统计数据 | 2013、2015、2017 | http://www.stats.gov.cn/ |
| 人口密度 | 栅格数据 | 2010、2015、2020 | https://sedac.ciesin.columbia.edu/data/ collection/gpw-v4/sets/browse |
| 农田 | 栅格数据 | 2013、2015、2017 | http://maps.elie.ucl.ac.be/CCI/viewer/ index.php |
| 公路、铁路 | 矢量数据 | 2014、2015、2017 | https://download.geofabrik.de/ |
| 高程 | 栅格数据 | - | http://www.fao.org/soils-portal/soil-survey/soil-maps-and-databases/harmonized-world-soil-database-v12/zh/ |
| 气温、降水 | 站点数据 | 2013、2015、2017 | https://data.nodc.noaa.gov/cgi-bin/iso?id=gov.noaa.ncdc:C00516 |
表3 倾向得分匹配的平衡性检验结果Tab. 3 Balance test results of propensity score matching |
| 变量 | 均值 | 标准偏差 (%) | 标准偏差减小 幅度(%) | t检测 | |||
|---|---|---|---|---|---|---|---|
| 实验组 | 对照组 | t统计量 | t检验相伴概率 | ||||
| lnpecp | 匹配前 | -2.5682 | -2.8677 | 37.5 | 50.42 | 0.000 | |
| 匹配后 | -2.5682 | -2.5679 | 0.2 | 99.5 | 0.22 | 0.824 | |
| lntemp | 匹配前 | 3.9294 | 3.9054 | 10.3 | 15.26 | 0.000 | |
| 匹配后 | 3.9294 | 3.935 | -2.4 | 76.9 | -2.55 | 0.011 | |
| lnslope | 匹配前 | 0.76959 | 0.23972 | 29.9 | 44.54 | 0.000 | |
| 匹配后 | 0.76959 | 0.76637 | 0.2 | 99.4 | 0.22 | 0.829 | |
| lnelev | 匹配前 | 6.7174 | 6.5833 | 9.1 | 12.84 | 0.000 | |
| 匹配后 | 6.7174 | 6.7039 | 0.9 | 89.9 | 1.07 | 0.286 | |
| lntjcq | 匹配前 | 10.496 | 10.454 | 4.3 | 5.69 | 0.000 | |
| 匹配后 | 10.496 | 10.497 | -0.0 | 99.3 | -0.03 | 0.973 | |
| lntoroad | 匹配前 | 10.805 | 10.716 | 7.5 | 10.06 | 0.000 | |
| 匹配后 | 10.805 | 10.797 | 0.7 | 91.0 | 0.76 | 0.445 | |
| lnlandcover | 匹配前 | 0.73629 | 0.73672 | -0.1 | -0.10 | 0.918 | |
| 匹配后 | 0.73629 | 0.74132 | -0.9 | -1053.9 | -1.07 | 0.284 | |
注:lnpecp代表降水,lntemp代表温度,lnslope代表坡度,lnelev代表高程,lntjcq代表到城市建设用地的距离,lntoroad代表到道路的距离,lnlandcover代表土地覆盖类型。 |
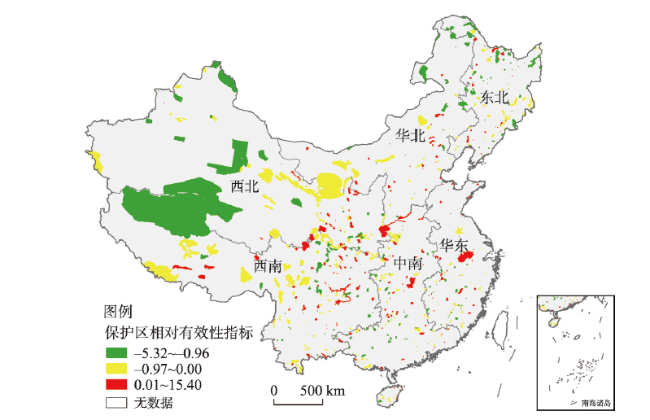
图4 2017年中国自然保护区缓解人类活动压力的相对有效性指标空间分布Fig. 4 The spatial distribution of relative effectiveness of China's nature reserves for mitigating anthropogenic pressures |
表4 2017年中国自然保护区的相对有效性按六大区统计Tab. 4 The statistics of relative effectiveness of the nature reserves in six regions of China |
| 保护区类别 | 保护区数目 | 指标为负(%) | 指标为正(%) | 相对有效性(平均值) |
|---|---|---|---|---|
| 东北 | 115 | 79.13 | 20.87 | -0.40 |
| 华北 | 66 | 68.18 | 31.82 | -0.31 |
| 华东 | 90 | 56.67 | 43.33 | 0.43 |
| 中南 | 154 | 66.23 | 33.77 | 0.06 |
| 西北 | 87 | 74.71 | 25.29 | -0.30 |
| 西南 | 158 | 72.15 | 27.85 | -0.18 |
| 全国 | 670 | 69.85 | 30.15 | -0.11 |
表5 2017年中国自然保护区的相对有效性按保护区类别统计Tab. 5 The statistics of relative effectiveness by type of nature reserves in China |
| 保护区类别 | 保护区数目 | 指标为负(%) | 指标为正(%) | 相对有效性(平均值) |
|---|---|---|---|---|
| 草原草甸 | 7 | 85.71 | 14.29 | -0.37 |
| 地质遗迹 | 21 | 71.43 | 28.57 | -0.04 |
| 古生物遗迹 | 11 | 81.82 | 18.18 | -0.02 |
| 海洋海岸 | 11 | 63.64 | 36.36 | 0.53 |
| 荒漠生态 | 16 | 81.25 | 18.75 | -0.67 |
| 内陆湿地 | 81 | 67.90 | 32.10 | -0.28 |
| 森林生态 | 304 | 70.72 | 29.28 | -0.18 |
| 野生动物 | 179 | 68.72 | 31.28 | 0.04 |
| 野生植物 | 40 | 62.50 | 37.50 | 0.19 |
表6 2017年中国自然保护区的相对有效性按保护区级别统计Tab. 6 The statistics of relative effectiveness by level of nature reserves in China |
| 保护区类别 | 保护区数目 | 指标为负(%) | 指标为正(%) | 相对有效性(平均值) |
|---|---|---|---|---|
| 国家级 | 359 | 73.54 | 26.46 | -0.29 |
| 省级 | 128 | 69.53 | 30.47 | -0.06 |
| 地级市级 | 46 | 63.04 | 36.96 | 0.06 |
| 县级 | 137 | 62.77 | 37.23 | 0.27 |
表7 基于倾向得分匹配的面板模型分析结果Tab. 7 The results of the panel model based on propensity score matching |
| 变量 | (1) | (2) | (1) | (2) | (3) | (4) | (5) | (6) |
|---|---|---|---|---|---|---|---|---|
| 全国 | 全国 | 东北 | 华北 | 西北 | 华东 | 西南 | 中南 | |
| PAS | -0.192*** | -0.229*** | -0.614*** | -0.263*** | 0.252*** | -0.613*** | -0.516*** | -0.279*** |
| (0.0138) | (0.0126) | (0.0292) | (0.0384) | (0.0389) | (0.0194) | (0.0194) | (0.0081) | |
| lnelev | -0.675*** | -0.568*** | -0.620*** | -0.697*** | -0.123*** | -1.183*** | -0.173*** | |
| (0.0034) | (0.0169) | (0.0113) | (0.0197) | (0.0063) | (0.0087) | (0.0036) | ||
| lnslope | 0.252*** | -0.0282*** | 0.175*** | 0.306*** | -0.0141*** | 0.0852*** | -0.0654*** | |
| (0.0030) | (0.0094) | (0.0084) | (0.0081) | (0.0048) | (0.0063) | (0.0025) | ||
| lnpecp | -0.0262*** | 0.00668*** | -0.0125*** | -0.00529*** | -0.00353 | -0.0204*** | -0.0346*** | |
| (0.0005) | (0.0022) | (0.0013) | (0.0011) | (0.0026) | (0.0010) | (0.0016) | ||
| lntemp | -0.0878*** | -0.0284*** | -0.0660*** | -0.128*** | -0.297*** | -0.294*** | -0.164*** | |
| (0.0009) | (0.0014) | (0.0017) | (0.0021) | (0.0083) | (0.0058) | (0.0058) | ||
| _cons | 1.383*** | 6.010*** | 5.145*** | 5.403*** | 6.030*** | 4.294*** | 11.38*** | 3.951*** |
| (0.0049) | (0.0226) | (0.0962) | (0.0771) | (0.1471) | (0.0484) | (0.0732) | (0.0332) | |
| N | 587448 | 577719 | 55552 | 95390 | 147855 | 56697 | 142963 | 79062 |
| R2 | 0.0010 | 0.1677 | 0.1204 | 0.0948 | 0.0340 | 0.1580 | 0.2458 | 0.3527 |
注:PAS为虚拟变量,lnelev为高程,lnslope为坡度,lnpecp为降水,lntemp为温度;括号内的数字表示标准误差;*代表在0.1水平下显著,**代表在0.05水平下显著,***代表在0.01水平下显著。 |
| [1] |
|
| [2] |
|
| [3] |
UNEP-WCMC, IUCN, NGS. Protected Planet Live Report 2021. 2021.
|
| [4] |
|
| [5] |
|
| [6] |
|
| [7] |
|
| [8] |
|
| [9] |
|
| [10] |
|
| [11] |
|
| [12] |
|
| [13] |
|
| [14] |
|
| [15] |
|
| [16] |
|
| [17] |
|
| [18] |
|
| [19] |
[ 赵广华, 田瑜, 唐志尧, 等. 中国国家级陆地自然保护区分布及其与人类活动和自然环境的关系. 生物多样性, 2013,21(6):658-665.]
|
| [20] |
|
| [21] |
|
| [22] |
|
| [23] |
|
| [24] |
[ 徐海根, 丁晖, 欧阳志云, 等. 中国实施2020年全球生物多样性目标的进展. 生态学报, 2016,36(13):3847-3858.]
|
| [25] |
[ 舒松, 余柏蒗, 吴健平, 等. 基于夜间灯光数据的城市建成区提取方法评价与应用. 遥感技术与应用, 2011,26(2):169-176.]
|
| [26] |
|
| [27] |
|
| [28] |
|
| [29] |
|
| [30] |
|
| [31] |
|
| [32] |
|
| [33] |
[ 陈强. 高级计量经济学及Stata应用. 2版. 北京:高等教育出版社, 2014: 542-545.]
|
| [34] |
|
| [35] |
[ 李贲, 吴利华. 开发区设立与企业成长: 异质性与机制研究. 中国工业经济, 2018(4):79-97.]
|
| [36] |
[ 何思源, 苏杨, 闵庆文. 中国国家公园的边界、分区和土地利用管理: 来自自然保护区和风景名胜区的启示. 生态学报, 2019,39(4):1318-1329.]
|
| [37] |
|
| [38] |
|
| [39] |
[ 曹巍, 黄麟, 肖桐, 等. 人类活动对中国国家级自然保护区生态系统的影响. 生态学报, 2019,39(4):1338-1350.]
|
| [40] |
|
| [41] |
|
| [42] |
|
| [43] |
|
| [44] |
|
/
| 〈 |
|
〉 |