
Population prediction and resource allocation in megacities from the optimum population perspective: A case study of Beijing, Shanghai, Guangzhou and Shenzhen
Received date: 2020-03-09
Request revised date: 2020-09-30
Online published: 2021-04-25
Supported by
National Social Science Foundation of China(19CTJ008)
"Xingliao Talent" Program(XLYC1907012)
Economic and Social Development of Liaoning Province(2020lslktyb-036)
Research Project of Education Department of Liaoning Province(LN2019Q48)
Copyright
Continuous population growth is an important factor affecting the development of megacities. Optimum population can advance the rational allocation of urban resources amidst the continuous growth. By taking the optimum population as a pointcut, this study first uses the possibility-satisfiability (P-S) model to calculate the optimum population size of Beijing, Shanghai, Guangzhou and Shenzhen in 2035, and then uses the grey back propagation neural network model to predict the resident population of all the four first-tier cities in 2035. Finally, it analyzes all the cities' allocation and planning of resources or infrastructure based on the results, and proposes optimum resource allocation to address an unexpected population growth. The results show that: (1) When the P-S degree is 0.6, the optimum population size of Beijing, Shanghai, Guangzhou and Shenzhen in 2035 is 21.5269 million, 23.0968 million, 14.9893 million and 13.5219 million, respectively, all below the red line of government planning. (2) The resident population of Beijing, Shanghai, Guangzhou and Shenzhen in 2035 will exceed the moderate population size and the red line of government planning, while the moderate population size will be lower than the red line of government planning, and the red line of government planning will be lower than that of the resident population. (3) From the perspective of optimum population, in order to cope with future population growth without affecting economic and social development and residential satisfaction, in 2035, the power generation and green areas of Beijing are expected to reach twice the current levels; power generation, green areas, and public transport vehicles of Shanghai will be 2.27, 2.22 and 2.35 times the current levels, respectively; the energy supply and power generation of Guangzhou are expected to reach three times the current levels; the energy supply, power generation, and the number of beds in health institutions of Shenzhen will be three times the current levels. This study provides a scientific basis for coordinating the sustainable development of population and urban resources in large cities.
WANG Yong , XIE Yanjing , LIU Rong , ZHANG Hao . Population prediction and resource allocation in megacities from the optimum population perspective: A case study of Beijing, Shanghai, Guangzhou and Shenzhen[J]. Acta Geographica Sinica, 2021 , 76(2) : 352 -366 . DOI: 10.11821/dlxb202102008
表1 2018年北上广深4市人口情况Tab. 1 The population data of Beijing, Shanghai, Guangzhou and Shenzhen in 2018 |
| 北京 | 上海 | 广州 | 深圳 | |
|---|---|---|---|---|
| 常住人口规模(万人) | 2154.20 | 2423.78 | 1490.44 | 1302.66 |
| 人口密度(人/km2) | 1313.00 | 3823.00 | 2005.00 | 6484.00 |
| 城镇化率(%) | 86.50 | 88.10 | 86.38 | 99.75 |
| 距2035年政府规划红线增长空间(万人) | 145.80 | 76.22 | 509.56 | 697.34 |
表2 可能—满意度指标体系Tab. 2 The index system of possibility-satisfiability model |
| 指标 类型 | 可能性指标 (总量指标) | 满意性指标 (人均指标) | 权重 | |||
|---|---|---|---|---|---|---|
| 北京 | 上海 | 广州 | 深圳 | |||
| 经济 水平 | GDP(亿元) | 人均GDP(元/人) | 0.040 | 0.050 | 0.045 | 0.043 |
| 第二产业增加值(亿元) | 第二产业人均增加值(元/人) | 0.032 | 0.035 | 0.032 | 0.044 | |
| 第三产业增加值(亿元) | 第三产业人均增加值(元/人) | 0.043 | 0.060 | 0.049 | 0.041 | |
| 社会消费品零售总额(亿元) | 社会消费品人均零售额(元/人) | 0.038 | 0.065 | 0.043 | 0.035 | |
| 进出口总额(亿美元) | 人均进出口总额(美元/人) | 0.031 | 0.035 | 0.036 | 0.055 | |
| 旅游外汇收入(万美元) | 人均旅游外汇收入(美元/人) | 0.035 | 0.026 | 0.044 | 0.026 | |
| 就业人口(万人) | 就业人口占总人口比例(%) | 0.039 | 0.058 | 0.043 | 0.042 | |
| 资源 供给 | 耕地面积(万hm2) | 人均耕地面积(m2/人) | 0.032 | 0.025 | 0.034 | 0.027 |
| 全年用水总量(亿m3) | 全年人均用水总量(m3/人) | 0.078 | 0.054 | 0.053 | 0.038 | |
| 全年用电总量(亿kw·h) | 全年人均用电总量(kw·h) | 0.036 | 0.035 | 0.040 | 0.047 | |
| 能源消费总量(万t标准煤) | 人均能源消费总量(t标准煤/人) | 0.030 | 0.032 | 0.041 | 0.050 | |
| 生态 环境 | 废水排放总量(万t) | 人均废水排放总量(t/人) | 0.024 | 0.029 | 0.042 | 0.090 |
| 生活垃圾产生量(万t) | 人均生活垃圾产生量(t/人) | 0.032 | 0.030 | 0.047 | 0.039 | |
| 公园绿地面积(hm2) | 人均公园绿地面积(m2/人) | 0.060 | 0.030 | 0.048 | 0.054 | |
| 社会 生活 | 卫生机构床位数(张) | 每万人卫生机构床位数(张/万人) | 0.050 | 0.052 | 0.045 | 0.043 |
| 道路面积(万m2) | 人均道路面积(m2/人) | 0.072 | 0.026 | 0.064 | 0.024 | |
| 房屋建筑施工面积(万m2) | 人均房屋建筑施工面积(m2/人) | 0.037 | 0.054 | 0.080 | 0.052 | |
| 公共交通营运车辆(辆) | 每万人公共交通营运车辆(辆/万人) | 0.056 | 0.059 | 0.044 | 0.072 | |
| R&D经费内部支出(亿元) | 人均R&D经费内部支出(元/人) | 0.037 | 0.062 | 0.042 | 0.040 | |
| 快递件数(万件) | 人均快递件数(件/人) | 0.073 | 0.131 | 0.049 | 0.059 | |
| 大学生在校生数(万人) | 每万人大学生在校生数(人) | 0.069 | 0.021 | 0.034 | 0.033 | |
| 中小学生在校生数(万人) | 每万人中小学生在校生数(人) | 0.055 | 0.032 | 0.044 | 0.044 | |
表3 2035年北上广深不同可能—满意度水平下适度人口规模Tab. 3 The optimum population of Beijing, Shanghai, Guangzhou and Shenzhen to different possibility-satisfiability degrees in 2035 |
| 指标权重 | 不同可能—满意度水平下的适度人口规模(万人) | |||||
|---|---|---|---|---|---|---|
| 0.6 | 0.7 | 0.8 | 0.9 | |||
| 北京 | 经济水平 | 0.258 | 2369.18 | 2074.52 | 1808.55 | 1566.81 |
| 资源供给 | 0.176 | 2115.50 | 2009.62 | 1908.72 | 1812.40 | |
| 生态环境 | 0.117 | 2132.10 | 2095.99 | 2059.79 | 2023.49 | |
| 社会生活 | 0.449 | 2048.23 | 1847.57 | 1668.80 | 1507.98 | |
| 总适度人口 | 2152.69 | 1963.71 | 1792.83 | 1637.05 | ||
| 上海 | 经济水平 | 0.329 | 2377.26 | 2043.57 | 1750.50 | 1490.66 |
| 资源供给 | 0.146 | 2241.70 | 2059.94 | 1893.69 | 1740.76 | |
| 生态环境 | 0.090 | 2389.90 | 2315.40 | 2246.14 | 2181.48 | |
| 社会生活 | 0.436 | 2259.59 | 2009.63 | 1789.42 | 1593.41 | |
| 总适度人口 | 2309.68 | 2057.67 | 1834.73 | 1635.64 | ||
| 广州 | 经济水平 | 0.292 | 1678.59 | 1449.27 | 1242.36 | 1054.47 |
| 资源供给 | 0.167 | 1347.01 | 1274.49 | 1207.58 | 1145.58 | |
| 生态环境 | 0.138 | 1613.60 | 1562.81 | 1513.06 | 1464.26 | |
| 社会生活 | 0.403 | 1392.45 | 1251.31 | 1126.23 | 1013.94 | |
| 总适度人口 | 1498.93 | 1355.97 | 1227.11 | 1109.90 | ||
| 深圳 | 经济水平 | 0.286 | 1402.11 | 1214.48 | 1046.74 | 895.45 |
| 资源供给 | 0.162 | 1326.60 | 1223.00 | 1127.00 | 1037.59 | |
| 生态环境 | 0.183 | 1314.95 | 1278.04 | 1241.31 | 1204.57 | |
| 社会生活 | 0.369 | 1343.19 | 1160.99 | 990.04 | 853.58 | |
| 总适度人口 | 1352.19 | 1207.75 | 1074.43 | 959.60 | ||
表4 北上广深灰色BP神经网络测试集输出结果(万人)Tab. 4 The output of the grey BP neural network test set (×104) |
| 北京 | 上海 | 广州 | 深圳 | ||||||||
|---|---|---|---|---|---|---|---|---|---|---|---|
| 真实值 | 预测值 | 真实值 | 预测值 | 真实值 | 预测值 | 真实值 | 预测值 | ||||
| 2014年 | 2151.60 | 2158.20 | 2425.68 | 2452.80 | |||||||
| 2015年 | 2170.50 | 2218.10 | 2415.27 | 2479.70 | |||||||
| 2016年 | 2172.90 | 2274.60 | 2419.70 | 2503.50 | 1404.35 | 1425.00 | 1190.84 | 1112.40 | |||
| 2017年 | 2170.70 | 2327.00 | 2418.33 | 2524.80 | 1449.84 | 1499.60 | 1252.83 | 1125.60 | |||
| MAPE(%) | 3.60 | 2.91 | 2.45 | 8.37 | |||||||
表5 北上广深4市人口情况汇总(万人)Tab. 5 Summary of the population data of Beijing, Shanghai, Guangzhou and Shenzhen (×104) |
| 北京 | 上海 | 广州 | 深圳 | |
|---|---|---|---|---|
| 2017年常住人口规模 | 2170.70 | 2418.33 | 1449.84 | 1252.83 |
| 2035年政府规划红线 | 2300.00 | 2500.00 | 2000.00 | 2000.00 |
| 2035年适度人口规模(ω=0.6) | 2152.69 | 2309.68 | 1498.93 | 1352.19 |
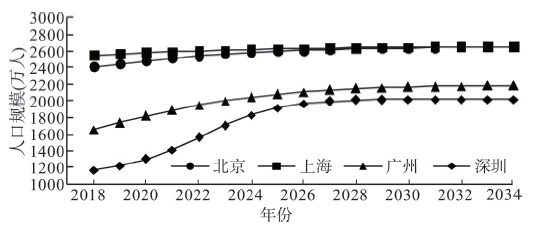
| 2035年常住人口规模 | 2659.80 | 2663.20 | 2193.70 | 2028.00 |
表6 2035年北上广深应对人口增长的资源配置结果Tab. 6 The results of resource allocation to cope with population growth of Beijing, Shanghai, Guangzhou and Shenzhen in 2035 |
| 北京 | 上海 | 广州 | 深圳 | ||
|---|---|---|---|---|---|
| 耕地面积(万hm2) | 现状值 | 21.37 | 27.94 | 9.21 | 0.37 |
| 理想值 | 38.49 | 40.94 | 16.92 | 1.00 | |
| 比值 | 1.80 | 1.47 | 1.84 | 2.71 | |
| 全年用水总量(亿m3) | 现状值 | 39.50 | 104.80 | 23.81 | 19.58 |
| 理想值 | 75.54 | 178.73 | 66.67 | 38.28 | |
| 比值 | 1.91 | 1.71 | 2.80 | 1.96 | |
| 全年用电总量(亿kw·h) | 现状值 | 1066.89 | 1526.77 | 869.59 | 884.49 |
| 理想值 | 2607.68 | 3463.91 | 3726.29 | 4544.81 | |
| 比值 | 2.44 | 2.27 | 4.29 | 5.13 | |
| 能源消费总量(万t标准煤) | 现状值 | 7132.80 | 11858.96 | 5961.97 | 4272.64 |
| 理想值 | 13640.36 | 24263.49 | 19272.48 | 14499.72 | |
| 比值 | 1.91 | 2.05 | 3.23 | 3.39 | |
| 公园绿地面积(hm2) | 现状值 | 31019 | 19805 | 26863 | 19980 |
| 理想值 | 64385 | 44036 | 62043 | 65629 | |
| 比值 | 2.08 | 2.22 | 2.31 | 3.28 | |
| 卫生机构床位数(张) | 现状值 | 120557 | 134607 | 90222 | 43868 |
| 理想值 | 246164 | 225959 | 260944 | 187698 | |
| 比值 | 2.04 | 1.68 | 2.89 | 4.28 | |
| 公共交通营运车辆(辆) | 现状值 | 30966 | 17461 | 17260 | 17430 |
| 理想值 | 61925 | 40974 | 39130 | 47694 | |
| 比值 | 2.00 | 2.35 | 2.27 | 2.74 |
| [1] |
[ 牛方曲, 孙东琪. 资源环境承载力与中国经济发展可持续性模拟. 地理学报, 2019,74(12):2604-2613.]
|
| [2] |
|
| [3] |
[ 刘畅. 适度人口理论的形成、演化及其现实意义研究[D]. 昆明: 云南大学, 2016.]
|
| [4] |
|
| [5] |
|
| [6] |
[ 刘渝琳. 我国可持续发展中的人口适度规模及预警分析. 中国人口·资源与环境, 2000,10(3):97-99.]
|
| [7] |
|
| [8] |
|
| [9] |
|
| [10] |
[ 高晓路, 陈田, 樊杰. 汶川地震灾后重建地区的人口容量分析. 地理学报, 2010,65(2):164-176.]
|
| [11] |
|
| [12] |
[ 高建昆. 适度人口问题研究综述. 管理学刊, 2010,23(1):57-61.]
|
| [13] |
|
| [14] |
|
| [15] |
[ 林晓娟, 房世峰, 杜加强, 等. 基于综合承载力的北京市适度人口研究. 地球信息科学学报, 2017,19(11):1495-1503.]
|
| [16] |
|
| [17] |
[ 刘雅轩, 张小雷, 雷军. 新疆适度人口初步研究. 干旱区资源与环境, 2007,21(5):35-40.]
|
| [18] |
|
| [19] |
[ 童玉芬, 王静文, 梁钊. 资源环境约束下的中国适度人口研究. 人口研究, 2016,40(2):3-11.]
|
| [20] |
[ 王浣尘. 采用可能度和满意度的多目标决策方法. 系统工程理论与实践, 1982,2(1):14-22.]
|
| [21] |
[ 谢天怡, 朱牧天, 徐海铭. 计划生育新政策下人口数量及结构的预测模型. 中国人口·资源与环境, 2015,25(11):122-124.]
|
| [22] |
|
| [23] |
|
| [24] |
[ 门可佩, 曾卫. 中国未来50年人口发展预测研究. 数量经济技术经济研究, 2004,21(3):12-17.]
|
| [25] |
[ 史佳, 冀巨海. 基于BP神经网络的黄河中下游人口预测研究. 科技管理研究, 2014,34(6):245-250.]
|
| [26] |
[ 徐丽丽, 李洪, 李劲. 基于灰色预测和径向基网络的人口预测研究. 计算机科学, 2019,46(6A):431-435.]
|
| [27] |
[ 李国成, 吴涛, 徐沈. 灰色人工神经网络人口总量预测模型及应用. 计算机工程与应用, 2009,45(16):215-218.]
|
/
| 〈 |
|
〉 |
