
Control index of sediment reduction dispatching in Chongqing reach after the storage level of TGR reaching 175 m
Received date: 2019-06-25
Request revised date: 2020-11-10
Online published: 2021-03-25
Supported by
National Key R&D Program of China(2016YFC0402101)
Research on the Major Sediment Problems of the Three Gorges Project(ZZ2018013001F)
Scientific Research Project of China Three Gorges Group Co. Ltd(0704166)
Copyright
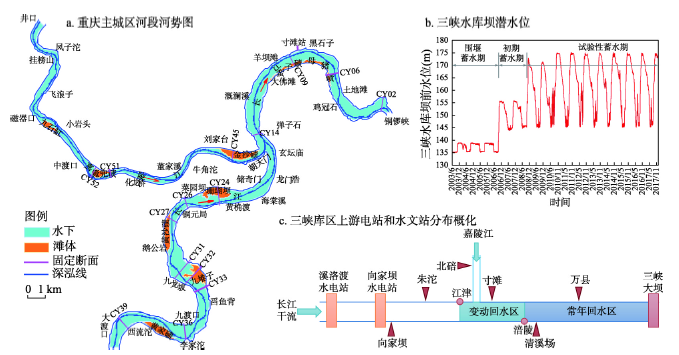
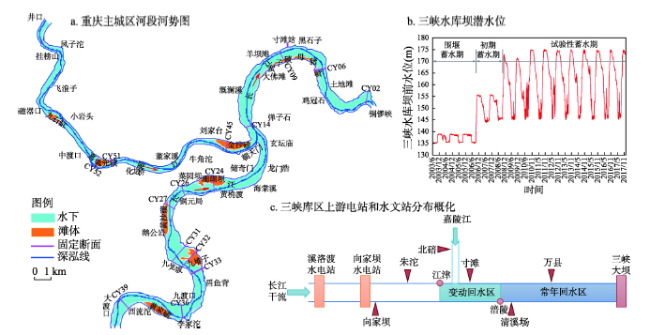
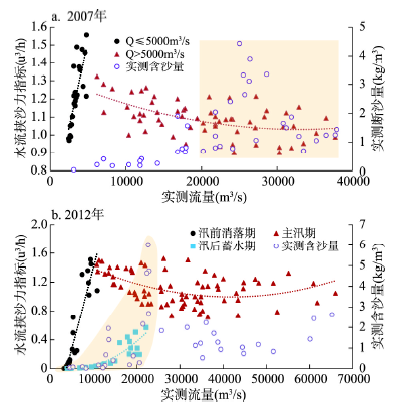
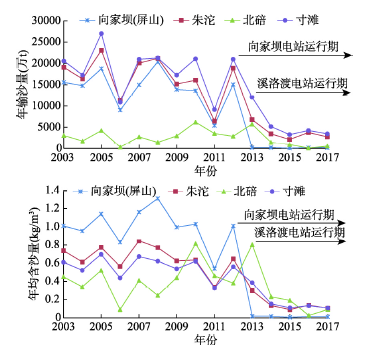
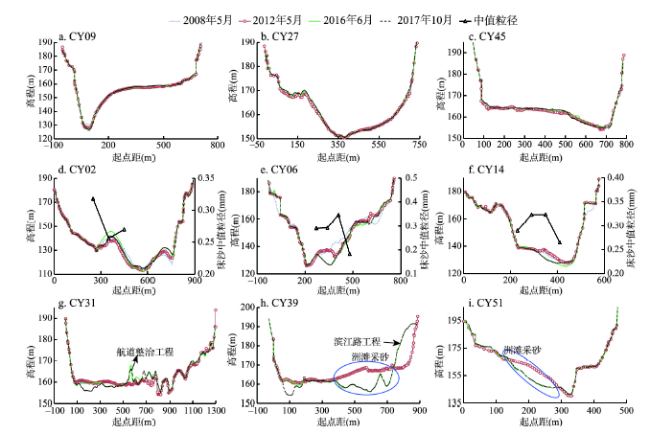
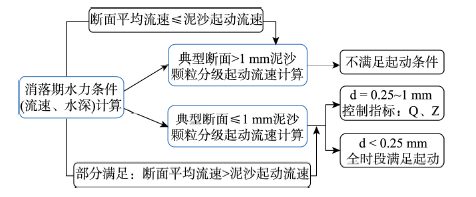
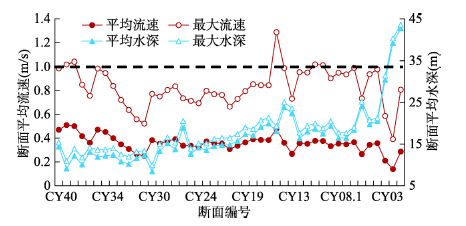
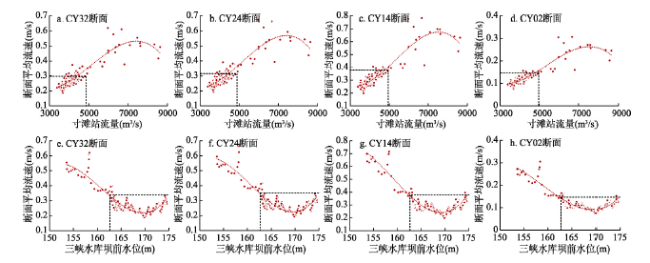
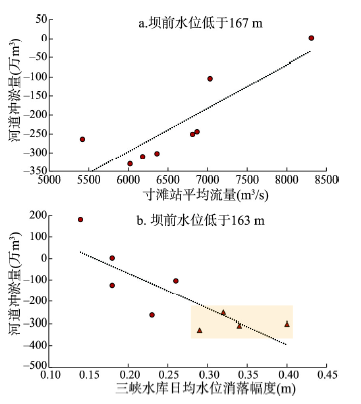
Chongqing reach is located in the fluctuating backwater zone of the Three Gorges Reservoir (TGR). Sediment deposition and erosion of Chongqing reach is related to flood control, shipping and wharf operation. It has become one of the key problems the TGR faces. In this paper, based on the prototype observation data, the sediment scouring and silting law of Chongqing reach before and after the 175 m experimental impoundment of the TGR was investigated for the first time. In addition, combined with the analysis of river bed composition and the one-dimensional mathematical model, the scouring conditions of suspended sediment in Chongqing reach were calculated and analyzed. Furthermore, the basic conditions of sediment transport in the study reach were applied to the practice of sediment reduction of the TGR. The following conclusions can be drawn as follows: (1) From 2008 to 2012, when the water storage level of TGR reached 175 m, the erosion intensity of the river bed in Chongqing reach started to decline, and the main souring period of suspended load was postponed from the water-impoundment stage to the pre-flood stage. After 2013, Xiluodu and Xiangjiaba hydropower stations in the lower reaches of Jinsha River was completed and put into operation. The sediment of Jinsha River was intercepted and the sediment entering the Three Gorges was greatly reduced, which led to another increase of the river bed scouring intensity of Chongqing reach. (2) When the inflow in front of the Three Gorges Dam (TGD) is greater than 4000 m 3/s and the water level is lower than 167 m, the suspended load on the river bed in Chongqing reach begins to scour. When the inflow exceeds 5000 m 3/s, the water level in front of the TGD drops to 163 m, and the scouring intensity of suspended load increases obviously. Increasing the drawdown rate of water level from 163 m before the TGD to 30 cm per day can avoid the cumulative sedimentation in the Chongqing reach.
ZHU Lingling , GE Hua , DONG Bingjiang , YANG Chenggang . Control index of sediment reduction dispatching in Chongqing reach after the storage level of TGR reaching 175 m[J]. Acta Geographica Sinica, 2021 , 76(1) : 114 -126 . DOI: 10.11821/dlxb202101009
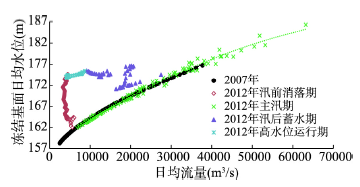
图3 2007年和2012年寸滩站日均水位流量关系Fig. 3 Relationship between average daily water level and average daily flow in 2007 and 2012 |
表1 2007年和2012年三峡水库库尾重庆主城区河段水面比降和流速对比Tab. 1 Comparison of water surface gradient and average velocity of Chongqing reach in 2007 and 2012 |
| 年份 | 时段(月) | 寸滩站 | 坝前 水位(m) | 水面比降 | ||||||
|---|---|---|---|---|---|---|---|---|---|---|
| 流量 (m3/s) | 断面平均 流速(m/s) | 长江干流 (朝天门以上)(‰) | < 0.25‰ 历时(d) | 长江干流 (朝天门以下)(‰) | < 0.15‰ 历时(d) | 嘉陵江段(‰) | < 0.15‰ 历时(d) | |||
| 2007 | 1―5 | 3910 | 1.76 | 151.74 | 0.313 | 0 | 0.145 | 98 | 0.236 | 13 |
| 6―9 | 18800 | 2.39 | 144.67 | 0.224 | 74 | 0.154 | 50 | 0.085 | 91 | |
| 10―12 | 7900 | 2.08 | 154.69 | 0.286 | 15 | 0.132 | 88 | 0.170 | 30 | |
| 2012 | 1―5 | 4860 | 0.792 | 166.08 | 0.109 | 132 | 0.030 | 152 | 0.053 | 133 |
| 6―9 | 23300 | 2.53 | 154.53 | 0.203 | 90 | 0.138 | 92 | 0.060 | 107 | |
| 10―12 | 8400 | 0.806 | 173.80 | 0.029 | 92 | 0.015 | 92 | 0 | 92 | |
Tab. 2 Scouring and silting of Chongqing reach between 2003 and 2017 |
| 时期 | 消落期 | 汛期 | 蓄水期 | ||||||
|---|---|---|---|---|---|---|---|---|---|
| 长江干流 | 嘉陵江 | 全河段 | 长江干流 | 嘉陵江 | 全河段 | 长江干流 | 嘉陵江 | 全河段 | |
| 2003年 | 294 | 75.6 | 370 | 108 | -135 | -27.0 | |||
| 2004年 | -541 | -23.4 | -564 | 658 | 66.3 | 725 | -527 | -143 | -670 |
| 2005年 | -95.3 | 42.9 | -52.4 | 407 | 153 | 560 | -555 | -258 | -812 |
| 2006年 | -63.8 | 40.7 | -23.1 | 116 | -68.8 | 47.5 | -26.9 | 13.1 | -13.8 |
| 2007年 | -120 | 36.1 | -84.0 | 19.1 | -67.2 | -48.1 | 49.9 | -27.3 | 22.6 |
| 2008年 | 185 | 24.1 | 209 | 224 | 57.6 | 281 | -62.0 | -66.8 | -129 |
| 2009年 | -107 | -18.2 | -125 | -17.3 | 57.0 | 39.7 | -5.50 | -72.2 | -77.7 |
| 2010年 | 86.5 | 94.3 | 181 | 114 | -154 | -40.4 | 65.8 | 139 | 205 |
| 2011年 | -198 | -65.9 | -264 | 0.800 | 16.8 | 17.6 | 66.3 | 19.4 | 85.7 |
| 2012年 | -230 | -72.6 | -302 | 198 | 91.8 | 289 | -127 | 18.9 | -108 |
| 2013年 | -273 | -57.0 | -330 | -86.1 | -53.8 | -140 | -185 | 8.1 | -177 |
| 2014年 | -232 | -78.0 | -310 | 148 | -3.3 | 145 | -328 | -7.00 | -335 |
| 2015年 | -198 | -53.7 | -251 | 192 | 84.6 | 277 | -162 | -46.6 | -209 |
| 2016年 | 46.4 | -43.8 | 2.6 | -132 | -1.4 | -133 | 11.4 | 22.6 | 34.0 |
| 2017年 | -87.0 | -17.0 | -104 | -90.0 | 29.0 | -62.0 | 40.0 | -10.0 | 30.0 |
| 2003年5月―2008年9月 (三峡水库初期运行期) | -635 | 120 | -515 | 1720 | 216 | 1940 | -951 | -550 | -1500 |
| 2008年9月―2017年12月 (三峡水库试验性蓄水期) | -1190 | -312 | -1500 | 328 | 66 | 393 | -685 | 5.7 | -679 |
| 2012年10月―2017年12月(金沙江下游梯级电站运行后) | -742 | -250 | -992 | 33 | 55 | 87 | -623 | -33 | -656 |
表3 三峡水库消落期内重庆主城区河段水沙条件统计Tab. 3 Statistics of flow and sediment conditions in Chongqing reach during the drawdown period of TGR |
| 年份 | 三峡水库坝前167 m水位以下 | 三峡水库坝前163 m水位以下 | 泥沙 冲淤量 (万t) | |||||||||||
|---|---|---|---|---|---|---|---|---|---|---|---|---|---|---|
| 消落期 历时 (d) | 日均 消落 幅度(m) | 平均 流量 (m3/s) | 最小 流量 (m3/s) | 平均 含沙量 (kg/m3) | < 4000 m3/s 持续 时间(d) | 消落期 历时 (d) | 日均 消落 幅度(m) | 平均 流量 (m3/s) | 最小 流量 (m3/s) | 平均 含沙量 (kg/m3) | < 4000 m3/s 持续 时间(d) | |||
| 2009 | 110 | 0.19 | 5250 | 3220 | 0.068 | 38 | 93 | 0.18 | 5510 | 3220 | 0.072 | 21 | -125 | |
| 2010 | 147 | 0.15 | 5190 | 2770 | 0.112 | 82 | 125 | 0.14 | 5640 | 2780 | 0.119 | 61 | 181 | |
| 2011 | 109 | 0.20 | 5420 | 3870 | 0.071 | 2 | 76 | 0.23 | 5880 | 4030 | 0.078 | 0 | -264 | |
| 2012 | 102 | 0.21 | 6360 | 3750 | 0.121 | 17 | 43 | 0.40 | 9330 | 5180 | 0.160 | 0 | -302 | |
| 2013 | 124 | 0.18 | 6020 | 3600 | 0.125 | 23 | 62 | 0.29 | 7630 | 4100 | 0.167 | 0 | -330 | |
| 2014 | 131 | 0.16 | 6180 | 3360 | 0.083 | 6 | 50 | 0.34 | 7640 | 5240 | 0.146 | 0 | -310 | |
| 2015 | 105 | 0.21 | 6810 | 4530 | 0.042 | 0 | 54 | 0.32 | 7400 | 5860 | 0.048 | 0 | -251 | |
| 2016 | 111 | 0.19 | 8310 | 4580 | 0.243 | 0 | 73 | 0.18 | 12300 | 6310 | 0.252 | 0 | 2.6 | |
| 2017 | 102 | 0.21 | 7030 | 4110 | 0.036 | 0 | 68 | 0.26 | 7810 | 4110 | 0.042 | 0 | -104 | |
表4 消落期有无减淤调度情况下重庆主城区河段泥沙冲淤量对比Tab. 4 Sediment scouring and silting in Chongqing reach under the condition of silt reduction operation of TGR |
| 起止时间 | 三峡坝前水位(m) | 水位消落 幅度(m) | 水位日均消落 幅度(m/d) | 寸滩站平均 流量(m3/s) | 冲刷量 (104m3) | |
|---|---|---|---|---|---|---|
| 调度前 | 调度后 | |||||
| 2009.04.11—05.11 | 159.80 | 156.05 | 3.75 | 0.13 | 5590 | 48.3 |
| 2009.05.11—06.11 | 156.05 | 146.26 | 9.79 | 0.33 | 7460 | -22.0 |
| 2010.05.11—05.25 | 156.18 | 151.81 | 4.37 | 0.29 | 7860 | 45.8 |
| 2011.04.22—05.18 | 158.56 | 154.53 | 4.03 | 0.16 | 5310 | 76.3 |
| 2012.05.07—05.24 (减淤调度期) | 161.92 | 154.05 | 7.87 | 0.46 | 7570 | -101 |
| 2013.05.13—05.20 (减淤调度期) | 160.17 | 156.12 | 4.05 | 0.58 | 6320 | -33.3 |
| [1] |
[ 三峡工程泥沙专家组. 三峡水库泥沙淤积研究(2001-2005). 北京: 知识产权出版社, 2008.]
|
| [2] |
[ 张绪进, 母德伟, 赵世强. 三峡水库回水变动区重庆河段泥沙淤积影响及治理. 重庆建筑大学学报, 2006,28(5):13-17.]
|
| [3] |
[ 黄悦, 黄煜龄. 溪洛渡水库对三峡水库泥沙淤积影响预估. 中国三峡建设, 2002(9):16-18, 48.]
|
| [4] |
[ 陆永军, 左利钦, 季荣耀, 等. 水沙调节后三峡工程变动回水区泥沙冲淤变化. 水科学进展, 2009,20(3):318-324.]
|
| [5] |
[ 刘兆存, 赵健, 赵世强. 三峡回水变动区重庆主城区河段泥沙冲淤变化试验研究. 水动力学研究与进展A辑, 2012,27(4):388-393.]
|
| [6] |
[ 朱玲玲, 李俊, 袁晶. 三峡水库库尾重庆主城区河段冲淤特性. 长江科学院院报, 2018,35(5):142-146, 156.]
|
| [7] |
[ 李文杰, 杨胜发, 付旭辉, 等. 三峡水库运行初期的泥沙淤积特点. 水科学进展, 2015,26(5):676-685.]
|
| [8] |
[ 袁晶, 许全喜. 金沙江流域水库拦沙效应. 水科学进展, 2018,29(4):482-491.]
|
| [9] |
[ 朱玲玲, 董先勇, 陈泽方. 金沙江下游梯级水库淤积及其对三峡水库影响研究. 长江科学院院报, 2016,34(3):1-7.]
|
| [10] |
[ 张绪进, 何进朝, 母德伟. 上游来水来沙变化及对重庆河段泥沙淤积的影响. 水利水运工程学报, 2010(1):23-29.]
|
| [11] |
[ 王延贵, 曾险, 苏佳林, 等. 三峡水库蓄水后重庆河段冲淤特性研究. 泥沙研究, 2017,42(4):1-8.]
|
| [12] |
[ 袁晶, 许全喜, 董炳江, 等. 消落期三峡水库库尾泥沙冲淤特性研究. 泥沙研究, 2015(3):15-20.]
|
| [13] |
[ 周曼, 黄仁勇, 徐涛. 三峡水库库尾泥沙减淤调度研究与实践. 水力发电学报, 2015,34(4):98-104.]
|
| [14] |
[ 刘德春, 李龙成, 程平, 等. 重庆主城区河段河床边界条件研究. 人民长江, 2007,38(9):132-135.]
|
| [15] |
[ 朱玲玲, 袁晶, 许全喜. 铜锣峡卡口对重庆主城区河段洪水位的影响分析. 泥沙研究, 2013(6):53-59.]
|
| [16] |
[ 卢金友, 黄悦. 三峡水库淤积计算预测与原型实测结果比较分析. 长江科学院院报, 2013,30(12):1-6, 27.]
|
| [17] |
[ 许全喜, 张小峰, 谈广鸣. 非均匀沙起动问题研究A辑. 水动力学研究与进展, 1999,14(2):135-141.]
|
| [18] |
[ 董炳江, 陈显维, 许全喜. 三峡水库沙峰调度试验研究与思考. 人民长江, 2014,45(19):1-5.]
|
| [19] |
[ 许全喜. 长江上游河流输沙规律变化及其影响因素研究[D]. 武汉: 武汉大学, 2007.]
|
| [20] |
[ 朱玲玲, 许全喜, 鄢丽丽. 三峡水库不同类型支流河口泥沙淤积成因及趋势. 地理学报, 2019,74(1):131-145.]
|
/
| 〈 |
|
〉 |