
Thermal environment effects of urban human settlements and influencing factors based on multi-source data: A case study of Changsha city
Received date: 2019-10-12
Request revised date: 2020-07-13
Online published: 2021-01-25
Supported by
National Social Science Foundation of China(15BJY051)
Open Topic of Hunan Key Laboratory of Land Resources Evaluation and Utilization(SYS-ZX-202002)
Research Project of Appraisement Committee of Social Sciences Research Achievements of Hunan Province(XSP18ZDI031)
Copyright
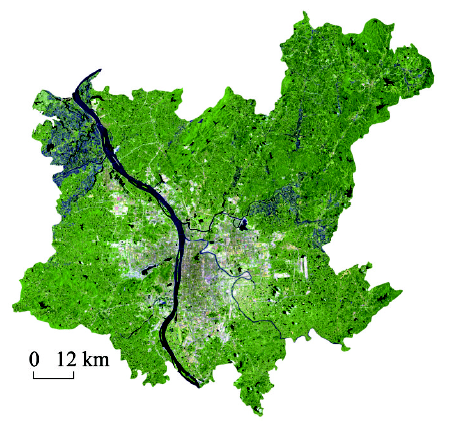
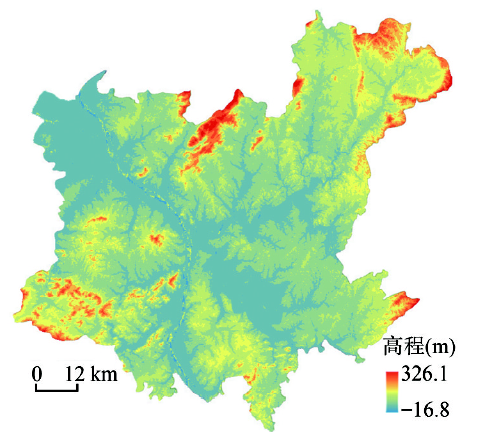
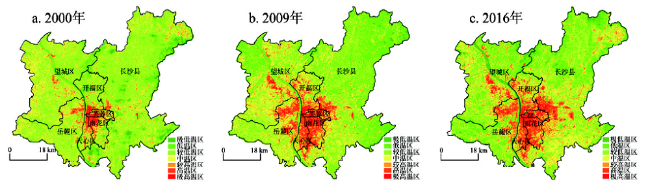
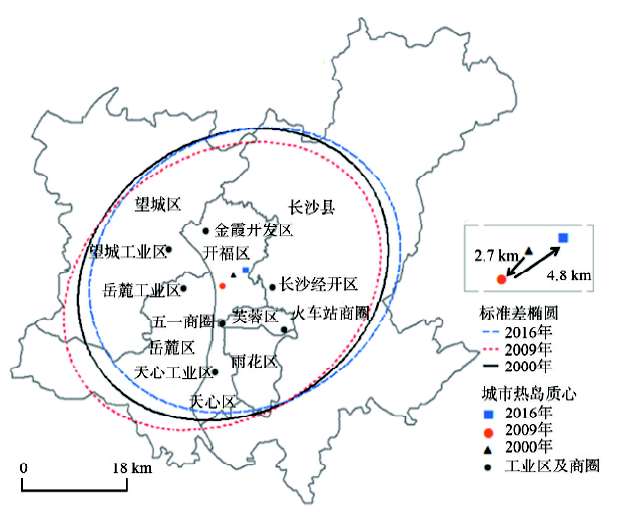
In view of the lack of comprehensive evaluation and analysis from the combination of natural and human multi-dimensional factors, the urban surface temperature patterns of Changsha in 2000, 2009 and 2016 are retrieved based on multi-source spatial data (Landsat 5, Landsat 8 satellite image data, POI spatial big data, digital elevation model, etc.), and 12 natural and human factors closely related to urban thermal environment are quickly obtained. The standard deviation ellipse method and spatial principal component analysis (PCA) method are used to analyze the effect of urban human residential thermal environment and the linkage of its influencing factors. The results show that: (1) During the 16 years from 2000 to 2016, the heat island area increased by 547 km2, and the maximum surface temperature difference reached 10.1 ℃. The spatial distribution of urban heat island was mainly concentrated in urban built-up areas, such as industrial and commercial areas and densely populated urban centers. The spatial distribution pattern of heat island is gradually decreasing from the urban center to the suburbs. There were many high-temperature centers, such as Wuyi square business circle, Xingsha economic and technological development zone in Changsha County, Wangcheng industrial zone, Yuelu industrial concentration zone, and Tianxin industrial zone. (2) From 2000 to 2016, the main axis of spatial development of heat island maintained in the northeast-southwest direction. From 2000 to 2009, the center of gravity of heat island shifted 2.7 km to the southwest, and the deflection angle was 54.9°; the center of gravity of heat island shifted to the northeast by 4.8 km, and the deflection angle was 60.9°. On the whole, the change of spatial pattern of thermal environment in Changsha was related to the change of urban construction intensity. (3) Through the principal component analysis method, it was concluded that the factors affecting the urban thermal environment pattern of Changsha were landscape pattern, urban construction intensity and landform. (4) The promotion effect of human factors on the formation of heat island effect was obviously greater than that of natural factors. Under the comprehensive effect, the temperature would rise by 0.293 units. There are many factors influencing the urban human settlements thermal environment. Multi-source data could help to reveal the spatial pattern and evolution law of urban thermal environment, deepen the understanding of the causes of urban heat island effect, and clarify the correlation and degree between human and natural factors, so as to provide scientific supports for the improvement of the quality of urban human settlements.
XIONG Ying , ZHANG Fang . Thermal environment effects of urban human settlements and influencing factors based on multi-source data: A case study of Changsha city[J]. Acta Geographica Sinica, 2020 , 75(11) : 2443 -2458 . DOI: 10.11821/dlxb202011013
表1 数据来源Tab. 1 Data sources |
| 数据系列 | 数据名称 | 数据来源 | 用途 | 时间 |
|---|---|---|---|---|
| 遥感数据 | Landsat 5 TM、Landsat 8 OLI TIRS | http://www.gscloud | 反演地表温度、提取地表信息 | 2000年7月; 2009年8月; 2016年7月 |
| DEM数据 | http://www.gscloud | 计算高程、坡度 | 2016年 | |
| 矢量数据 | 长沙市行政边界矢量数据 | 中国地球系统科学数据共享网 | 提取研究区边界 | 2016年 |
| 空间大数据 | 长沙市POI数据 | 高德地图 | 提取经济活动指数 | 2016 |
表2 长沙市地表温度等级划分Tab. 2 Classification of surface temperature in Changsha city |
| 温度等级 | 极低温区 | 低温区 | 较低温区 | 中温区 | 较高温区 | 高温区 | 极高温区 |
|---|---|---|---|---|---|---|---|
| 温度区间 |
注:代表研究区地表温度平均值,代表地表温度标准差。 |
表3 2000年、2009年、2016年长沙市地表温度面积及比例Tab. 3 Surface temperature area and proportion in Changsha city in 2000, 2009 and 2016 |
| 年份 | 极低温区 | 低温区 | 较低温区 | 中温区 | 较高温区 | 高温区 | 极高温区 | |||||||
|---|---|---|---|---|---|---|---|---|---|---|---|---|---|---|
| 面积(km) | 比例(%) | 面积(km) | 比例(%) | 面积(km) | 比例(%) | 面积(km) | 比例(%) | 面积(km) | 比例(%) | 面积(km) | 比例(%) | 面积(km) | 比例(%) | |
| 2000 | 76.04 | 1.93 | 456.42 | 11.59 | 2346.89 | 59.57 | 781.76 | 19.84 | 180.58 | 4.58 | 64.75 | 1.64 | 33.07 | 0.84 |
| 2009 | 11.67 | 0.30 | 1003.43 | 25.47 | 1443.27 | 36.64 | 871.28 | 22.12 | 280.12 | 7.11 | 227.68 | 5.78 | 102.07 | 2.59 |
| 2016 | 149.68 | 3.80 | 908.47 | 23.06 | 1274.13 | 32.34 | 852.05 | 21.63 | 371.64 | 9.43 | 278.21 | 7.06 | 105.34 | 2.67 |
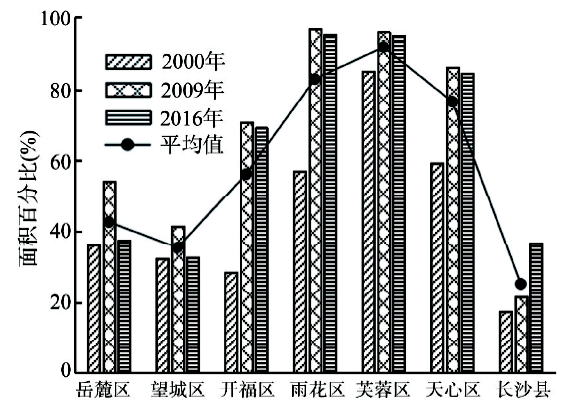
表4 长沙市各行政区地表温度等级面积统计表(km2)Tab. 4 Statistics of surface temperature grade area in each administrative district of Changsha city (km2) |
| 等级区 | 芙蓉区 | 天心区 | 岳麓区 | 开福区 | ||||||||
|---|---|---|---|---|---|---|---|---|---|---|---|---|
| 2000年 | 2009年 | 2016年 | 2000年 | 2009年 | 2016年 | 2000年 | 2009年 | 2016年 | 2000年 | 2009年 | 2016年 | |
| 极低温区 | 0.15 | 0.00 | 0.49 | 0.00 | 0.00 | 6.12 | 0.00 | 0.00 | 17.67 | 6.85 | 0.09 | 7.86 |
| 低温区 | 0.79 | 0.39 | 0.95 | 7.42 | 6.15 | 1.85 | 27.41 | 43.35 | 160.79 | 28.27 | 16.24 | 15.77 |
| 较低温区 | 5.53 | 1.40 | 0.80 | 23.41 | 4.12 | 3.64 | 304.21 | 194.52 | 145.28 | 105.07 | 40.88 | 36.57 |
| 中温区 | 8.91 | 4.45 | 2.30 | 17.06 | 11.68 | 9.72 | 139.86 | 162.65 | 80.28 | 28.03 | 62.51 | 50.41 |
| 较高温区 | 13.39 | 9.15 | 8.78 | 14.02 | 16.26 | 16.52 | 34.94 | 55.74 | 62.31 | 13.59 | 37.60 | 42.48 |
| 高温区 | 8.98 | 16.99 | 16.29 | 9.85 | 26.46 | 28.14 | 10.31 | 47.48 | 45.48 | 6.77 | 27.05 | 32.25 |
| 极高温区 | 5.93 | 11.30 | 14.06 | 3.75 | 10.86 | 9.53 | 3.33 | 16.33 | 8.26 | 7.61 | 11.83 | 10.86 |
| 等级区 | 雨花区 | 望城区 | 长沙县 | |||||||||
| 2000年 | 2009年 | 2016年 | 2000年 | 2009年 | 2016年 | 2000年 | 2009年 | 2016年 | ||||
| 极低温区 | 1.63 | 0.00 | 0.24 | 1.04 | 0.02 | 65.80 | 66.37 | 11.55 | 51.51 | |||
| 低温区 | 7.96 | 0.30 | 1.30 | 83.00 | 213.84 | 249.37 | 301.57 | 723.16 | 478.44 | |||
| 较低温区 | 38.20 | 3.20 | 3.70 | 582.09 | 361.73 | 347.29 | 1288.38 | 837.42 | 736.84 | |||
| 中温区 | 24.50 | 13.72 | 9.03 | 275.08 | 304.85 | 211.57 | 288.31 | 311.42 | 488.74 | |||
| 较高温区 | 18.44 | 21.57 | 24.15 | 35.62 | 68.61 | 69.31 | 50.59 | 71.20 | 148.09 | |||
| 高温区 | 12.87 | 42.28 | 51.56 | 6.04 | 27.05 | 32.25 | 9.92 | 40.38 | 72.24 | |||
| 极高温区 | 7.48 | 30.00 | 21.09 | 2.61 | 9.39 | 9.89 | 2.35 | 12.38 | 31.64 | |||
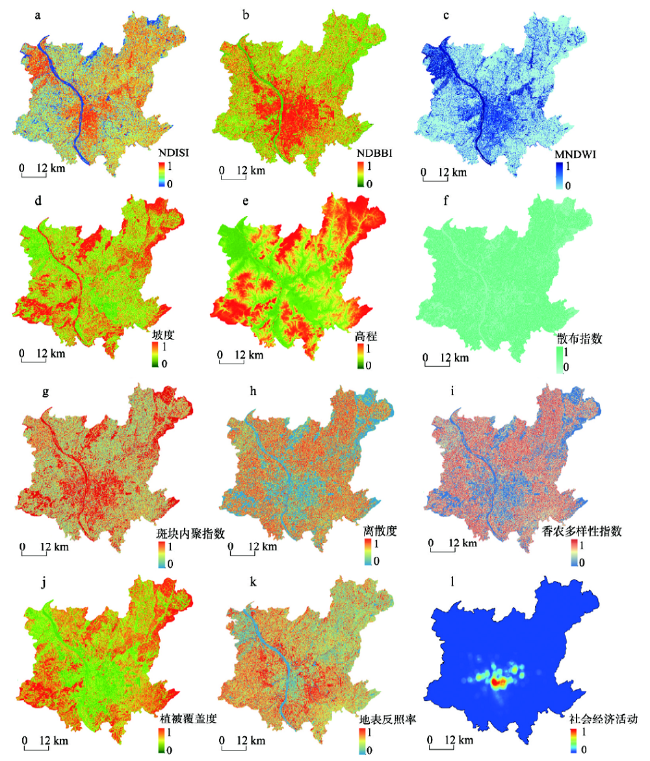
表5 长沙市城市热环境影响因素指标Tab. 5 Index of urban thermal environmental impact factors in Changsha city |
| 一级指标 | 二级指标 | 三级指标 |
|---|---|---|
| 自然因素 | 植被与水体 | 植被覆盖度(FVC) |
| 改进归一化差异水体指数(MNDWI) | ||
| 地形地貌 | 数字地表高程(DEM) | |
| 坡度 | ||
| 人文因素 | 景观格局指数 | 散布指数(CONTAG) |
| 香农多样性指数(SHDI) | ||
| 离散度(DIVISION) | ||
| 斑块内聚力指数(COHESION) | ||
| 城市建设强度 | 归一化差值不透水面指数(NDISI) | |
| 归一化差值裸地与建筑指数(NDBBI) | ||
| 地表反照率(Albedo) | ||
| 社会经济活动 | 兴趣点密度指数(POI) |
表6 影响因子与地表温度之间的Pearson相关性分析Tab. 6 Analysis of the correlation between factors and surface temperature |
| 影响因子 | NDISI | FVC | MNDWI | NDBBI | POI | 高程 | 坡度 | 离散度 | 香农多样数 | 散布 指数 | 斑块内聚力指数 | 地表反照率 |
|---|---|---|---|---|---|---|---|---|---|---|---|---|
| Pearson 相关系数 | 0.369** | -0.508** | -0.326** | 0.815** | 0.519** | -0.514** | -0.270** | -0.276** | -0.373** | -0.338* | 0.433** | 0.395** |
注:**表示相关性在0.01水平显著(双边检测);*表示相关性在0.05水平显著(双边检测)。 |
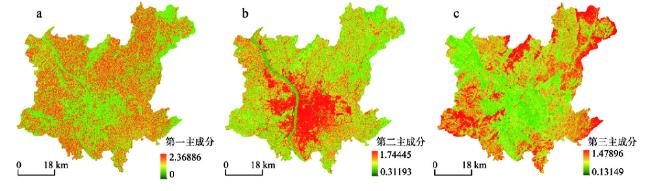
表7 主成分的特征值和贡献率Tab. 7 Characteristic value and contribution rate of principal components |
| 成分 | 初始特征值 | 提取载荷平方和 | ||||
|---|---|---|---|---|---|---|
| 特征值 | 贡献率(%) | 累积贡献率(%) | 特征值 | 方差百分比(%) | 累积贡献率(%) | |
| 1 | 3.557 | 29.644 | 29.644 | 3.557 | 29.644 | 29.644 |
| 2 | 2.637 | 21.978 | 51.622 | 2.637 | 21.978 | 51.622 |
| 3 | 1.893 | 15.778 | 67.400 | 1.893 | 15.778 | 67.400 |
| 4 | 0.991 | 8.254 | 75.654 | |||
| 5 | 0.786 | 6.554 | 82.208 | |||
| 6 | 0.762 | 6.354 | 88.562 | |||
| 7 | 0.514 | 4.286 | 92.848 | |||
| 8 | 0.428 | 3.569 | 96.417 | |||
| 9 | 0.259 | 2.159 | 98.575 | |||
| 10 | 0.134 | 1.114 | 99.689 | |||
| 11 | 0.030 | 0.246 | 99.935 | |||
| 12 | 0.008 | 0.065 | 100.000 | |||
表8 主成分得分载荷矩阵Tab. 8 Principal component scoring load matrix |
| 影响因子 | 第1主成分 | 第2主成分 | 第3主成分 |
|---|---|---|---|
| POI密度指数 | 0.085 | 0.207 | -0.295 |
| 归一化水体指数 | -0.506 | -0.470 | 0.136 |
| 植被覆盖指数 | 0.395 | -0.457 | 0.284 |
| 离散度 | 0.930 | -0.175 | -0.219 |
| 香农多样性 | 0.936 | -0.188 | -0.227 |
| 散布指数 | 0.511 | 0.054 | -0.180 |
| 斑块内聚力指数 | -0.918 | 0.193 | 0.004 |
| 归一化不透水指数 | 0.431 | 0.687 | 0.243 |
| 坡度 | -0.206 | -0.600 | 0.432 |
| 高程 | 0.086 | -0.269 | 0.762 |
| 地表反照率 | -0.144 | 0.817 | -0.125 |
| 归一化差值裸地与建筑指数 | 0.192 | 0.699 | -0.331 |
表9 回归系数及检验结果Tab. 9 Regression coefficient and test results |
| 影响因子 | 未标准化系数 | 标准化系数 Beta | t | 显著性 | 共线性统计 | ||
|---|---|---|---|---|---|---|---|
| B | 标准误差 | 容差 | VIF | ||||
| 常量 | 0.361 | 0.010 | - | 35.175 | 0.000 | - | - |
| 第1主成分 | 0.116 | 0.007 | 0.327 | 15.442 | 0.000 | 0.625 | 1.601 |
| 第2主成分 | 0.012 | 0.008 | 0.031 | 1.471 | 0.000 | 0.644 | 1.553 |
| 第3主成分 | -0.289 | 0.011 | -0.640 | -26.032 | 0.006 | 0.463 | 2.159 |
注:R2 = 0.805;F = 957.765;显著性系数小于1%。 |
表10 不同作用下的城市温度效应Tab. 10 Urban temperature effect under different actions |
| 人文因素 | 自然因素 | 温度 (℃) | ||
|---|---|---|---|---|
| 作用程度 | 变化比例(%) | 作用程度 | 变化比例(%) | |
| 1.754 | 100 | -1.460 | 100 | 0.293 |
| 1.5786 | 90 | -1.606 | 110 | -0.0274 |
| 1.4032 | 80 | -1.752 | 120 | -0.3488 |
| [1] |
[ 沈清基, 张鑫, 周原田. 城市危机:特征、影响变量及表现剖析: 基于生态环境危机的视角. 城市规划学刊, 2012(6):23-33.]
|
| [2] |
|
| [3] |
|
| [4] |
|
| [5] |
|
| [6] |
[ 彭保发, 石忆邵, 王贺封. 城市热岛效应的影响机理及其作用规律: 以上海市为例. 地理学报, 2013,68(11):1461-1471.]
|
| [7] |
|
| [8] |
|
| [9] |
|
| [10] |
|
| [11] |
[ 周亮. 北京市城市化过程中的景观格局演变及热岛效应研究[D]. 北京: 北京林业大学, 2006.]
|
| [12] |
[ 张小飞, 王仰磷, 吴建生, 等. 城市地域地表温度—植被覆盖定量关系分析: 以深圳市为例. 地理研究, 2006,25(3):369-377.]
|
| [13] |
[ 肖凡. 基于多指数的长沙市热岛效应变化研究[D]. 长沙: 湖南师范大学, 2016.]
|
| [14] |
[ 周国华, 贺艳华. 长沙城市土地扩张特征及影响因素. 地理学报, 2006,61(11):1171-1180.]
|
| [15] |
[ 傅帅, 蒋勇, 张小泉, 等. 近64年长沙市高温热浪事件统计分析. 气象科技, 2016,44(6):991-997.]
|
| [16] |
[ 金点点, 宫兆宁. 基于Landsat系列数据地表温度反演算法对比分析: 以齐齐哈尔市辖区为例. 遥感技术与应用, 2018,33(5):830-841.]
|
| [17] |
[ 徐涵秋. 一种快速提取不透水面的新型遥感指数. 武汉大学学报(信息科学版), 2008,33(11):1150-1153.]
|
| [18] |
[ 郑新奇, 付梅巨. 景观格局空间分析技术及其应用. 北京: 科学出版社, 2010.]
|
| [19] |
[ 薛冰, 李京忠, 肖骁, 等. 基于兴趣点(POI)大数据的人地关系研究综述: 理论、方法与应用. 地理与地理信息科学, 2019,35(6):51-60.]
|
| [20] |
[ 陆守一. 地理信息系统. 北京: 高等教育出版社, 2004.]
|
| [21] |
[ 冯晓刚, 撒利伟, 石辉. 基于多元目标的主成分分析的热岛效应成因研究: 以西安市为例. 西安建筑科技大学学报(自然科学版), 2012,44(4):507-511.]
|
| [22] |
[ 潘竟虎, 李宝娟. 基于空间PCA的兰州市热环境人文驱动因素分析. 干旱区地理, 2011,34(4):662-670.]
|
| [23] |
[ 赵璐, 赵作权. 基于特征椭圆的中国经济空间分异研究. 地理科学, 2014,34(8):979-986.]
|
| [24] |
[ 焦利民, 李泽慧, 许刚, 等. 武汉市城市空间集聚要素的分布特征与模式. 地理学报, 2017,72(8):1432-1443.]
|
/
| 〈 |
|
〉 |
