
Spatial differentiation of urban housing prices in integrated region of Yangtze River Delta
Received date: 2019-03-25
Request revised date: 2020-05-20
Online published: 2020-12-25
Supported by
National Natural Science Foundation of China(41771184)
Copyright
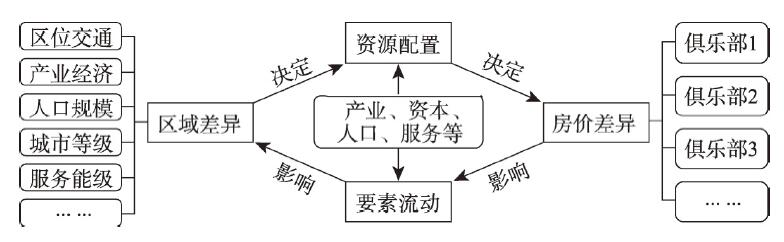
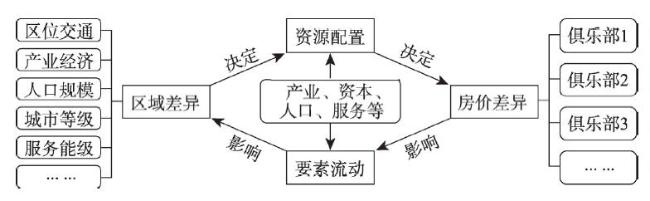
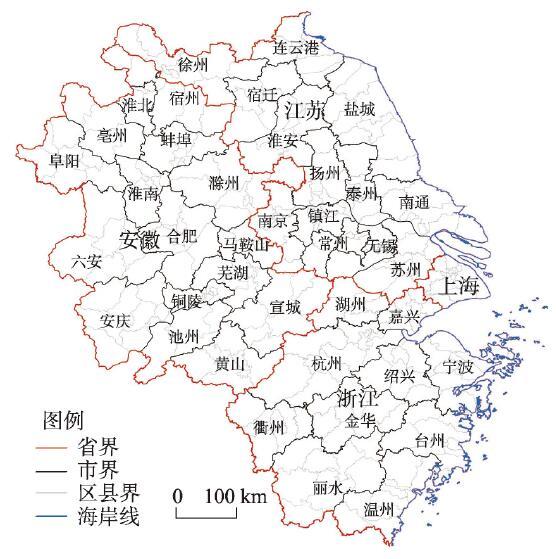
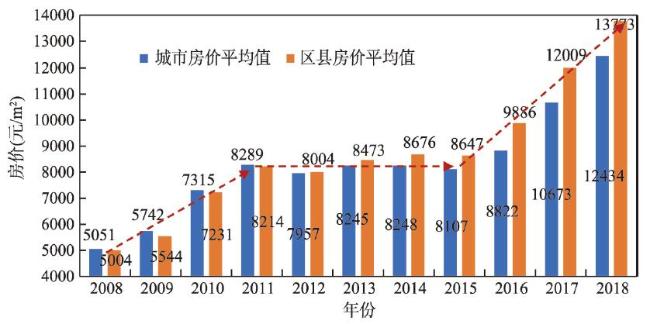
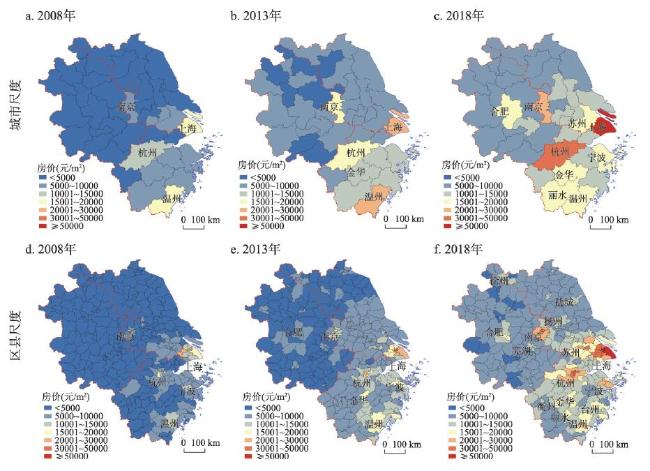
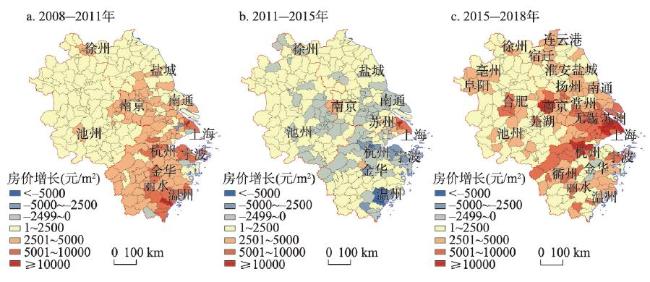
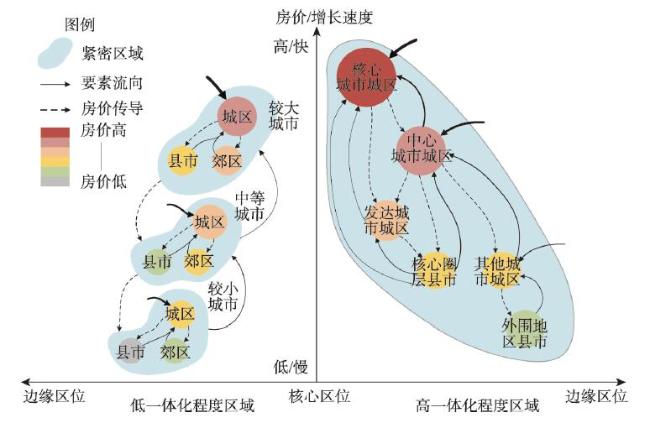
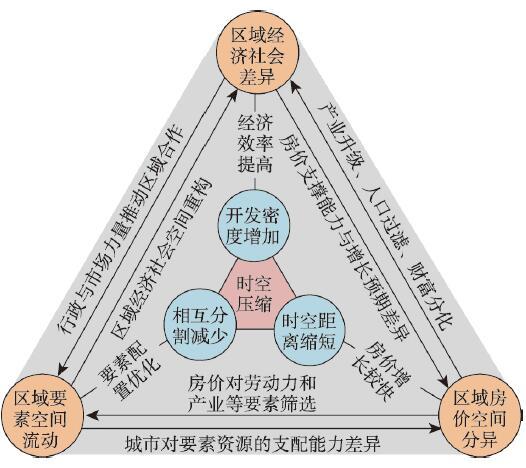
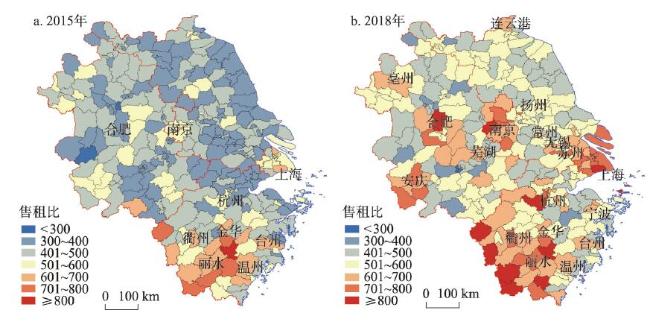
Since the market-oriented reform of the housing system, China's urban housing prices have risen rapidly, and regional differentiation intensifies. Although the Chinese government has repeatedly emphasized that "housing is for living, not for speculation" the trend of rising prices in cities has not been suppressed, and the spatial differentiation of regional urban housing prices has become highlighted. Spatial differentiation of housing prices is a comprehensive reflection of the urban development gap, or a materialized expression of the differences in urban resource allocation abilities. Taking the integrated region of the Yangtze River Delta as an example, and based on the average urban housing price data of prefecture-level cities, districts, and counties between 2008 and 2018 provided by China Housing Prices, we found that the housing prices experienced three stages, namely, "fast growth", "relatively stable", and "faster growth". When the prices grew, the gap of prices between cities, especially between districts and counties, also grew, that is, integrated development did not bring about the convergence of regional housing prices. The housing prices in core and central cities, like Shanghai, Nanjing, and Hangzhou, grew more quickly, and the gaps between Zhejiang/Southern Jiangsu and Anhui/Northern Jiangsu became more obvious. Similarly, there was a huge gap in the housing prices of different districts and counties in a city. Out of consideration for reducing data error and raising analytical accuracy, and based on clarifying the pattern of spatial differentiation of urban housing prices, this paper mainly takes district and county as analysis units, and discusses the growth of housing prices in different types of districts and counties. According to the characteristics of housing price growth, city level, and location, this paper divides the 327 districts and counties of the Yangtze River Delta into six types: urban areas of core cities, urban areas of central cities, urban areas of developed cities, urban areas of other cities, counties and cities in the core circle, and counties and cities in the peripheral regions. It also discovers that, in the process of regional integration, resources flow more quickly, and high-end elements gather towards a small number of superstar cities. This means that the integrated region presents a faster price growth, a larger gap between core-edge housing prices, and the stronger convergence of similar city clubs. On this basis, we identify the mutual feedback effect of the urban economic and social differences in the integrated region, the flow of resource elements like industry and population, and the spatial differentiation of urban housing prices. The increased difference in regional housing prices will result in the forced upgrade of industries in cities with high housing prices, the loss of low-end manufacturing posts, and the concentration of social wealth to "superstar cities". Finally, in combination with the requirement for high-quality integrated development of the Yangtze River Delta, and the judgment on the rationality of regional urban housing price differentiation, this paper proposes pertinent suggestions to the adjustment and control of urban housing prices.
SONG Weixuan , CHEN Yanru , SUN Jie , HE Miao . Spatial differentiation of urban housing prices in integrated region of Yangtze River Delta[J]. Acta Geographica Sinica, 2020 , 75(10) : 2109 -2125 . DOI: 10.11821/dlxb202010006
表1 2008—2018年长三角城市房价泰尔指数与贡献率变化Tab. 1 Theil indexes and contribution rate of housing price in the Yangtze River Delta from 2008 to 2018 |
| 年份 | 城市尺度 | 区县尺度 | ||||
|---|---|---|---|---|---|---|
| 整体指数 | 贡献率(%) | 整体指数 | 贡献率(%) | |||
| 省域间 | 省域内(城市间) | 城市间 | 城市内 | |||
| 2008 | 0.0688 | 48.41 | 51.59 | 0.0970 | 81.52 | 18.48 |
| 2009 | 0.0695 | 51.67 | 48.33 | 0.0888 | 79.50 | 20.50 |
| 2010 | 0.0759 | 53.49 | 46.51 | 0.1054 | 79.96 | 20.04 |
| 2011 | 0.0702 | 57.27 | 42.73 | 0.0985 | 77.86 | 22.14 |
| 2012 | 0.0572 | 59.78 | 40.22 | 0.0906 | 77.69 | 22.31 |
| 2013 | 0.0587 | 58.17 | 41.83 | 0.0954 | 79.06 | 20.94 |
| 2014 | 0.0612 | 53.04 | 46.96 | 0.1022 | 80.51 | 19.49 |
| 2015 | 0.0651 | 49.50 | 50.50 | 0.1121 | 81.39 | 18.61 |
| 2016 | 0.0814 | 38.74 | 61.26 | 0.1475 | 83.69 | 16.31 |
| 2017 | 0.0789 | 36.49 | 63.51 | 0.1479 | 84.48 | 15.52 |
| 2018 | 0.0714 | 42.67 | 57.33 | 0.1286 | 82.25 | 17.75 |
注:因上海属省级直辖市,计算城市尺度泰尔指数的省域间和省域内贡献率时,采用将上海市并入浙江省的方式处理。 |
表2 基于房价及增长特征划分的长三角6类区县属性Tab. 2 Attributes of six types of districts and counties in the Yangtze River Delta, divided based on housing price and growth characteristics |
| 类型 | 数量(个) | 区县名称 | 均价(元/m2) | ||
|---|---|---|---|---|---|
| 2008年 | 2018年 | ||||
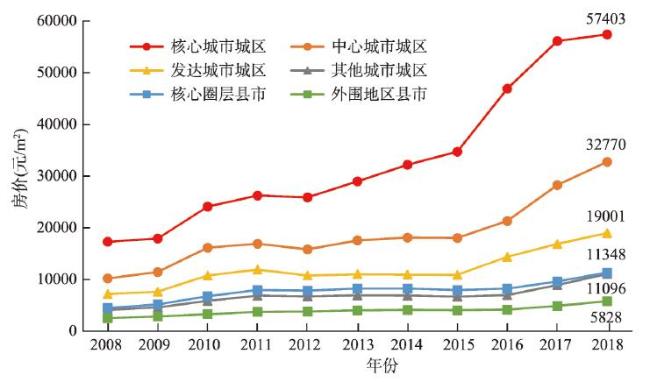
| 超级明星城市 | 核心城市城区 | 16 | 宝山、长宁、奉贤、虹口、黄浦、静安、嘉定、卢湾、闵行、浦东、普陀(上海)、青浦、松江、徐汇 、杨浦、闸北 | 17307 | 57403 |
| 中心城市城区 | 19 | 白下、鼓楼(南京)、江宁、建邺、浦口、秦淮、栖霞、下关、玄武、雨花台;滨江、富阳、拱墅、江干、上城、下城、西湖、萧山、余杭 | 10223 | 32770 | |
| 非超级明星 城市 | 发达城市城区 | 26 | 金山;沧浪、苏州工业园区、虎丘、金阊、平江、吴中、相城;北仑、海曙、江北、江东、鄞州、镇海;鹿城、龙湾、瓯海;包河、滨湖新区、合肥高新区、合肥经开区、庐阳、蜀山、新站、瑶海、合肥政务区 | 7197 | 19001 |
| 其他城市城区 | 80 | 戚墅堰、天宁、武进、新北、钟楼;淮安、淮阴、洪泽、淮安经开区、清江浦、青浦;海州、新浦;崇川、港闸、南通开发区、通州;宿城、宿豫;高港、海陵;滨湖、北塘、崇安、惠山、南长、锡山;鼓楼(徐州)、泉山、铜山、云龙;亭湖、盐都;广陵、邗江、江都、维扬;丹徒、京口、润州;南浔、吴兴;南湖、平湖、秀洲;金东、婺城;莲都;柯城、衢江;柯桥、上虞、越城;黄岩、椒江、路桥;定海、普陀(舟山);大观、迎江、宜秀;蚌山;贵池;琅琊;颍东、颍泉、颍州;屯溪;金安、裕安;花山、雨山;狮子山、铜官、义安;镜湖、鸠江、三山、弋江;宣州 | 4136 | 11096 | |
| 高需求城市 | 核心圈层县市 | 90 | 崇明;金坛、溧阳;高淳、六合、溧水;海安、海门、启东、如东、如皋;常熟、昆山、太仓、吴江、张家港;靖江、姜堰、泰兴、兴化;江阴、宜兴;宝应、高邮、仪征;镇江新区、丹阳、句容、扬中;淳安、建德、临安、桐庐;安吉、长兴、德清;海宁、海盐、嘉善、桐乡;东阳、兰溪、磐安、浦江、武义、永康、义乌;景宁、缙云、龙泉、青田、庆元、遂昌、松阳、云和;慈溪、奉化、宁海、象山、余姚;常山、江山、开化、龙游;嵊州、新昌、诸暨;临海、三门、天台、温岭、仙居、玉环;苍南、洞头、乐清、平阳、瑞安、泰顺、文成、永嘉;岱山、嵊泗;长丰、巢湖、肥东、肥西、庐江;繁昌、无为 | 4515 | 11349 |
| 低需求城市 | 外围地区县市 | 96 | 金湖;连云区、东海、赣榆、灌云;睢宁;滨海、大丰、东台;涟水、盱眙;灌南;泗阳、泗洪、沭阳;丰县、贾汪、沛县、邳州、新沂;阜宁、建湖、射阳、响水;怀宁、潜山、宿松、桐城、太湖、望江、岳西、枞阳;固镇、淮上、怀远、龙子湖、五河、禹会;东至、青阳、石台;定远、凤阳、来安、明光、南谯、全椒、天长;阜南、界首、临泉、太和、颍上;杜集、烈山、濉溪、相山;八公山、大通、凤台、潘集、田家庵、谢家集;黄山、徽州、祁门、歙县、休宁、黟县;霍邱、霍山、金寨、舒城、寿县;当涂、含山、和县、金家庄;砀山、灵璧、泗县、萧县、埇桥;郊区;南陵、芜湖;广德、旌德、泾县、绩溪、郎溪、宁国;涡阳、利辛、蒙城、谯城 | 2508 | 5828 |
图5 2008—2018年长三角6类区县房价增长过程比较Fig. 5 Comparison of housing price growth for six types of districts and counties in the Yangtze River Delta from 2008 to 2018 |
| [1] |
|
| [2] |
|
| [3] |
|
| [4] |
|
| [5] |
[ 王洋, 王德利, 王少剑 . 中国城市住宅价格的空间分异格局及影响因素. 地理科学, 2013,33(10):1157-1165.]
|
| [6] |
[ 王少剑, 王洋, 蔺雪芹 , 等. 中国县域住宅价格的空间差异特征与影响机制. 地理学报, 2016,71(8):1329-1342.]
|
| [7] |
[ 宋伟轩, 马雨竹, 李晓丽 , 等. 南京城市住宅小区房价增长模式与效应. 地理学报, 2018,73(10):1880-1895.]
|
| [8] |
[ 邹瑾, 于焘华, 王大波 . 人口老龄化与房价的区域差异研究: 基于面板协整模型的实证分析. 金融研究, 2015(11):64-79.]
|
| [9] |
[ 张传勇 . 劳动力流动、房价上涨与城市经济收敛: 长三角的实证分析. 产业经济研究, 2016(3):82-90.]
|
| [10] |
|
| [11] |
[ 余亮亮, 蔡银莺 . 土地供给结构、财政压力与房价: 来自广东省的经验分析. 中国土地科学, 2018,32(8):30-36.]
|
| [12] |
|
| [13] |
[ 方晓萍, 丁四保 . 中国城市住房价格的地理扩散及其区域外部性问题. 地理科学, 2012,32(2):143-148.]
|
| [14] |
|
| [15] |
|
| [16] |
|
| [17] |
|
| [18] |
[ 林睿, 董纪昌, 李秀婷 , 等. 中国区域房地产价格异质收敛与调控政策研究. 管理科学学报, 2016,19(11):63-74.]
|
| [19] |
|
| [20] |
|
| [21] |
[ 宋伟轩, 刘春卉 . 长三角一体化区域城市商品住宅价格分异机理研究. 地理研究, 2018,37(1):92-102.]
|
| [22] |
|
| [23] |
[ 丁如曦, 倪鹏飞 . 中国城市住房价格波动的区域空间关联与溢出效应: 基于2005—2012年全国285个城市空间面板数据的研究. 财贸经济, 2015,36(6):136-150.]
|
| [24] |
[ 张谦, 王成璋, 王章名 . 中国城市住房价格的空间效应与滞后效应研究. 统计研究, 2016,33(7):38-45.]
|
| [25] |
|
| [26] |
[ 刘嘉毅, 陶婷芳, 夏鑫 . 产业结构变迁与住宅价格关系实证研究: 来自中国内地的经验分析. 财经研究, 2014,40(3):73-84.]
|
| [27] |
[ 戴洋, 田桂良 . 基于产业结构升级视角的住宅价格影响分析: 以江苏省为例. 世界科技研究与发展, 2015,37(5):605-610.]
|
| [28] |
|
| [29] |
|
| [30] |
[ 陆铭, 欧海军, 陈斌开 . 理性还是泡沫: 对城市化、移民和房价的经验研究. 世界经济, 2014(1):30-54.]
|
| [31] |
[ 高波, 陈健, 邹琳华 . 区域房价差异、劳动力流动与产业升级. 经济研究, 2012,3(1):66-79.]
|
| [32] |
[ 谷卿德, 石薇, 王洪卫 . 产业结构对房地产价格影响的实证研究. 商业研究, 2015(2):44-52.]
|
| [33] |
|
| [34] |
[ 张莉, 何晶, 马润泓 . 房价如何影响劳动力流动. 经济研究, 2017,52(8):155-170.]
|
| [35] |
[ 陈雯, 王珏, 孙伟 . 基于成本—收益的长三角地方政府的区域合作行为机制案例分析. 地理学报, 2019,74(2):312-322.]
|
| [36] |
|
| [37] |
The World Bank. World Development Report 2009: Reshaping Economic Geography. Beijing: Tsinghua University Press, 2009.
[ 世界银行. 2009年世界发展报告: 重塑世界经济地理. 北京: 清华大学出版社, 2009.]
|
| [38] |
[ 吴威, 曹有挥, 曹卫东 , 等. 长三角地区交通优势度的空间格局. 地理研究, 2011,30(12):2199-2208.]
|
| [39] |
[ 陈雯, 王珏 . 长江三角洲空间一体化发展格局的初步测度. 地理科学, 2013,33(8):902-908.]
|
| [40] |
[ 王珏, 陈雯 . 全球化视角的区域主义与区域一体化理论阐释. 地理科学进展, 2013,32(7):1082-1091.]
|
| [41] |
[ 殷洁, 罗小龙, 肖菲 . 国家级新区的空间生产与治理尺度建构. 人文地理, 2018,33(3):89-96.]
|
| [42] |
|
| [43] |
[ 陈雯, 孙伟, 袁丰 . 长江三角洲区域一体化空间合作、分工与差异. 北京: 商务印书馆, 2018.]
|
| [44] |
|
| [45] |
|
| [46] |
[ 迪力沙提·亚库甫, 严金明 . 京津冀地区住宅价格传导路径: 基于10个城市的实证研究. 土地经济研究, 2017,8(2):118-136.]
|
| [47] |
[ 龚健, 栾君, 王文婷 , 等. 长三角城市群住宅价格的空间传导路径. 经济地理, 2017,37(7):90-98.]
|
| [48] |
|
| [49] |
|
| [50] |
|
| [51] |
|
| [52] |
[ 邵挺, 范剑勇 . 房价水平与制造业的区位分布: 基于长三角的实证研究. 中国工业经济, 2010(10):24-33.]
|
| [53] |
[ 范剑勇, 邵挺 . 房价水平、差异化产品区位分布与城市体系. 经济研究, 2011(2):87-99.]
|
| [54] |
|
| [55] |
|
| [56] |
[ 孙伟增, 郑思齐 . 居民对房价的预期如何影响房价变动. 统计研究, 2016,33(5):51-59.]
|
| [57] |
|
| [58] |
|
| [59] |
[ 吕江林 . 我国城市住房市场泡沫水平的度量. 经济研究, 2010(6):28-41.]
|
/
| 〈 |
|
〉 |