
Geo-economic relations of China and the US in Northeast Asia: An analysis based on flow data
Received date: 2019-01-18
Request revised date: 2020-04-07
Online published: 2020-12-25
Supported by
National Natural Science Foundation of China(41871128)
National Natural Science Foundation of China(41661033)
National Natural Science Foundation of China(41701133)
Major Programme of National Social Science Foundation of China(16ZDA041)
Strategic Priority Research Program of the Chinese Academy of Sciences(XDA20100311)
Copyright
With the advancement of globalization and market economy, geo-economic relation has increasingly attracted scholars' attentions. Trade data, including import and export flows, has dominated the geo-economy research owing to its availability and representativeness. However, this might incline geo-economy research toward trade studies and disregard the importance of other international economic components, such as investment. Combining investment and trade data in doing geo-economic analysis could provide us with a more comprehensive understanding of economic relations between countries. Taking China, the US and Northeast Asian countries as an example, this paper explores the patterns of geo-economic relations between these countries, inspects the driving forces and formation mechanism of the patterns, and also makes comparison between China and the US. As a typical region with unbalanced politics and economy and greatly influenced by both China and the US, Northeast Asia can be a salient sample for geo-economic research. A geo-economic streaming potential model is proposed to evaluate comprehensive geo-economic relations which take into account both trade and investment. The conclusions are as follows. First, from 2000 to 2016, the geo-economic relations between China and Northeast Asian countries were strengthened, during which trade flow constantly occupied the dominating position. However, since 2012, the proportion of investment in geo-economy has increased rapidly. Second, the geo-economic flows between China and the US were the strongest with the fastest growth. The geo-economic flows between China and Japan, South Korea were increasing, while those between China and Russia, Mongolia and North Korea had limited influence. Third, both China and the US had expanding geo-economic flows with Northeast Asian countries and similar distribution pattern. Two major differences are also noted. One is that driving forces are different with China's geo-economic relations driven by trade flows and those of the US driven by investment. The other difference is that China's connections with Russia, Mongolia and North Korea have been strengthened while the US has been trying to maintain strong geo-economic relations with Japan and South Korea.
MA Teng , GE Yuejing , HUANG Yu , LIU Xiaofeng , LIN Rongping , HU Zhiding . Geo-economic relations of China and the US in Northeast Asia: An analysis based on flow data[J]. Acta Geographica Sinica, 2020 , 75(10) : 2076 -2091 . DOI: 10.11821/dlxb202010004
表1 东北亚各国市场开放程度的李克特量表Tab. 1 Likert scale of market exposure of Northeast Asian countries |
| 市场开放程度 | 包含国家 | 加入WTO时间 | 赋值 |
|---|---|---|---|
| 非常开放 | 美国 | 1994 | 5 |
| 比较开放 | 日本 | 1994 | 4 |
| 韩国 | 1994 | ||
| 一般开放 | 蒙古 | 1997 | 3 |
| 中国 | 2001 | ||
| 比较封闭 | 俄罗斯 | 2012 | 2 |
| 非常封闭 | 朝鲜 | 未加入 | 1 |
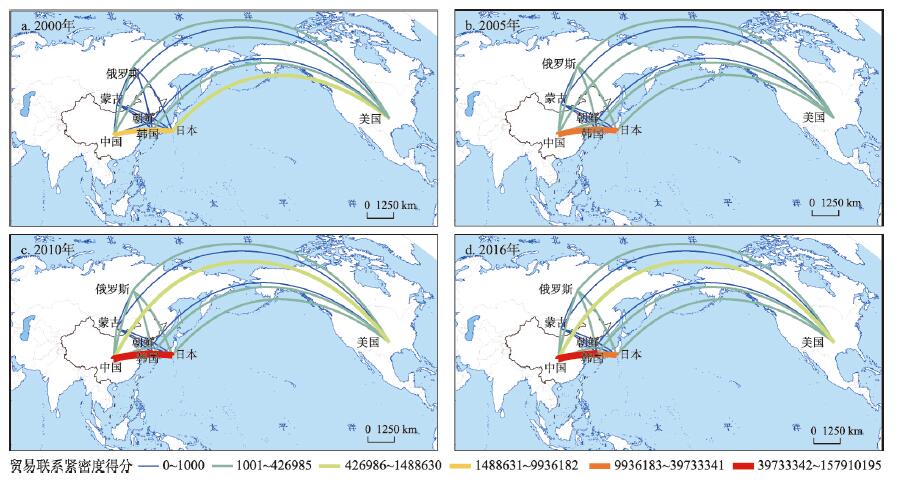
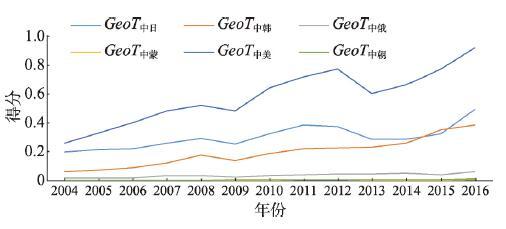
图3 2004—2016年中国与东北亚各国贸易流势结果Fig. 3 Trade streaming potentials of China with Northeast Asian countries in 2004-2016 |
表2 2004—2016年中国与东北亚各国贸易流势结果Tab. 2 Measurement result of trade streaming potential of China with Northeast Asian countries in 2004-2016 |
| 年份 | GeoT中日 | GeoT中韩 | GeoT中俄 | GeoT中蒙 | GeoT中美 | GeoT中朝 |
|---|---|---|---|---|---|---|
| 2004 | 0.198653 | 0.063552 | 0.015417 | 0.001566 | 0.259292 | 0.002868 |
| 2005 | 0.216795 | 0.075297 | 0.018969 | 0.001725 | 0.330009 | 0.003151 |
| 2006 | 0.222676 | 0.086995 | 0.020029 | 0.00185 | 0.403782 | 0.003137 |
| 2007 | 0.257802 | 0.123021 | 0.031677 | 0.002348 | 0.484522 | 0.003482 |
| 2008 | 0.292919 | 0.177031 | 0.035691 | 0.002625 | 0.520465 | 0.004249 |
| 2009 | 0.255971 | 0.136953 | 0.022546 | 0.003123 | 0.482747 | 0.004485 |
| 2010 | 0.325962 | 0.18804 | 0.033208 | 0.003555 | 0.644983 | 0.004821 |
| 2011 | 0.387919 | 0.218801 | 0.041927 | 0.004724 | 0.721979 | 0.005548 |
| 2012 | 0.375531 | 0.224483 | 0.045527 | 0.004349 | 0.774254 | 0.005599 |
| 2013 | 0.285369 | 0.23043 | 0.043764 | 0.004035 | 0.6051 | 0.00555 |
| 2014 | 0.284758 | 0.257787 | 0.049055 | 0.003884 | 0.663472 | 0.00553 |
| 2015 | 0.323001 | 0.352887 | 0.041384 | 0.003476 | 0.773953 | 0.005819 |
| 2016 | 0.49729 | 0.387959 | 0.061649 | 0.009182 | 0.922725 | 0.011615 |
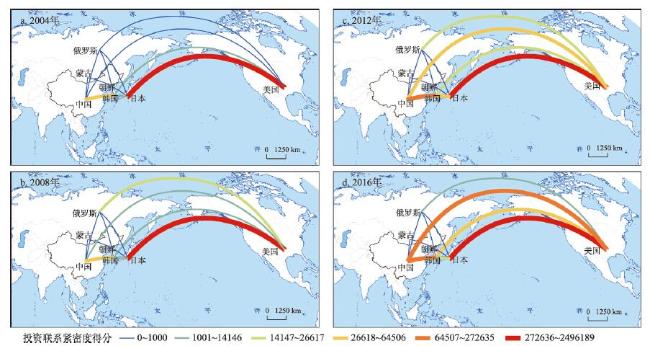
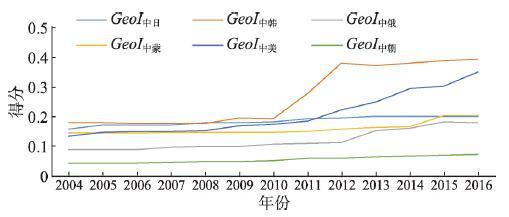
图4 2004—2016年中国与东北亚各国投资流势结果Fig. 4 Investment streaming potentials of China with Northeast Asian countries in 2004-2016 |
表3 2004—2016年中国与东北亚各国投资流势结果Tab. 3 Measurement result of investment streaming potential of China with Northeast Asian countries in 2004-2016 |
| 年份 | GeoI中日 | GeoI中韩 | GeoI中俄 | GeoI中蒙 | GeoI中美 | GeoI中朝 |
|---|---|---|---|---|---|---|
| 2004 | 0.158649 | 0.178929 | 0.087951 | 0.145102 | 0.134625 | 0.043586 |
| 2005 | 0.173257 | 0.179049 | 0.088566 | 0.145273 | 0.148514 | 0.043241 |
| 2006 | 0.171622 | 0.17793 | 0.089425 | 0.145847 | 0.149631 | 0.04444 |
| 2007 | 0.171806 | 0.178687 | 0.098073 | 0.146703 | 0.151387 | 0.046355 |
| 2008 | 0.179543 | 0.176713 | 0.098917 | 0.147642 | 0.153293 | 0.048775 |
| 2009 | 0.180754 | 0.195692 | 0.099659 | 0.148709 | 0.16881 | 0.049762 |
| 2010 | 0.182322 | 0.193295 | 0.1078 | 0.149303 | 0.174384 | 0.05216 |
| 2011 | 0.194361 | 0.278586 | 0.109854 | 0.150678 | 0.186676 | 0.059351 |
| 2012 | 0.19652 | 0.381083 | 0.112196 | 0.158648 | 0.222806 | 0.060461 |
| 2013 | 0.202185 | 0.372649 | 0.154419 | 0.165132 | 0.249994 | 0.064399 |
| 2014 | 0.201621 | 0.381019 | 0.162381 | 0.166427 | 0.295461 | 0.068422 |
| 2015 | 0.201315 | 0.388224 | 0.182308 | 0.203822 | 0.302189 | 0.070722 |
| 2016 | 0.201764 | 0.394079 | 0.179638 | 0.204127 | 0.352566 | 0.072224 |
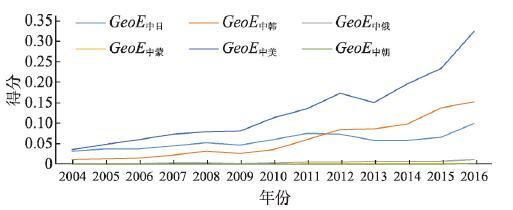
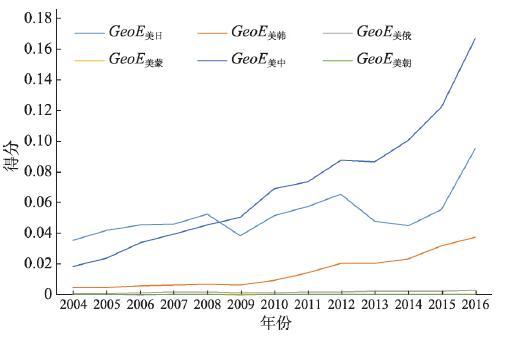
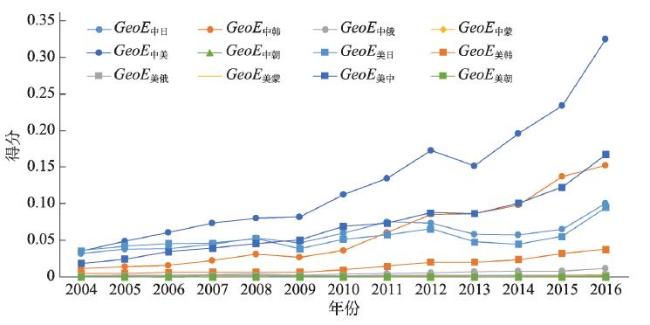
表4 2004—2016年中国与东北亚各国地缘经济流势测算结果Tab. 4 Measurement result of geo-economic streaming potentials of China with Northeast Asian countries in 2004-2016 |
| 年份 | GeoE中日 | GeoE中韩 | GeoE中俄 | GeoE中蒙 | GeoE中美 | GeoE中朝 |
|---|---|---|---|---|---|---|
| 2004 | 0.031516 | 0.011371 | 0.001356 | 0.000227 | 0.034907 | 0.000125 |
| 2005 | 0.037561 | 0.013482 | 0.00168 | 0.000251 | 0.049011 | 0.000136 |
| 2006 | 0.038216 | 0.015479 | 0.001791 | 0.00027 | 0.060418 | 0.000139 |
| 2007 | 0.044292 | 0.021982 | 0.003107 | 0.000344 | 0.07335 | 0.000161 |
| 2008 | 0.052592 | 0.031284 | 0.00353 | 0.000387 | 0.079784 | 0.000207 |
| 2009 | 0.046268 | 0.026801 | 0.002247 | 0.000464 | 0.081492 | 0.000223 |
| 2010 | 0.05943 | 0.036347 | 0.00358 | 0.000531 | 0.112475 | 0.000251 |
| 2011 | 0.075396 | 0.060955 | 0.004606 | 0.000712 | 0.134776 | 0.000329 |
| 2012 | 0.0738 | 0.085547 | 0.005108 | 0.00069 | 0.172508 | 0.000339 |
| 2013 | 0.057697 | 0.085869 | 0.006758 | 0.000666 | 0.151271 | 0.000357 |
| 2014 | 0.057413 | 0.098222 | 0.007966 | 0.000646 | 0.19603 | 0.000378 |
| 2015 | 0.065025 | 0.136999 | 0.007545 | 0.000709 | 0.233881 | 0.000412 |
| 2016 | 0.100335 | 0.152886 | 0.011075 | 0.001874 | 0.325321 | 0.000839 |
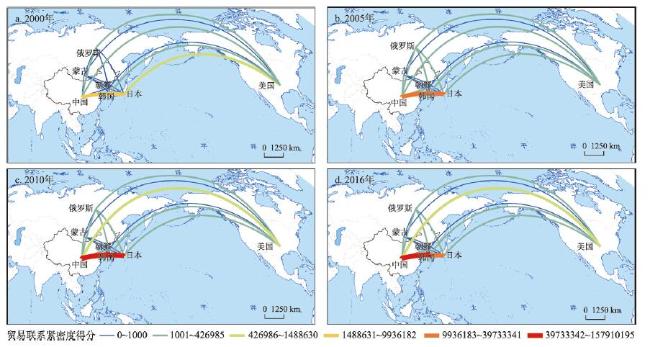
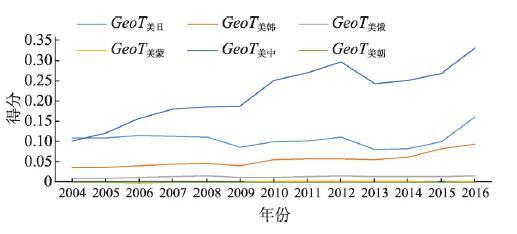
图6 2004—2016年美国与东北亚各国贸易流势结果Fig. 6 Trade streaming potential of the US with Northeast Asian countries in 2004-2016 |
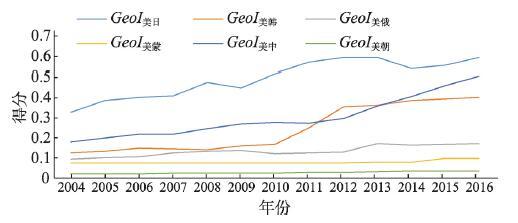
图7 2004—2016年美国与东北亚各国投资流势结果Fig. 7 Investment streaming potentials of the US with Northeast Asian countries in 2004-2016 |
| [1] |
[ 王礼茂, 牟初夫, 陆大道 . 地缘政治演变驱动力变化与地缘政治学研究新趋势. 地理研究, 2016,35(1):3-13.]
|
| [2] |
[ 倪世雄 . 我国的地缘政治及其战略研究. 北京: 经济科学出版社, 2015: 23-25.]
|
| [3] |
|
| [4] |
|
| [5] |
|
| [6] |
[ 李敦瑞 . 地缘经济学的理论流派与发展趋向. 中南财经政法大学学报, 2009(1):26-29.]
|
| [7] |
[ 杰弗里·帕克 . 刘从德, 译. 地缘政治学: 过去、现在和未来. 新华出版社, 2003.]
|
| [8] |
[ 爱德华·勒特韦克 . 褚律元, 译. 涡轮资本主义: 全球经济中的赢家与输家. 北京: 光明日报出版社, 2000: 169-170.]
|
| [9] |
|
| [10] |
[ 洪菊花, 骆华松 . 地缘政治与地缘经济之争及中国地缘战略方向. 经济地理, 2015,35(12):26-35.]
|
| [11] |
[ 杨文龙, 杜德斌, 马亚华 . 经济权力视角下中美战略均势的地理透视. 地理研究, 2017,36(10):87-100.]
|
| [12] |
[ 杨文龙, 杜德斌, 刘承良 , 等. 中国地缘经济联系的时空演化特征及其内部机制. 地理学报, 2016,71(6):956-969.]
|
| [13] |
|
| [14] |
|
| [15] |
Ministry of Commerce of the People's Republic of China, National Bureau of Statistics of the People's Republic of China, State Administration of Foreign Exchange. 2015 Statistical Bulletin of China's Outward Foreign Direct Investment. Beijing: China Statistics Press, 2016.
[ 中华人民共和国商务部, 中华人民共和国国家统计局, 国家外汇管理局. 2015年度中国对外直接投资统计公报. 北京: 中国统计出版社, 2016.]
|
| [16] |
[ 马腾, 葛岳静, 刘晓凤 , 等. 中美两国在南美洲的地缘经济格局比较. 经济地理, 2018,38(3):1-10.]
|
| [17] |
[ 贺灿飞, 刘洋 . 产业地理集聚与外商直接投资产业分布: 以北京市制造业为例. 地理学报, 2006,61(12):1259-1270.]
|
| [18] |
[ 符文颖, 吴艳芳 . 德国在华知识密集制造业投资进入方式的时空特征及区位影响因素. 地理学报, 2017,72(8):1361-1372.]
|
| [19] |
[ 杨文龙, 杜德斌, 游小珺 , 等. 世界跨国投资网络结构演化及复杂性研究. 地理科学, 2017,37(9):1300-1309.]
|
| [20] |
[ 湛泳, 曾松 . 中国对英国直接投资的影响因素研究. 经济地理, 2017,37(3):19-24.]
|
| [21] |
[ 王茂军, 徐永平 . 中国在美洲OFDI的基本特征与决定因素. 地理学报, 2017,72(8):1373-1391.]
|
| [22] |
[ 梁育填, 周政可, 刘逸 . 东南亚华人华侨网络与中国企业海外投资的区位选择关系研究. 地理学报, 2018,73(8):1449-1461.]
|
| [23] |
[ 刘镇, 邱志萍, 朱丽萌 . 海上丝绸之路沿线国家投资贸易便利化时空特征及对贸易的影响. 经济地理, 2018,38(3):11-20.]
|
| [24] |
[ 刘晓凤, 葛岳静, 赵亚博 . 国家距离与中国企业在“一带一路”投资区位选择. 经济地理, 2017,37(11):99-108.]
|
| [25] |
[ 方尹, 陈俊华, 代欢欢 . “一带一路”背景下海湾国家投资环境综合评价. 世界地理研究, 2018,27(2):36-44.]
|
| [26] |
[ 王文 . 政治地理与企业投资扩张: 中国的逻辑. 财经论丛, 2018,236(8):43-54.]
|
| [27] |
[ 赵可金 . 全球化时代的新地缘理论. 清华大学学报(哲学社会科学版), 2008,23(5):102-115.]
|
| [28] |
[ 蒋小荣, 杨永春, 汪胜兰 . 1985—2015年全球贸易网络格局的时空演化及对中国地缘战略的启示. 地理研究, 2018,37(3):495-511.]
|
| [29] |
[ 王铮, 韩钰, 胡敏 , 等. 地理本性进化与全球地缘政治经济基础探析. 地理学报, 2016,71(6):940-955.]
|
| [30] |
|
| [31] |
[ 毛汉英 . 中国周边地缘政治与地缘经济格局和对策. 地理科学进展, 2014,33(3):289-302.]
|
| [32] |
[ 席广亮, 甄峰, 张敏 , 等. 网络消费时空演变及区域联系特征研究: 以京东商城为例. 地理科学, 2015,35(11):1372-1380.]
|
| [33] |
[ 王惠文, 葛岳静, 马腾 . 地缘位势与中国: 中亚地缘关系初探. 经济地理, 2018,38(9):10-21.]
|
| [34] |
[ 张佑印, 马耀峰, 顾静 . 北京间接入境聚集旅游流流势时空演化规律研究. 旅游学刊, 2011,26(10):31-35.]
|
| [35] |
|
| [36] |
[ 孙立坚, 孙立行 . 对外开放和经济波动的关联性检验: 中国和东亚新兴市场国家的案例. 经济研究, 2005(6):69-81.]
|
| [37] |
[ 杜德斌, 马亚华 . 中国崛起的国际地缘战略研究. 世界地理研究, 2012,21(1):1-16.]
|
| [38] |
[ 康江江, 张凡, 宁越敏 . 苹果手机零部件全球价值链的价值分配与中国角色演变. 地理科学进展, 2019,38(3):395-406.]
|
| [39] |
|
/
| 〈 |
|
〉 |