
Urban heat island studies based on local climate zones: A systematic overview
Received date: 2019-11-27
Request revised date: 2020-06-07
Online published: 2020-11-25
Supported by
National Natural Science Foundation of China(41671420)
Jiangsu Provincial Natural Science Foundation for Outstanding Youth(BK20180009)
Jiangsu Provincial Graduate Student Innovation Project(KYCX19_0036)
Copyright
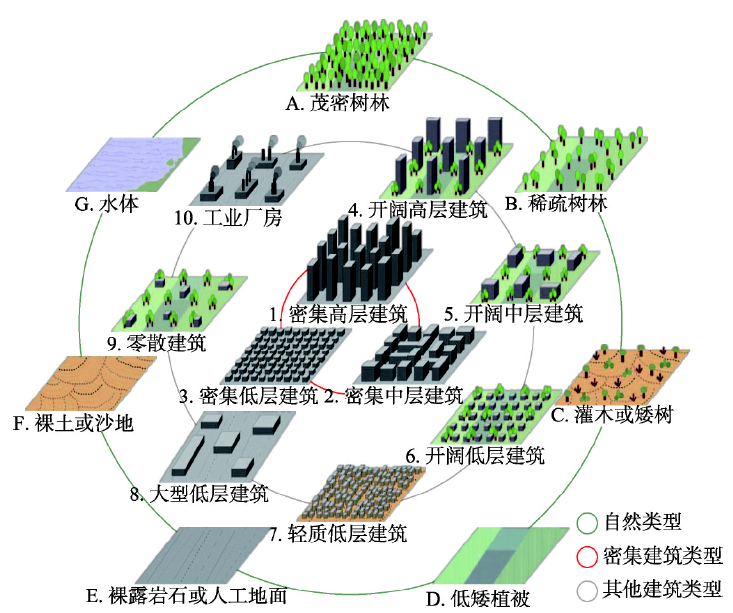
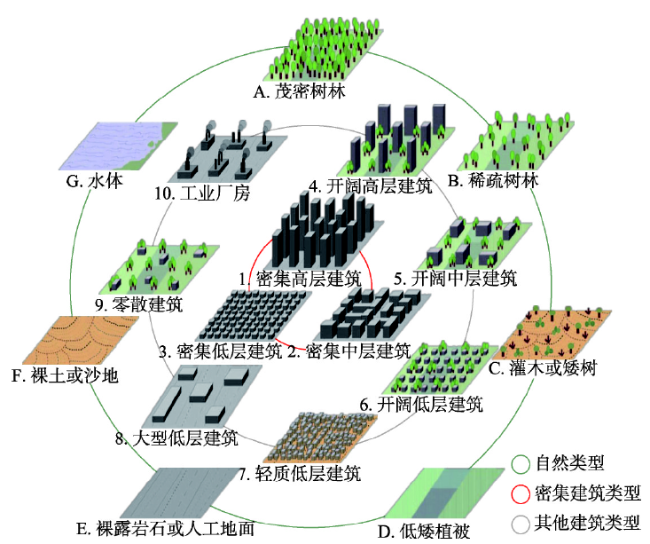
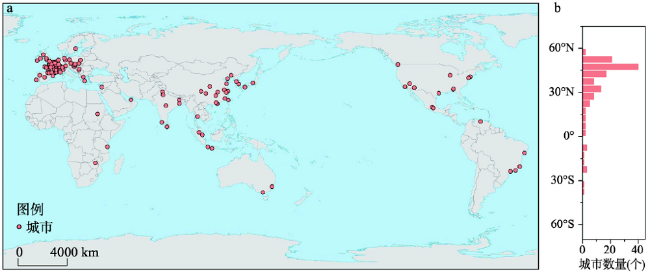
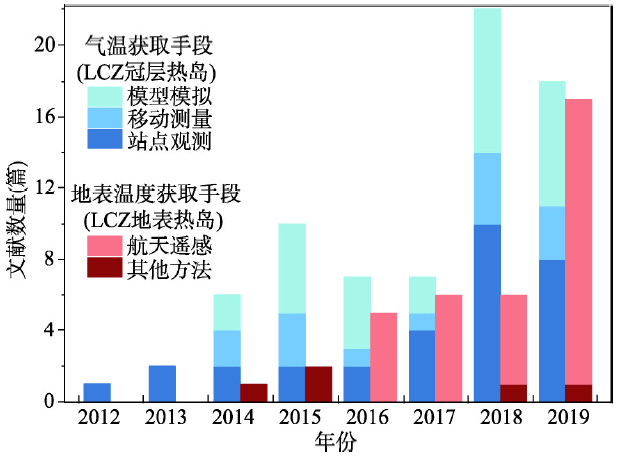
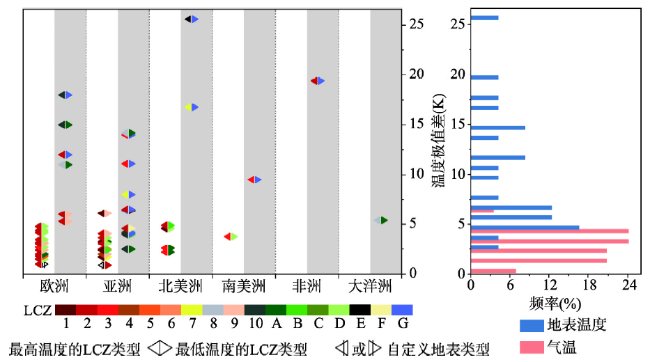
Since 2012, urban heat islands (UHIs) over various cities have been re-investigated under the local climate zones (LCZ) concept. However, a systematic overview of the recent progress in terms of the LCZ-based UHI studies remains lacking. This status quo has considerably restrained the UHI studies across global cities in a more standard manner. Here we comprehensively reviewed the preceding LCZ-based UHI studies with statistical- and meta-analysis. The literature review indicates that LCZ-based UHIs have been conducted over more than 130 cities globally, mostly located in the middle latitudes (35°N-55°N) within Asia and Europe. These investigations focus either on the canopy layer UHI (represented by surface air temperature, SAT) or on the surface layer UHI (denoted by land surface temperature, LST) or both. The overview was conducted mainly from three aspects including the "data acquisition", "spatiotemporal pattern", and "associated control". Our further findings show that: (1) On "data acquisition", satellite thermal remote sensing is the most important technique for retrieving LST, with the percentage of studies that employ this technique accounting for 86.5%. But for SAT, the main approaches include measurements by fixed stations (42.5%) and mobile vehicles (19.2%) as well as simulations by models (38.3%), among which the approach by model simulation has received more attention; (2) On "spatiotemporal pattern", the mean difference between the maximum and minimum temperatures among various LCZs for SAT (3.1 K) is significantly lower than that for LST (9.8 K), with relatively high magnitudes in summer and winter compared with the other seasons for these two types of temperatures.Prominent "intra-LCZ heat islands" were observed for both the canopy and surface UHIs; (3) On "associated controls", most studies are still qualitative on the analysis of the relationships between LCZ-based UHIs and their controls (e.g., surface structure and fabric, land cover type, and human activity). Other potential controls such as building typology and adjacency among LCZ types remain less considered. We finally provided several prospects for the LCZ-based UHI studies. We hope this overview would be helpful for improving the understanding of the current progress and upcoming prospects for the LCZ-based UHI studies.
JIANG Sida , ZHAN Wenfeng , YANG Jun , LIU Zihan , HUANG Fan , LAI Jiameng , LI Jiufeng , HONG Falu , HUANG Yuan , CHEN Jike , LEE Xuhui . Urban heat island studies based on local climate zones: A systematic overview[J]. Acta Geographica Sinica, 2020 , 75(9) : 1860 -1878 . DOI: 10.11821/dlxb202009004
图2 LCZ体系框架下开展热岛研究城市的全球分布(a)及纬度分布(b)注:该图基于自然资源部标准地图服务网站下载的审图号为GS(2016)1665号的标准地图制作,底图无修改。 Fig. 2 Global (a) and latitudinal (b) distributions of the cities where LCZ-based urban heat island has been investigated |
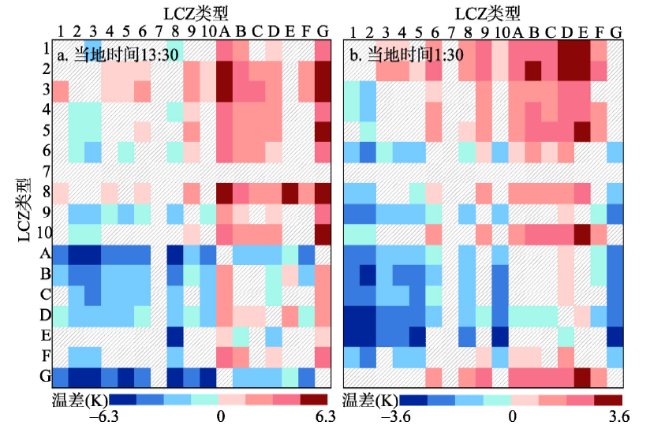
图5 由全球50座城市平均的LCZ类间地表温度差(行减去列)注:斜纹方块表示对应行列的LCZ地表温度没有显著差异(K-S检验中显著性水平为0.05),数据来自Bechtel[20]。 Fig. 5 Land surface temperature difference between LCZs for 50 cities (row value minus column value) (Twill squares indicate no significant differences (significance level is 0.05 in K-S test) and the source data are from Bechtel[20]). |
表1 不同城市LCZ气温极值情况(按大洲排列)Tab. 1 The extreme values of the surface air temperature among LCZ types over various cities (ranked by continent) |
| 城市(国家) | LCZ(Tmax) | LCZ(Tmin) | Tmax-Tmin(K) | 计算天数(d) | 背景气候* | 调查方法 | 数据源 |
|---|---|---|---|---|---|---|---|
| 安特卫普(比利时) | 2 | 9 | 3.2 | 20 | Cfb | 模型模拟 | 表1[72] |
| 布鲁塞尔(比利时) | 2 | 9 | 3.1 | 15 | Cfb | 模型模拟 | 表1[72] |
| 根特(比利时) | 2 | 9 | 2.0 | 16 | Cfb | 模型模拟 | 表1[72] |
| 奥洛穆茨(捷克) | 2 | 9 | 2.4 | 1 | Cfb | 移动测量 | 图3[73] |
| 柏林(德国) | 2 | D | 3.5 | - | Cfb | 站点观测 | 图7c[74] |
| 布拉干萨(葡萄牙) | 2 | RCD | 1.0 | 1460 | Csb | 站点观测 | 图4[75] |
| 第戎(法国) | 2 | 5 | 1.8 | 1 | Cfb | 站点观测 | 图10[76] |
| 南锡(法国) | 2 | D | 4.4 | 26 | Cfb | 移动测量 | 表1[77] |
| 都柏林(爱尔兰) | 2 | D | 4.2 | 3 | Cfb | 移动测量 | 图5[78] |
| 格拉斯哥(英国) | 3 | D | 2.7 | - | Cfb | 站点观测 | 图12[79] |
| 米兰(意大利) | 2 | D | 1.5 | 1 | Cfa | 站点观测 | 表5[80] |
| 诺维萨德(塞尔维亚) | 2 | A | 2.0 | 1095 | Cfb | 站点观测 | 图2[45] |
| 塞格德(匈牙利) | 2 | D | 4.8 | 12 | Cfb | 站点观测 | 图7[81] |
| 乌普萨拉(瑞典) | 2 | D | 4.2 | 9 | Dfb | 移动测量 | 图8[82] |
| 成都(中国) | 1 | BG | 2.4 | 3 | Cwa | 移动测量 | 表2[83] |
| 重庆(中国) | H | 2 | 0.9 | 2 | Cfa | 移动测量 | 图8[84] |
| 南京(中国) | 24 | D | 3.1 | 78 | Cfa | 站点观测 | 表3[85] |
| 台北(中国) | 1 | A | 3.3 | 1 | Cfa | 移动测量 | 图5[86] |
| 香港(中国) | 1 | 9 | 6.1 | 2 | Cwa | 移动测量 | 图7b[87] |
| 所有地区(新加坡) | 1 | 7 | 1.7 | 1 | Af | 模型模拟 | 表9[88] |
| 部分地区(新加坡) | 4 | 9 | 2.0 | 5 | Af | 站点观测 | 表2[89] |
| 长野(日本) | 24 | D | 3.7 | 9 | Cfa | 移动测量 | 图3[82] |
| 科钦(印度) | 2 | 9 | 4.1 | - | Am | 站点观测 | 图3[90] |
| 那格浦尔(印度) | 3 | 6 | 2.5 | 7 | Aw | 站点观测 | 表7[91] |
| 奥本(美国) | 3 | A | 2.6 | 7 | Cfa | 站点观测 | 表3[92] |
| 奥佩莱卡(美国) | 3 | A | 2.2 | 7 | Cfa | 站点观测 | 表2[92] |
| 温哥华(加拿大) | 1 | D | 4.6 | 4 | Csb | 移动测量 | 图7[82] |
| 克雷塔罗城(墨西哥) | 2 | B | 4.9 | - | Csa | 站点观测 | 图8[93] |
| 圣保罗(巴西) | 3 | D | 3.8 | 5 | Cfb | 移动测量 | 表3[94] |
注:H为作者定义的“河岸区域”类型;RCD为作者定义的“郊区”类型;24为LCZ 2内分布面积较小的LCZ 4;BG为LCZ B内分布面积较小的LCZ G;-表示文献中未提供详细数据;*表示根据柯本气候分类法划分气候类型;对于同一城市的多次研究,选取较全面的研究数据。 |
表2 不同城市LCZ地表温度极值情况(按大洲排列)Tab. 2 The extreme values of the land surface temperature among LCZ types over various cities (ranked by continent) |
| 城市(国家) | 数据 | LCZ(Tmax) | LCZ(Tmin) | Tmax-Tmin(K) | 计算天数(d) | 数据源 |
|---|---|---|---|---|---|---|
| 布拉格(捷克) | TIRS | 10 | A | 15.0* | 1 | 图7f[17] |
| 布尔诺(捷克) | TIRS | 10 | G | 18.0* | 1 | 图6e[17] |
| 第戎(法国) | TIRS | 8 | A | 11.0* | 1 | 图11d[76] |
| 日内瓦(瑞士) | TIRS | 2 | G | 12.0* | 1 | 图6[95] |
| 塞格德(匈牙利) | TIRS | 2 | 9 | 5.3* | 1 | 表3[96] |
| 塞格德(匈牙利) | 热红外成像仪 | 2 | 9 | 6.0* | 1 | 图5[16] |
| 重庆(中国) | TIRS | 10 | 4 | 4.6* | 1 | 图4a[97] |
| 福州(中国) | TIRS | 8 | A | 14.2 | 1 | 表3[98] |
| 杭州(中国) | ASTER | G | A | 6.4* | 2 | 图4[64] |
| 南京(中国) | TIRS | 3 | G | 11.1 | 3 | 图4[99] |
| 上海(中国) | ASTER | G | D | 6.5* | 1 | 图4[100] |
| 台北(中国) | TIRS | 7 | G | 8.0 | 1 | 图7[101] |
| 武汉(中国) | TIRS | 3 | G | 14.0* | 1 | 图4[102] |
| 珠江三角洲(中国) | MODIS | 2 | G | 6.5* | 4 | 图5e[103] |
| 昌迪加尔(印度) | TIRS | 10 | G | 4.2* | 1 | 图9[104] |
| 迪拜(阿联酋) | MODIS | 2 | F | 4.6* | - | 图14[105] |
| 曼谷(泰国) | TIRS | 10 | G | 4.1 | 3 | 图7[106] |
| 日惹(印度尼西亚) | TIRS | E | B | 4.0 | 1 | 表7[107] |
| 万隆(印度尼西亚) | TIRS | 10 | A | 2.5* | 1 | 图11[108] |
| 菲尼克斯(美国) | ASTER | E | G | 25.6 | 1 | 表6[109] |
| 拉斯维加斯(美国) | ASTER | 7 | G | 16.8 | 1 | 表6[109] |
| 圣保罗(巴西) | MODIS | 3 | G | 9.5* | - | 图6[110] |
| 哈拉雷(津巴布韦) | TIRS | 2 | G | 19.4 | 3 | 图4[111] |
| 悉尼(澳大利亚) | 热红外成像仪 | 8 | A | 5.4 | 2 | 图3[112] |
注:-表示文献中未提供详细数据;*表示从文献图表中读取的估算值;对于同一城市的多次研究,选取最新或最全面的研究数据。 |
| [1] |
|
| [2] |
[ 彭保发, 石忆邵, 王贺封, 等. 城市热岛效应的影响机理及其作用规律: 以上海市为例. 地理学报, 2013,68(11):1461-1471.]
|
| [3] |
|
| [4] |
|
| [5] |
|
| [6] |
[ 乔治, 黄宁钰, 徐新良, 等. 2003—2017年北京市地表热力景观时空分异特征及演变规律. 地理学报, 2019,74(3):475-489.]
|
| [7] |
|
| [8] |
[ 周淑贞, 郑景春. 上海城市太阳辐射与热岛强度. 地理学报, 1991,46(2):207-212.]
|
| [9] |
[ 谢志清, 杜银, 曾燕, 等. 长江三角洲城市带扩展对区域温度变化的影响. 地理学报, 2007,62(7):717-727.]
|
| [10] |
|
| [11] |
|
| [12] |
|
| [13] |
|
| [14] |
|
| [15] |
|
| [16] |
|
| [17] |
|
| [18] |
|
| [19] |
[ 金珊合, 张育庆, 杨俊. 城市局部气候分区对地表温度的影响: 以大连市区为例. 测绘通报, 2019(4):87-90.]
|
| [20] |
|
| [21] |
|
| [22] |
|
| [23] |
|
| [24] |
|
| [25] |
|
| [26] |
|
| [27] |
|
| [28] |
|
| [29] |
|
| [30] |
|
| [31] |
|
| [32] |
|
| [33] |
International Conference on Urban Climate (ICUC). 2018. https://ams.confex.com/ams/ICUC10/meetingapp.cgi/Home/0.
|
| [34] |
Passive and Low Energy Architecture (PLEA). 2018. http://www.plea2018.org.
|
| [35] |
Joint Urban Remote Sensing Events (JURSE). 2019. http://jurse2019.org/?page_id=455.
|
| [36] |
|
| [37] |
|
| [38] |
|
| [39] |
|
| [40] |
|
| [41] |
|
| [42] |
|
| [43] |
|
| [44] |
|
| [45] |
|
| [46] |
|
| [47] |
|
| [48] |
|
| [49] |
|
| [50] |
|
| [51] |
|
| [52] |
|
| [53] |
|
| [54] |
|
| [55] |
|
| [56] |
|
| [57] |
|
| [58] |
|
| [59] |
|
| [60] |
|
| [61] |
|
| [62] |
|
| [63] |
|
| [64] |
|
| [65] |
|
| [66] |
|
| [67] |
|
| [68] |
|
| [69] |
|
| [70] |
[ 杨小山, 姚灵烨, 金涛, 等. 南京夏季城市局地气温时空变化特征. 土木与环境工程学报, 2019,41(1):160-167.]
|
| [71] |
|
| [72] |
|
| [73] |
|
| [74] |
|
| [75] |
|
| [76] |
|
| [77] |
|
| [78] |
|
| [79] |
|
| [80] |
|
| [81] |
|
| [82] |
|
| [83] |
[ 黄媛, 刘敬, 陈方丽, 等. 基于局地气候分区理论的城市形态及其热岛量级研究. 新建筑, 2019(4):126-131.]
|
| [84] |
|
| [85] |
|
| [86] |
|
| [87] |
|
| [88] |
|
| [89] |
|
| [90] |
|
| [91] |
|
| [92] |
|
| [93] |
|
| [94] |
|
| [95] |
|
| [96] |
|
| [97] |
|
| [98] |
|
| [99] |
|
| [100] |
|
| [101] |
|
| [102] |
|
| [103] |
|
| [104] |
|
| [105] |
|
| [106] |
|
| [107] |
|
| [108] |
|
| [109] |
|
| [110] |
|
| [111] |
|
| [112] |
|
| [113] |
|
| [114] |
|
| [115] |
|
| [116] |
|
| [117] |
|
| [118] |
|
| [119] |
|
| [120] |
|
| [121] |
|
| [122] |
|
| [123] |
|
| [124] |
|
| [125] |
|
| [126] |
|
| [127] |
|
| [128] |
|
| [129] |
|
| [130] |
|
| [131] |
|
| [132] |
|
| [133] |
|
| [134] |
|
| [135] |
|
| [136] |
|
| [137] |
|
| [138] |
|
| [139] |
|
| [140] |
|
| [141] |
|
| [142] |
|
| [143] |
[ 黄媛, 刘静怡,
|
| [144] |
|
| [145] |
|
| [146] |
|
| [147] |
|
| [148] |
|
| [149] |
|
| [150] |
|
| [151] |
|
| [152] |
[ 岳亚飞, 詹庆明, 王炯. 城市热环境的规划改善策略研究: 以武汉市为例. 长江流域资源与环境, 2018,27(2):286-295.]
|
| [153] |
|
| [154] |
|
/
| 〈 |
|
〉 |