
Influencing mechanism of regional ageing in China based on the Structural Equation Model
Received date: 2019-02-03
Request revised date: 2020-05-24
Online published: 2020-10-25
Supported by
National Social Science Foundation of China(15BGL215)
Project for Creative Research Groups of Natural Science Foundation of Hubei Province(2016CFA027)
Fundamental Research Funds for the Central Universities(CCNU20TS034)
Copyright
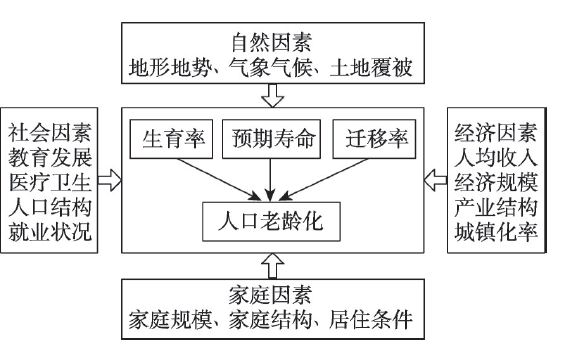
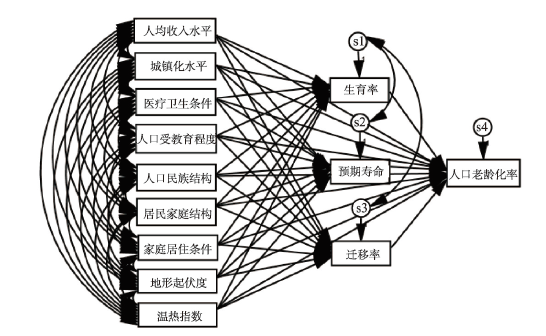
Since the 1970s, great progress has been made in research on the spatio-temporal pattern of population ageing at multiple spatial scales by both domestic and foreign scholars. However, the analysis of the process mechanism of regional ageing is still insufficient. Based on the county-scale data in 2000 and 2010 censuses, the spatio-temporal pattern of population ageing is statistically analyzed. Moreover, the Structural Equation Model (or SEM) is developed to explore the path relationship between various variables. Consequently, the influencing mechanism of regional ageing process is thoroughly revealed. The main results are as follows. Firstly, the line from Baotou City of Inner Mongolia autonomous region to Tengchong County of Yunnan province (or BT Line) is a geographical demarcation of regional ageing disparities in China. Southeast of the BT Line witnesses contiguous areas of higher ageing counties which interspersed with lower ageing counties, whereas northwest of the BT Line is a continuous area of lower ageing counties with just one middle-level ageing belt located in the north margin. Secondly, the fitting results of SEM interpret the influencing mechanism of regional ageing disparities in China. Thirdly, life expectancy, fertility and migration are three endogenous factors of regional ageing process. Thereinto, life expectancy has significantly positive effect, while fertility and migration have significantly negative effects on regional ageing. Lastly, geographical environment has significant direct and indirect effects on regional ageing in China. In general, the income increase, social progress, and the improvement of living conditions and natural environmental quality would enhance regional ageing level, otherwise the improvement of urbanization level would decrease regional ageing level.
AO Rongjun , CHANG Liang . Influencing mechanism of regional ageing in China based on the Structural Equation Model[J]. Acta Geographica Sinica, 2020 , 75(8) : 1572 -1584 . DOI: 10.11821/dlxb202008002
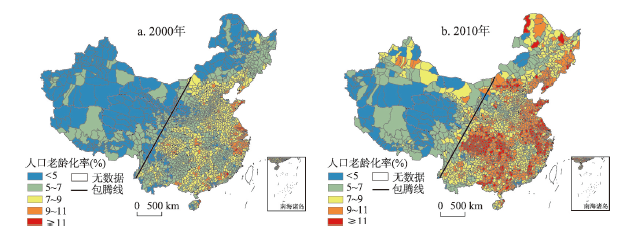
图2 2000年和2010年中国人口老龄化率的县域分布注:该图基于国家基础地理信息中心网站下载的审图号为GS(2016)1549的标准地图制作,底图无修改。 Fig. 2 Distribution of population ageing of China at county level in 2000 and 2010 |
表1 包腾线两侧区域老年人口集中度的比较Tab. 1 Comparison of concentration of the elderly population on both sides of Baotou-Tengchong Line in China |
| 指标 | 2000年 | 2010年 | |||
|---|---|---|---|---|---|
| 包腾线以西 | 包腾线以东 | 包腾线以西 | 包腾线以东 | ||
| 老龄化率7%及以上县区数(个) | 0 | 1032 | 96 | 1797 | |
| 老龄化率11%及以上县区数(个) | 0 | 27 | 1 | 350 | |
| 国土面积占比(%) | 48.30 | 51.70 | 48.30 | 51.70 | |
| 老年人口数量占比(%) | 2.92 | 97.08 | 3.55 | 96.45 | |
| 老年人口集中度 | 0.06 | 1.88 | 0.07 | 1.87 | |
注:老年人口集中度=老年人口占比/国土面积占比。 |
表2 结构方程模型的拟合优度检验Tab. 2 Goodness-of-fit-test for the SEM |
| 指标 | 统计量 | 适配标准或临界值 | 包腾线东部模型 | 包腾线西部模型 |
|---|---|---|---|---|
| 绝对适配度 指数 | 卡方值(CMIN) | P > 0.05,越小越好 | 2.423(P = 0.120) | 2.576(P = 0.108) |
| 卡方/自由度(CMIN/DF) | 0~3 | 2.423 | 2.576 | |
| 近似误差均方根(RMSEA) | < 0.05,越小越好 | 0.019 | 0.049 | |
| 拟合优度指数(GFI) | > 0.90,越接近于1 | 1.000 | 0.999 | |
| 调整的拟合优度指数(AGFI) | > 0.90,越接近于1 | 0.992 | 0.956 | |
| 增值适配度 指数 | 规范拟合指数(NFI) | > 0.90,越接近于1 | 1.000 | 0.999 |
| 增值指数(IFI) | > 0.90,越接近于1 | 1.000 | 0.999 | |
| 不规范拟合指数(TLI) | > 0.90,越接近于1 | 0.995 | 0.964 |
表3 县域人口老龄化影响因子的直接效应、间接效应和总体效应(包腾线东部模型)Tab. 3 Direct, indirect and total effects of influencing factors on regional ageing (Local model of east of B-T Line) |
| 影响因素 | 效应 | 生育率 | 预期寿命 | 净迁移率 | 老龄化率 |
|---|---|---|---|---|---|
| 生育率 | 总体 | - | - | - | -0.302* |
| 预期寿命 | 总体 | - | - | - | 0.371* |
| 迁移率 | 总体 | - | - | - | -0.616* |
| 人均收入水平 | 总体 | 0.062* | 0.147* | 0.157* | 0.022* |
| 直接 | 0.062* | 0.147* | 0.157* | 0.083* | |
| 间接 | - | - | - | -0.061* | |
| 城镇化水平 | 总体 | -0.375* | 0.146* | 0.404* | -0.137* |
| 直接 | -0.375* | 0.146* | 0.404* | -0.056* | |
| 间接 | - | - | - | -0.081* | |
| 医疗卫生条件 | 总体 | -0.083* | -0.009 | -0.150* | 0.136 |
| 直接 | -0.083* | -0.009 | -0.150* | 0.022 | |
| 间接 | - | - | - | 0.114 | |
| 人口受教育程度 | 总体 | -0.194* | 0.216* | 0.204* | 0.051** |
| 直接 | -0.194* | 0.216* | 0.204* | 0.038** | |
| 间接 | - | - | - | 0.013** | |
| 人口民族结构 | 总体 | 0.096* | -0.159* | -0.044** | -0.024* |
| 直接 | 0.096* | -0.159* | -0.044** | 0.037* | |
| 间接 | - | - | - | -0.060* | |
| 居民家庭结构 | 总体 | -0.012 | -0.010 | 0.094* | -0.065 |
| 直接 | -0.012 | -0.010 | 0.094* | -0.007 | |
| 间接 | - | - | - | -0.058 | |
| 家庭居住条件 | 总体 | -0.015 | 0.248* | -0.288* | 0.536* |
| 直接 | -0.015 | 0.248* | -0.288* | 0.262* | |
| 间接 | - | - | - | 0.274* | |
| 地形起伏度 | 总体 | 0.204* | -0.241* | 0.037** | -0.074* |
| 直接 | 0.204* | -0.241* | 0.037** | 0.100* | |
| 间接 | - | - | - | -0.174* | |
| 温热指数 | 总体 | -0.063* | 0.289* | -0.082* | -0.014* |
| 直接 | -0.063* | 0.289* | -0.082* | -0.191* | |
| 间接 | - | - | - | 0.177* |
注:数值均为标准化的回归系数估计值;*表示显著性水平为1%,**表示显著性水平为5%。 |
表4 县域人口老龄化影响因子的直接效应、间接效应和总体效应(包腾线西部模型)Tab. 4 Direct, indirect and total effects of influencing factors on regional ageing (Local model of west of B-T Line) |
| 影响因素 | 效应 | 生育率 | 预期寿命 | 净迁移率 | 老龄化率 |
|---|---|---|---|---|---|
| 生育率 | 总体 | - | - | - | 0.114** |
| 预期寿命 | 总体 | - | - | - | 0.440* |
| 迁移率 | 总体 | - | - | - | 0.027 |
| 人均收入水平 | 总体 | 0.004 | 0.192* | 0.027 | -0.010** |
| 直接 | 0.004 | 0.192* | 0.027 | -0.096** | |
| 间接 | - | - | - | 0.086** | |
| 城镇化水平 | 总体 | -0.485* | 0.217* | 0.003 | -0.052 |
| 直接 | -0.485* | 0.217* | 0.003 | -0.092 | |
| 间接 | - | - | - | 0.040 | |
| 医疗卫生条件 | 总体 | -0.001 | 0.057 | 0.085 | 0.005 |
| 直接 | -0.001 | 0.057 | 0.085 | -0.022 | |
| 间接 | - | - | - | 0.027 | |
| 居民家庭结构 | 总体 | 0.103** | -0.014 | 0.116** | -0.063 |
| 直接 | 0.103** | -0.014 | 0.116** | -0.071 | |
| 间接 | - | - | - | 0.009 | |
| 家庭居住条件 | 总体 | -0.178* | 0.306* | 0.016 | 0.361* |
| 直接 | -0.178* | 0.306* | 0.016 | 0.246* | |
| 间接 | - | - | - | 0.115* | |
| 温热指数 | 总体 | -0.298* | -0.156* | -0.032 | -0.045 |
| 直接 | -0.298* | -0.156* | -0.032 | 0.059 | |
| 间接 | - | - | - | -0.104 |
注:数值均为标准化的回归系数估计值;*表示显著性水平为1%,**表示显著性水平为5%。 |
| [1] |
WHO. World Report on Ageing and Health. Geneva: World Health Organization, 2015.
|
| [2] |
|
| [3] |
|
| [4] |
|
| [5] |
|
| [6] |
[ 高晓路, 吴丹贤, 许泽宁, 等. 中国老龄化地理学综述和研究框架构建. 地理科学进展, 2015,34(12):1480-1494.]
|
| [7] |
|
| [8] |
|
| [9] |
|
| [10] |
|
| [11] |
|
| [12] |
|
| [13] |
|
| [14] |
|
| [15] |
|
| [16] |
|
| [17] |
|
| [18] |
[ 李日邦, 王五一, 谭见安, 等. 我国人口老龄化发展的阶段、趋势和区域差异. 地理研究, 1999,18(2):113-121.]
|
| [19] |
[ 袁俊, 吴殿廷, 吴铮争. 中国农村人口老龄化的空间差异及其影响因素分析. 中国人口科学, 2007(3):41-47.]
|
| [20] |
[ 赵儒煜, 刘畅, 张锋. 中国人口老龄化区域溢出与分布差异的空间计量经济学研究. 人口研究, 2012,36(2):71-81.]
|
| [21] |
[ 陈明华, 郝国彩. 中国人口老龄化地区差异分解及影响因素研究. 中国人口·资源与环境, 2014,24(4):136-141.]
|
| [22] |
[ 赵东霞, 韩增林, 王利. 中国老年人口分布的集疏格局及其形成机制. 地理学报, 2017,72(10):1762-1775.]
|
| [23] |
[ 林琳, 马飞. 广州市人口老龄化的空间分布及趋势. 地理研究, 2007,26(5):1043-1054.]
|
| [24] |
[ 李杨, 刘慧君, 金凤君, 等. 北京市人口老龄化的时空变化特征. 中国人口·资源与环境, 2011,21(11):131-138.]
|
| [25] |
[ 张开洲, 陈楠. 1990—2010年福建省县域人口老龄化时空演变特征及其驱动机制. 地理科学进展, 2014,33(5):605-615.]
|
| [26] |
[ 康江江, 丁志伟, 张改素, 等. 中原地区人口老龄化的多尺度时空格局. 经济地理, 2016,36(4):29-37.]
|
| [27] |
[ 王录仓, 武荣伟. 中国人口老龄化时空变化及成因探析: 基于县域尺度的考察. 中国人口科学, 2016(4):74-84.]
|
| [28] |
[ 王录仓, 武荣伟, 刘海猛, 等. 县域尺度下中国人口老龄化的空间格局与区域差异. 地理科学进展, 2016,35(8):921-931.]
|
| [29] |
[ 于涛方. 中国城市老龄化空间特征及相关因素分析. 城市规划学刊, 2013(6):58-66.]
|
| [30] |
[ 王录仓, 武荣伟, 李巍. 中国城市群人口老龄化时空格局. 地理学报, 2017,72(6):1001-1016.]
|
| [31] |
[ 易成栋, 张纯, 吴淑萍, 等. 2000—2010年北京市老年人口空间分布及其变动研究. 城市发展研究, 2014,21(2):66-71.]
|
| [32] |
|
| [33] |
[ 许昕, 赵媛, 郭爱妹. 基于街道尺度的南京市老年人口空间分布演变研究. 人文地理, 2016,31(6):88-94, 129.]
|
| [34] |
|
| [35] |
[ 周春山, 童新梅, 王珏晗, 等. 2000—2010年广州市人口老龄化空间分异及形成机制. 地理研究, 2018,37(1):103-118.]
|
| [36] |
[ 王新贤, 高向东, 陶树果. 上海市人口老龄化的空间分布及演化特征研究. 上海经济研究, 2016(8):120-129.]
|
| [37] |
WHO. China Country Assessment Report on Ageing and Health. Geneva: World Health Organization, 2015.
|
| [38] |
[ 王劲峰, 徐成东. 地理探测器: 原理与展望. 地理学报, 2017,72(1):116-134.]
|
| [39] |
[ 张文佳, 柴彦威. 基于家庭的城市居民出行需求理论与验证模型. 地理学报, 2008,63(12):1246-1256.]
|
| [40] |
[ 曹小曙, 林强. 基于结构方程模型的广州城市社区居民出行行为. 地理学报, 2011,66(2):167-177.]
|
| [41] |
[ 封志明, 唐焰, 杨艳昭, 等. 中国地形起伏度及其与人口分布的相关性. 地理学报, 2007,62(10):1073-1082.]
|
| [42] |
[ 唐焰, 封志明, 杨艳昭. 基于栅格尺度的中国人居环境气候适宜性评价. 资源科学, 2008,30(5):648-653.]
|
| [43] |
[ 封志明, 唐焰, 杨艳昭, 等. 基于GIS的中国人居环境指数模型的建立与应用. 地理学报, 2008,63(12):1327-1336.]
|
/
| 〈 |
|
〉 |
