
Contribution of climatic change and human activities to vegetation NDVI change over China during 1982-2015
Received date: 2019-09-18
Request revised date: 2020-03-03
Online published: 2020-07-25
Supported by
National Key R&D Program of China(2016YFC0501707)
External Cooperation Program of BIC, Chinese Academy of Sciences(16146KYSB20150001)
National Natural Science Foundation of China(41771558)
Copyright
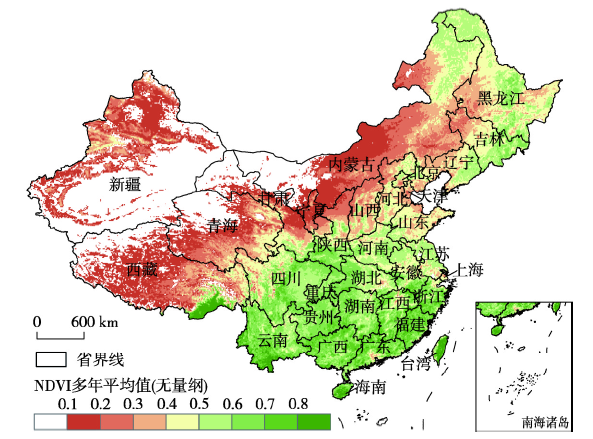
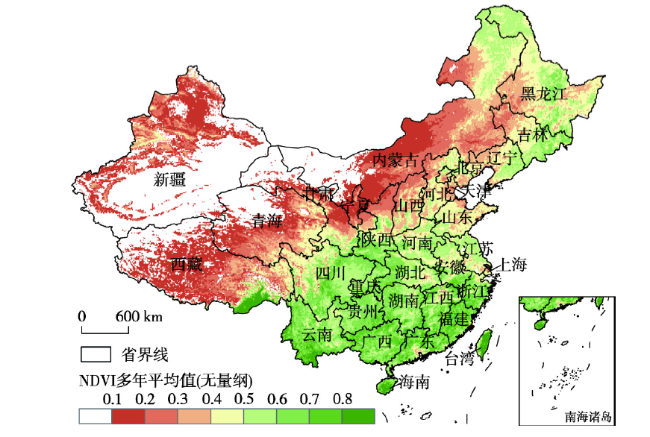
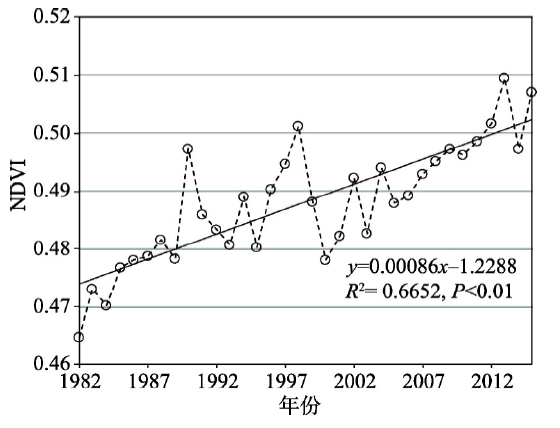
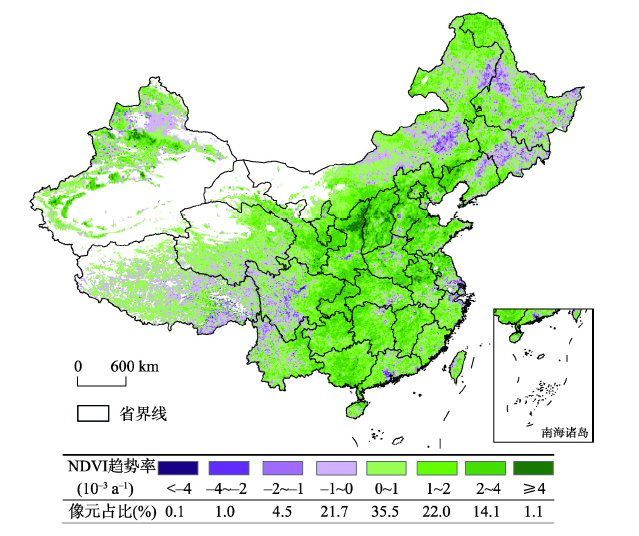
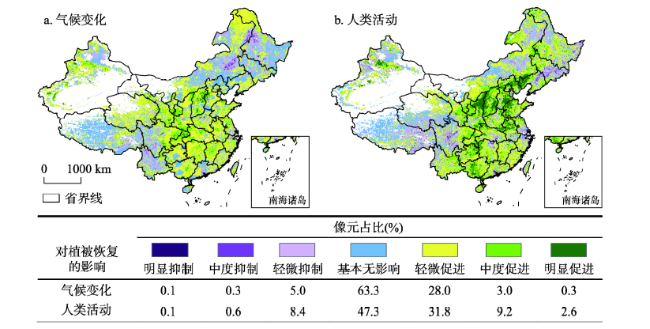
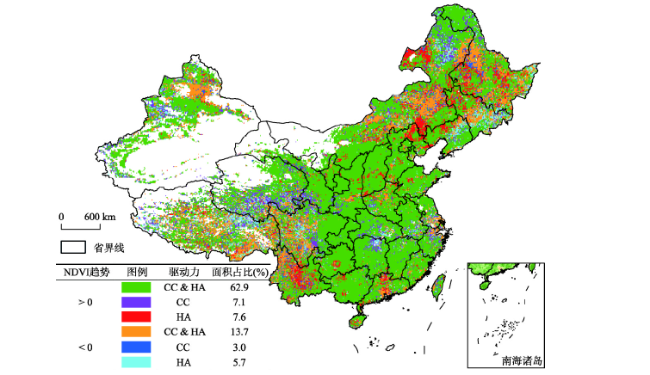
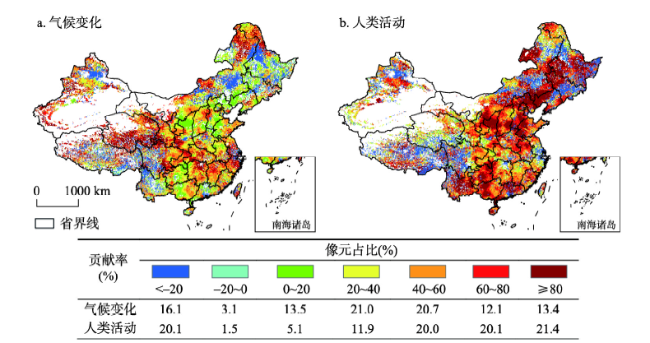
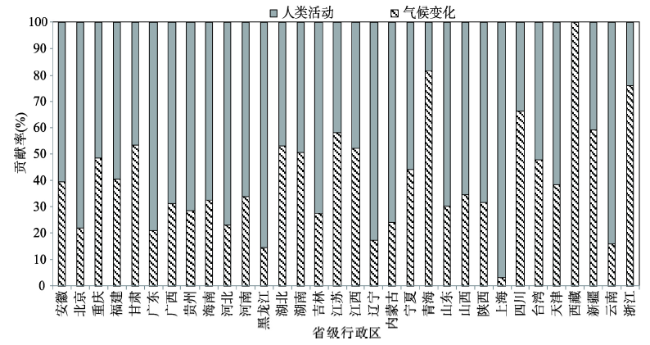
Based on the observed daily temperature and precipitation of the land surface of 603 meteorological stations in China, the Global Inventory Modeling and Mapping Studies (GIMMS) Normalized Difference Vegetation Index (NDVI) 3rd generation dataset, the changing patterns of NDVI in China during 1982-2015 were investigated and the corresponding contributions of the main driving forces, climatic change and human activities, to these changes were distinguished using the methods of trend analysis and multiple regression residuals analysis. The results showed that vegetation recovered in whole China in research period significantly. Shanghai was the single case with a decrease in growing season NDVI in the selected 32 provincial-level administrative regions, while the growing season NDVI in Shanxi, Shaanxi, and Chongqing increased much faster compared with other regions. The climatic change and human activities drove the NDVI change jointly as main forces in China and induced both a rapid increasing trend on the whole and a huge spatial difference. The impacts of climatic change on NDVI change in the growing-season ranged from -0.01×10 -3 a -1 to 1.05×10 -3 a -1, while the impacts of human activities changed from -0.32×10 -3 a -1 to 1.77×10 -3 a -1. The contributions of climatic change and human activities accounted for 40% and 60%, respectively, to the increase of NDVI in China in the past 34 years. The regions where the contribution rates of human activities were more than 80% were mainly distributed in the central part of the Loess Plateau, the North China Plain, and the northeast and the southwest of China. There were 22 provincial-level regions where the contributions of human activities were more than 50%, and the shares of contribution induced by human activities in Shanghai, Heilongjiang, and Yunnan were much greater than those of any other regions. The results suggest that we should focus more on the role of human activities in vegetation restoration in the whole country.
Key words: vegetation variation; climatic change; human activities; NDVI; residuals analysis; China
JIN Kai , WANG Fei , HAN Jianqiao , SHI Shangyu , DING Wenbin . Contribution of climatic change and human activities to vegetation NDVI change over China during 1982-2015[J]. Acta Geographica Sinica, 2020 , 75(5) : 961 -974 . DOI: 10.11821/dlxb202005006
表1 气候变化和人类活动对植被恢复的影响分级(10-3 a-1)Tab. 1 Classification of the impacts of climatic change and human activities on vegetation restoration (10-3 a-1) |
| slope(NDVI)a | 影响程度 |
|---|---|
| < -2.0 | 明显抑制 |
| -2.0~-1.0 | 中度抑制 |
| -1.0~-0.2 | 轻微抑制 |
| -0.2~0.2 | 基本无影响 |
| 0.2~1.0 | 轻微促进 |
| 1.0~2.0 | 中度促进 |
| ≥ 2.0 | 明显促进 |
注:a在气候变化或人类活动影响下的生长季NDVI变化趋势,即slope(NDVICC)或slope(NDVIHA)。 |
表2 植被NDVI变化的驱动因素判定标准及贡献率计算方法Tab. 2 Identification criterion and contribution calculation of the drivers of NDVI change |
| slope(NDVIobs)a | 驱动因素 | 驱动因素的划分标准 | 驱动因素的贡献率(%) | ||
|---|---|---|---|---|---|
| slope(NDVICC)b | slope(NDVIHA)c | 气候变化 | 人类活动 | ||
| > 0 | CC & HA | > 0 | > 0 | ||
| CC | > 0 | < 0 | 100 | 0 | |
| HA | < 0 | > 0 | 0 | 100 | |
| < 0 | CC & HA | < 0 | < 0 | ||
| CC | < 0 | > 0 | 100 | 0 | |
| HA | > 0 | < 0 | 0 | 100 | |
注:a、b和c分别指基于遥感数据的生长季NDVI观测值的趋势率、基于二元回归分析的生长季NDVI预测值的趋势率以及生长季NDVI残差的趋势率。其中,b和c分别用于表示在气候变化和人类活动影响下的生长季NDVI变化趋势。 |
表3 1982—2015年中国32个省级行政区生长季NDVI平均变化趋势及其驱动因素的影响(10-3 a-1)Tab. 3 Average trends of growing season NDVI and the impacts of drivers of NDVI change during 1982-2015 in the 32 provincial-level administrative regions of China (10-3 a-1) |
| 地区 | slope (NDVIobs)a | 对植被恢复的作用 | 驱动力 | 地区 | slope(NDVIobs)a | 对植被恢复的作用 | 驱动力 | |||
|---|---|---|---|---|---|---|---|---|---|---|
| CCb | HAc | CCb | HAc | |||||||
| 上海 | -0.33 | 基本无影响 | 轻微抑制 | CC & HA | 海南 | 1.18 | 轻微促进 | 轻微促进 | CC & HA | |
| 西藏 | 0.04 | 基本无影响 | 基本无影响 | CC | 甘肃 | 1.39 | 轻微促进 | 轻微促进 | CC & HA | |
| 吉林 | 0.26 | 基本无影响 | 基本无影响 | CC & HA | 河南 | 1.41 | 轻微促进 | 轻微促进 | CC & HA | |
| 黑龙江 | 0.44 | 基本无影响 | 轻微促进 | CC & HA | 湖北 | 1.42 | 轻微促进 | 轻微促进 | CC & HA | |
| 青海 | 0.47 | 轻微促进 | 基本无影响 | CC & HA | 湖南 | 1.43 | 轻微促进 | 轻微促进 | CC & HA | |
| 四川 | 0.51 | 轻微促进 | 基本无影响 | CC & HA | 江西 | 1.46 | 轻微促进 | 轻微促进 | CC & HA | |
| 内蒙古 | 0.55 | 基本无影响 | 轻微促进 | CC & HA | 贵州 | 1.54 | 轻微促进 | 中度促进 | CC & HA | |
| 云南 | 0.64 | 基本无影响 | 轻微促进 | CC & HA | 宁夏 | 1.55 | 轻微促进 | 轻微促进 | CC & HA | |
| 浙江 | 0.68 | 轻微促进 | 基本无影响 | CC & HA | 安徽 | 1.58 | 轻微促进 | 轻微促进 | CC & HA | |
| 新疆 | 0.7 | 轻微促进 | 轻微促进 | CC & HA | 广西 | 1.62 | 轻微促进 | 中度促进 | CC & HA | |
| 台湾 | 0.83 | 轻微促进 | 轻微促进 | CC & HA | 北京 | 1.7 | 轻微促进 | 中度促进 | CC & HA | |
| 天津 | 0.85 | 轻微促进 | 轻微促进 | CC & HA | 山东 | 1.74 | 轻微促进 | 中度促进 | CC & HA | |
| 广东 | 0.9 | 基本无影响 | 轻微促进 | CC & HA | 河北 | 1.78 | 轻微促进 | 中度促进 | CC & HA | |
| 福建 | 0.91 | 轻微促进 | 轻微促进 | CC & HA | 重庆 | 2.16 | 中度促进 | 中度促进 | CC & HA | |
| 江苏 | 1 | 轻微促进 | 轻微促进 | CC & HA | 陕西 | 2.24 | 轻微促进 | 中度促进 | CC & HA | |
| 辽宁 | 1.1 | 基本无影响 | 轻微促进 | CC & HA | 山西 | 2.71 | 轻微促进 | 中度促进 | CC & HA | |
注:a生长季NDVI观测值的变化趋势;b和c分别指气候变化和人类活动。 |
| [1] |
IPCC. Summary for policymakers//Climate Change 2013: The Physical Science Basis. Contribution of Working Group I to the Fifth Assessment Report of the Intergovernmental Panel on Climate Change. Cambridge, United Kingdom and New York, USA: Cambridge University Press, 2013.
|
| [2] |
[ 孙红雨, 王长耀, 牛铮 , 等. 中国地表植被覆盖变化及其与气候因子关系: 基于NOAA时间序列数据分析. 遥感学报, 1998,2(3):204-210.]
|
| [3] |
|
| [4] |
|
| [5] |
|
| [6] |
|
| [7] |
[ 杨雪梅, 杨太保, 刘海猛 , 等. 气候变暖背景下近30a北半球植被变化研究综述. 干旱区研究, 2016,33(2):379-391.]
|
| [8] |
|
| [9] |
|
| [10] |
|
| [11] |
|
| [12] |
|
| [13] |
|
| [14] |
|
| [15] |
|
| [16] |
|
| [17] |
|
| [18] |
[ 成方妍, 刘世梁, 尹艺洁 , 等. 基于MODIS NDVI的广西沿海植被动态及其主要驱动因素. 生态学报, 2017,37(3):788-797.]
|
| [19] |
|
| [20] |
|
| [21] |
|
| [22] |
|
| [23] |
|
| [24] |
[ 张春森, 胡艳, 史晓亮 . 基于AVHRR和MODIS NDVI数据的黄土高原植被覆盖时空演变分析. 应用科学学报, 2016,34(6):702-712.]
|
| [25] |
|
| [26] |
[ 张月丛, 赵志强, 李双成 , 等. 基于SPOT NDVI的华北北部地表植被覆盖变化趋势. 地理研究, 2008,27(4):745-754.]
|
| [27] |
|
| [28] |
[ 邓晨晖, 白红英, 高山 , 等. 秦岭植被覆盖时空变化及其对气候变化与人类活动的双重响应. 自然资源学报, 2018,33(3):425-438.]
|
| [29] |
[ 郑景云, 卞娟娟, 葛全胜 , 等. 1981—2010年中国气候区划. 科学通报, 2013,58(30):3088-3099.]
|
| [30] |
|
| [31] |
|
| [32] |
[ 杜加强, 舒俭民, 赵晨曦 , 等. 两代AVHRR GIMMS NDVI 数据集的对比分析: 以新疆地区为例. 生态学报, 2016,36(21):6738-6749.]
|
| [33] |
[ 金凯 . 中国植被覆盖时空变化及其与气候和人类活动的关系[D]. 杨凌: 西北农林科技大学, 2019.]
|
| [34] |
|
| [35] |
[ 宋富强, 康慕谊, 杨朋 , 等. 陕北地区GIMMS、SPOT-VGT和MODIS归一化植被指数的差异分析. 北京林业大学学报, 2010,32(4):72-80.]
|
| [36] |
[ 方精云, 朴世龙, 贺金生 , 等. 近20年来中国植被活动在增强. 中国科学(C辑), 2003,33(6):554-565.]
|
| [37] |
[ 赵杰, 杜自强, 武志涛 , 等. 中国温带昼夜增温的季节性变化及其对植被动态的影响. 地理学报, 2018,73(3):395-404.]
|
| [38] |
|
| [39] |
|
| [40] |
[ 李净, 刘红兵, 李彩云 , 等. 基于GIMMS 3g NDVI 的近30年中国北部植被生长季始期变化研究. 地理科学, 2017,37(4):620-629.]
|
| [41] |
|
| [42] |
[ 安佑志 . 基于遥感的中国北部植被NDVI和物候变化研究[D]. 上海: 华东师范大学, 2014.]
|
| [43] |
[ 谢宝妮 . 黄土高原近30年植被覆盖变化及其对气候变化的响应[D]. 杨凌: 西北农林科技大学, 2016.]
|
| [44] |
[ 张倩 . 气候和人类因素在黄土高原植被覆盖变化中的贡献率研究[D]. 兰州: 兰州交通大学, 2014.]
|
| [45] |
|
| [46] |
[ 张宝庆, 吴普特, 赵西宁 . 近30a黄土高原植被覆盖时空演变监测与分析. 农业工程学报, 2011,27(4):287-293.]
|
| [47] |
[ 田海静 . 非气候因素引起的中国植被变化遥感诊断: 以林业工程为例[D]. 北京: 中国科学院遥感与数字地球研究所, 2017.]
|
| [48] |
|
/
| 〈 |
|
〉 |