
The relationship between urban spatial growth and population density change
Received date: 2018-12-05
Request revised date: 2019-12-20
Online published: 2020-06-25
Supported by
National Natural Science Foundation of China(41971368)
National Key Research and Development Program of China(2017YFA0604404)
Open Fund of Key Laboratory of Urban Land Resources Monitoring and Simulation, Ministry of Natural Resources(KF-2019-04-036)
Copyright
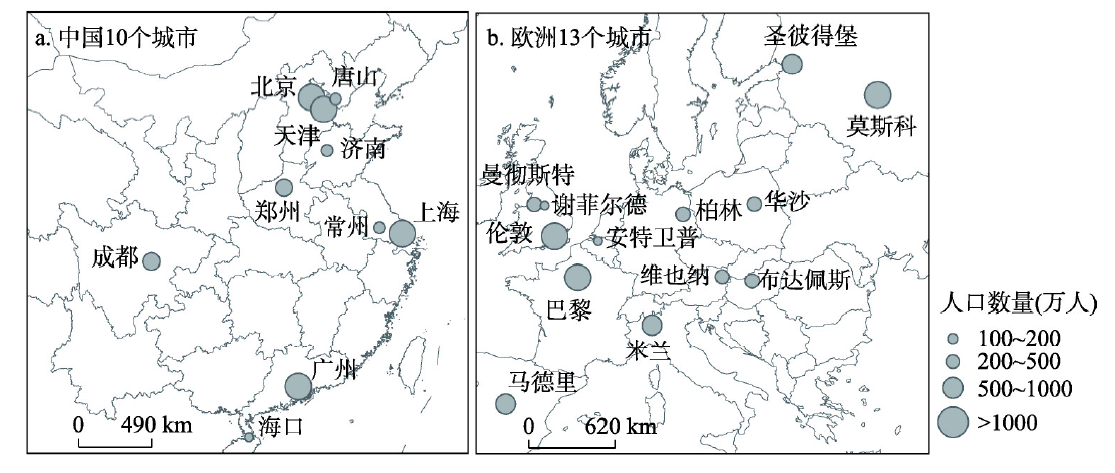
Exploring the relationship between urban spatial growth and population density change is the basis of urban sustainable development research, which is of great significance for formulating effective land policies to promote urban compact development. The research selected 23 cities with a population of more than 1 million in China and Europe as the study areas. Based on the land use and population data in the study areas in 1990, 2000, and 2014, the research calculated the growth rate of sample urban space during each period, and the urban compactness index was then established to divide the urban spatial growth mode into compact type, maintenance type and spread type. The characteristics of spatial growth, population density change, and their relationship were further discussed. The results are as follows: (1) Population density decline is widespread in cities of China and Europe. Population density in cities of China is relatively high, and the rate of decline is fast, whereas population density in cities of Europe is relatively low and the rate of decline is slow. From 1990 to 2014, the growth rate of urban spatial radius in China was significantly higher than that in Europe. There is a strong negative correlation between the growth rate of urban space and the change rate of population density (with a Pearson's r of -0.693). (2) From 1990 to 2000, most of the sample cities' spatial growth mode were compact. From 2000 to 2014, most Chinese cities' spatial growth mode transformed into spread type and rate of population density decline increased. By contrast, European cities' spatial growth mode maintained to be compact or transformed into maintenance, and the rate of population density decline decreased. (3) Compact spatial growth does not necessarily lead to an increase in population density, but it tends to lower the rate of population density decline, relative to spread spatial growth. The comparative analysis of Chinese and European cities shows that if cities maintain a compact spatial growth mode, the rate of population density will be lowered. If cities' spatial growth mode transforms from compact to spread, it will intensify the decline of urban population density over time.
Key words: urban spatial growth; population density; inverse S-shaped function; China; Europe
ZHAO Rui , JIAO Limin , XU Gang , XU Zhibang , DONG Ting . The relationship between urban spatial growth and population density change[J]. Acta Geographica Sinica, 2020 , 75(4) : 695 -707 . DOI: 10.11821/dlxb202004003
表1 反S函数拟合参数Tab. 1 The parameters of fitted inverse S-shaped functions in 23 sample cities |
| 城市 | 1990年 | 2000年 | 2014年 | |||||||||||
|---|---|---|---|---|---|---|---|---|---|---|---|---|---|---|
| ɑ | c | D | R2 | ɑ | c | D | R2 | ɑ | c | D | R2 | |||
| 北京 | 4.578 | 0.116 | 25.98 | 0.995 | 5.336 | 0.152 | 29.06 | 0.994 | 4.663 | 0.259 | 35.55 | 0.988 | ||
| 上海 | 1.791 | 0.117 | 25.17 | 0.966 | 2.784 | 0.111 | 44.57 | 0.984 | 4.259 | 0.086 | 64.51 | 0.990 | ||
| 广州 | 1.561 | 0.047 | 8.51 | 0.980 | 1.512 | 0.133 | 22.14 | 0.956 | 1.453 | 0.248 | 30.43 | 0.965 | ||
| 天津 | 3.828 | 0.067 | 15.59 | 0.995 | 3.850 | 0.076 | 16.93 | 0.994 | 3.554 | 0.247 | 23.82 | 0.990 | ||
| 成都 | 3.403 | 0.022 | 11.70 | 0.996 | 5.615 | 0.080 | 18.58 | 0.995 | 3.922 | 0.159 | 29.78 | 0.976 | ||
| 常州 | 4.191 | 0.047 | 7.49 | 0.999 | 5.039 | 0.134 | 13.13 | 0.997 | 4.708 | 0.261 | 18.05 | 0.995 | ||
| 郑州 | 4.202 | 0.087 | 12.14 | 0.995 | 5.965 | 0.134 | 15.26 | 0.996 | 4.263 | 0.172 | 27.25 | 0.991 | ||
| 济南 | 3.852 | 0.101 | 13.56 | 0.993 | 3.760 | 0.126 | 15.36 | 0.992 | 3.465 | 0.171 | 19.15 | 0.994 | ||
| 唐山 | 2.613 | 0.113 | 8.00 | 0.979 | 3.115 | 0.148 | 9.42 | 0.976 | 2.737 | 0.259 | 12.18 | 0.967 | ||
| 海口 | 1.935 | 0.041 | 5.10 | 0.970 | 2.344 | -0.181 | 9.06 | 0.965 | 3.236 | -1.015 | 18.19 | 0.956 | ||
| 伦敦 | 2.652 | 0.047 | 35.22 | 0.983 | 2.996 | 0.092 | 37.29 | 0.984 | 3.319 | 0.113 | 38.25 | 0.986 | ||
| 巴黎 | 2.980 | 0.091 | 33.89 | 0.989 | 3.880 | 0.157 | 36.29 | 0.991 | 4.436 | 0.246 | 37.92 | 0.990 | ||
| 柏林 | 2.190 | 0.053 | 14.78 | 0.996 | 2.571 | 0.041 | 20.85 | 0.998 | 2.716 | 0.098 | 22.76 | 0.997 | ||
| 莫斯科 | 2.231 | 0.124 | 24.32 | 0.987 | 2.631 | 0.172 | 28.20 | 0.987 | 2.537 | 0.212 | 30.04 | 0.981 | ||
| 马德里 | 3.395 | 0.070 | 12.93 | 0.989 | 3.161 | 0.094 | 14.89 | 0.988 | 3.057 | 0.134 | 18.27 | 0.985 | ||
| 维也纳 | 2.742 | 0.054 | 12.95 | 0.997 | 3.105 | 0.069 | 16.39 | 0.998 | 3.403 | 0.088 | 17.41 | 0.997 | ||
| 米兰 | 2.851 | 0.155 | 14.19 | 0.957 | 2.846 | 0.202 | 15.52 | 0.956 | 2.854 | 0.279 | 19.28 | 0.955 | ||
| 华沙 | 1.950 | 0.055 | 12.38 | 0.978 | 2.408 | 0.081 | 15.13 | 0.983 | 2.662 | 0.125 | 17.89 | 0.981 | ||
| 圣彼得堡 | 3.513 | 0.083 | 21.38 | 0.987 | 3.623 | 0.122 | 22.01 | 0.985 | 3.658 | 0.149 | 24.34 | 0.987 | ||
| 布达佩斯 | 3.218 | 0.098 | 15.74 | 0.983 | 3.266 | 0.116 | 16.01 | 0.981 | 3.334 | 0.183 | 17.82 | 0.971 | ||
| 曼彻斯特 | 2.092 | 0.004 | 19.92 | 0.973 | 2.205 | 0.033 | 21.41 | 0.975 | 2.248 | 0.017 | 22.20 | 0.975 | ||
| 谢菲尔德 | 2.551 | 0.067 | 10.30 | 0.987 | 2.733 | 0.078 | 10.80 | 0.986 | 2.749 | 0.081 | 10.91 | 0.987 | ||
| 安特卫普 | 1.944 | 0.106 | 10.39 | 0.974 | 1.953 | 0.151 | 10.14 | 0.971 | 2.102 | 0.191 | 10.28 | 0.968 | ||
| [1] |
|
| [2] |
|
| [3] |
|
| [4] |
[ 周春山, 叶昌东 . 中国特大城市空间增长特征及其原因分析. 地理学报, 2013,68(6):728-738.]
|
| [5] |
[ 张新生, 何建邦 . 城市空间增长与格局变化的预测. 地理学与国土研究, 1996(3):13-16.]
|
| [6] |
[ 罗小龙, 沈建法 . 跨界的城市增长: 以江阴经济开发区靖江园区为例. 地理学报, 2006,61(4):435-445.]
|
| [7] |
[ 马荣华, 顾朝林, 蒲英霞 , 等. 苏南沿江城镇扩展的空间模式及其测度. 地理学报, 2007,62(10):1011-1022.]
|
| [8] |
[ 冯健 . 杭州城市形态和土地利用结构的时空演化. 地理学报, 2003,58(3):343-353.]
|
| [9] |
[ 顾朝林, 陈振光 . 中国大都市空间增长形态. 城市规划, 1994(6):45-50.]
|
| [10] |
[ 王新生, 刘纪远, 庄大方 , 等. 中国特大城市空间形态变化的时空特征. 地理学报, 2005,60(3):392-400.]
|
| [11] |
[ 张豫芳, 杨德刚, 张小雷 , 等. 天山北坡绿洲城市空间形态时空特征分析. 地理科学进展, 2006,25(6):138-147.]
|
| [12] |
[ 潘竟虎, 戴维丽 . 1990—2010年中国主要城市空间形态变化特征. 经济地理, 2015,35(1):44-52.]
|
| [13] |
[ 焦利民, 张欣 . 基于圈层建设用地密度分析的中国主要城市扩张的时空特征. 长江流域资源与环境, 2015,24(10):1721-1728.]
|
| [14] |
[ 董婷 . 基于城市土地密度分布的城市形态全球对比分析[D]. 武汉: 武汉大学, 2017.]
|
| [15] |
[ 童陆亿, 胡守庚 . 中国主要城市建设用地扩张特征. 资源科学, 2016,38(1):50-61.]
|
| [16] |
[ 李加林, 许继琴, 李伟芳 , 等. 长江三角洲地区城市用地增长的时空特征分析. 地理学报, 2007,62(4):437-447.]
|
| [17] |
[ 冯健 . 杭州市人口密度空间分布及其演化的模型研究. 地理研究, 2002,21(5):635-646.]
|
| [18] |
[ 吴文钰, 高向东 . 中国城市人口密度分布模型研究进展及展望. 地理科学进展, 2010,29(8):968-974.]
|
| [19] |
[ 单卓然, 黄亚平, 张衔春 . 中部典型特大城市人口密度空间分布格局: 以武汉为例. 经济地理, 2015,35(9):33-39.]
|
| [20] |
[ 黄洁, 钟业喜 . 中国城市人口密度及其变化. 城市问题, 2014(10):17-22.]
|
| [21] |
[ 安杰尔·什洛莫 . 城市星球. 北京: 科学出版社, 2015.]
|
| [22] |
|
| [23] |
|
| [24] |
|
| [25] |
|
| [26] |
|
| [27] |
United Nations. World Urbanization Prospects: The 2014 Revision. https://esa.un.org/unpd/wup/Publications/Files/WUP2014-Report.pdf, 2014-07-10/2018-12-04.
|
| [28] |
|
| [29] |
|
| [30] |
|
| [31] |
|
| [32] |
[ 焦利民, 吴苏 . 利用自组织网络分析1990—2010年中国主要城市扩展特征. 武汉大学学报(信息科学版), 2014,39(12):1435-1440.]
|
| [33] |
|
/
| 〈 |
|
〉 |


