
Bole-Taipei Line: The important function and basic conception as a line for regional balanced development
Received date: 2019-06-05
Request revised date: 2019-12-27
Online published: 2020-04-25
Supported by
Major Program of the National Natural Science Foundation of China(41590840)
Major Program of the National Natural Science Foundation of China(41590842)
Copyright
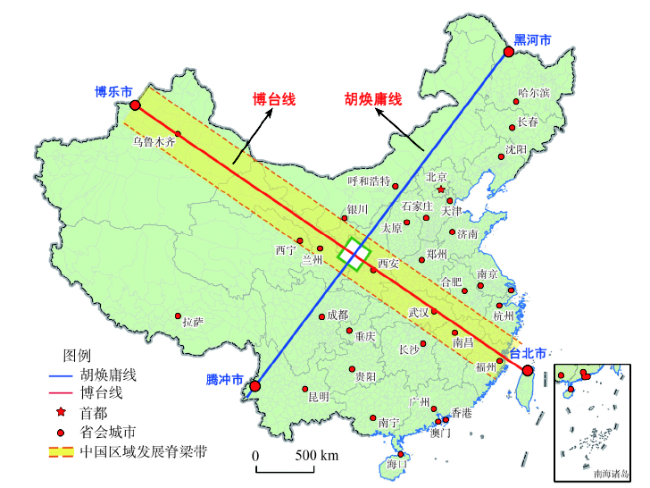
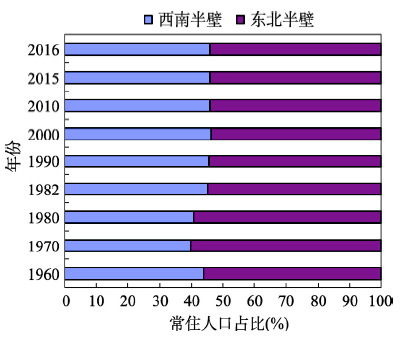
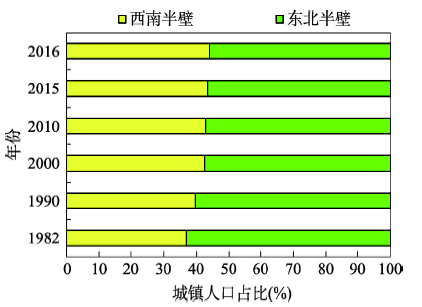
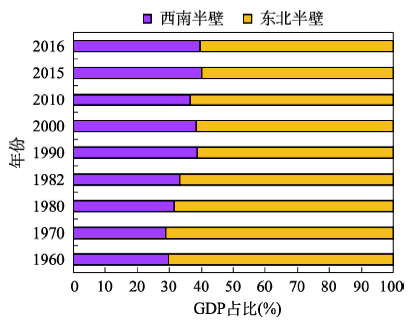
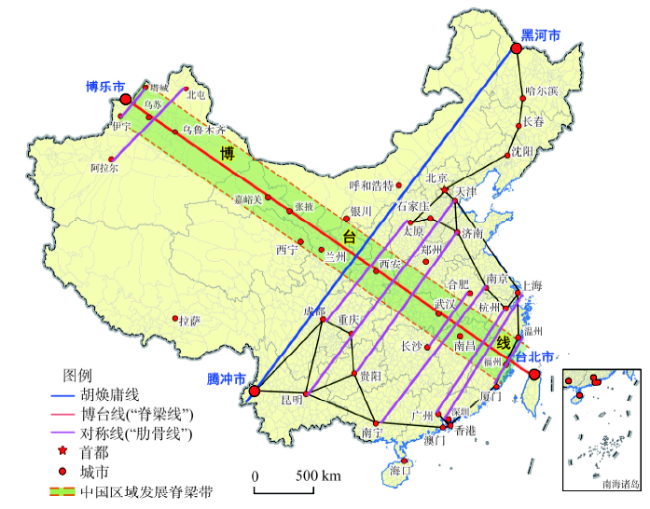
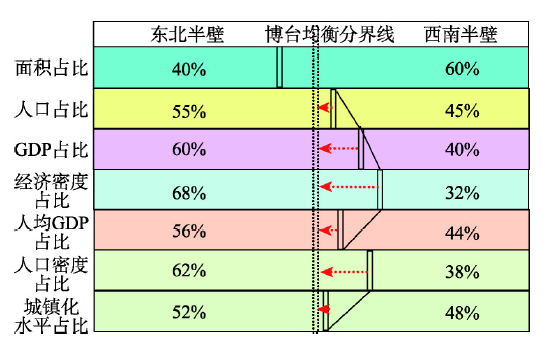
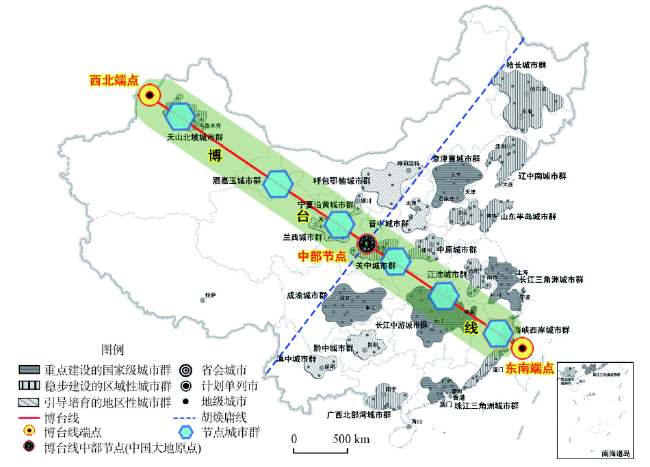
Promoting regional coordinated development strategy is one of the most important strategies in the new period of China. Faced with the reality of unbalanced and insufficient regional development in China, it is objectively necessary to construct one or more main axes supporting the coordinated and balanced development of regions to become the identification line representing the pattern of coordinated regional development. The results show that the Bo-Tai line, the northwest-southeast axis connecting Bole of Xinjiang and Taipei of Taiwan, can be built into a national development backbone line and regional balanced development line, just perpendicular to the Hu Line. In 2016, the area of southwest half and northeast half of Bo-Tai Line accounts for 59:41, while the population accounts for 45:55, the economic aggregate accounts for 40:60, the per capita GDP ratio accounts for 44:56, the population density ratio accounts for 38:62, the economic density ratio accounts for 32:68, and the urbanization level ratio accounts for 48:52. The main average indicators gradually tend to present a balanced development pattern. Further analysis shows that Bo-Tai Line is a strategic shoulder pole connecting two core zones of the Belt and Road, and is the peaceful reunification line of China's national tranquility and Taiwan's return. The Bo-Tai Line is also a solid line supported and connected by comprehensive transportation channels and a Pipa type symmetrical line for the development of cities and urban agglomerations. It is the backbone of the two-way opening up and the linkage development line between land and sea. It is also an important dividing line that promotes the coordinated development of the eastern, central and western regions, and addresses the imbalance and inadequacy of regional development. The Bo-Tai Line plays an irreplaceable strategic role in promoting the coordinated and balanced regional development. It is suggested that the construction of Bo-Tai Line should be included in the national development strategy, and the development strategic plan of Bo-Tai Line should be formulated to fully release the multiple potential functions. We should build three strategic support points (the northwest endpoint, the central strategic node and the southeast endpoint), carry out a comprehensive scientific investigation of the Bo-Tai Line, and strengthen the scientific cognition and publicity, and promote China's development in a higher-level, higher-quality, more coordinated, safer and more civilized direction. And we should make the Bo-Tai Line known to China and the world, and let the Bo-Tai Line truly become the backbone of the great rejuvenation of the Chinese nation.
FANG Chuanglin . Bole-Taipei Line: The important function and basic conception as a line for regional balanced development[J]. Acta Geographica Sinica, 2020 , 75(2) : 211 -225 . DOI: 10.11821/dlxb202002001
表1 博台线与胡焕庸线两侧国土面积占比对比分析Tab. 1 The ratio of land area on two sides of Bole-Taipei Line and Hu Line |
| 线名称 | 两侧名称 | 面积(万km2) | 占中国国土面积比例(%) | 线两侧面积大致比值 |
|---|---|---|---|---|
| 博台线 | 东北半壁 | 396.50 | 41.3 | 40∶60 |
| 西南半壁 | 563.50 | 58.7 | ||
| 胡焕庸线 | 西北半壁 | 416.64 | 43.4 | 40∶60 |
| 东南半壁 | 543.36 | 56.6 | ||
| 中国 | 960.00 | 100.0 |
表2 1960—2016年博台线两侧总人口及城镇人口占比的均衡格局分析Tab. 2 The proportion of total population and urban population on two sides of Bole-Taipei Line, 1960-2016 |
| 年份 | 常住总人口(万人) | 常住总人口占比(%) | 城镇人口(万人) | 城镇人口占比(%) | |||||||
|---|---|---|---|---|---|---|---|---|---|---|---|
| 西南半壁 | 东北半壁 | 西南半壁 | 东北半壁 | 西南半壁 | 东北半壁 | 西南半壁 | 东北半壁 | ||||
| 1960 | 28999.15 | 37207.85 | 43.80 | 56.20 | |||||||
| 1970 | 33067.84 | 49924.16 | 39.84 | 60.16 | |||||||
| 1980 | 40385.70 | 58319.30 | 40.92 | 59.08 | |||||||
| 1982 | 45444 | 54908 | 45.28 | 54.72 | 7606 | 13033 | 36.85 | 63.15 | |||
| 1990 | 51386 | 61665 | 45.45 | 54.55 | 11733 | 17880 | 39.62 | 60.38 | |||
| 2000 | 57400 | 66864 | 46.19 | 53.81 | 19605 | 26276 | 42.73 | 57.27 | |||
| 2010 | 60992 | 72289 | 45.76 | 54.24 | 28768 | 38233 | 42.94 | 57.06 | |||
| 2015 | 62814 | 74275 | 45.82 | 54.18 | 33689 | 43447 | 43.67 | 56.33 | |||
| 2016 | 64121.66 | 75091.7 | 46.06 | 53.94 | 34745 | 44165 | 44.03 | 55.97 | |||
| 平均值 | 增加 | 降低 | 44.55 | 55.45 | 增加 | 降低 | 41.64 | 58.36 | |||
注:① 1982年、1990年、2000年、2010年总人口数采用当年人口普查数据或1%抽样统计口径数据,以分县数据为主,涉及跨博台线的县,以县城所在半壁为准。其余年份总人口采用统计年鉴数据;② 2000年以前采用总人口数据,2000年以后采用常住总人口数据;③ 本表统计不含港澳台地区。 |
表3 1960—2016年博台线两侧经济总量占比变化Tab. 3 Change of economic gross proportion on two sides of Bole-Taipei Line, 1960-2016 |
| 年份 | 西南半壁 | 东北半壁 | |||
|---|---|---|---|---|---|
| GDP(亿元) | 占比(%) | GDP(亿元) | 占比(%) | ||
| 1960 | 432.61 | 29.69 | 1024.39 | 70.31 | |
| 1970 | 648.11 | 28.77 | 1604.59 | 71.23 | |
| 1980 | 1446.26 | 31.53 | 3141.34 | 68.47 | |
| 1982 | 1780 | 33.13 | 3593 | 66.87 | |
| 1990 | 7311 | 38.74 | 11562 | 61.26 | |
| 2000 | 38617 | 38.51 | 61663 | 61.49 | |
| 2010 | 150586 | 36.46 | 262444 | 63.54 | |
| 2015 | 274079 | 39.98 | 411426 | 60.02 | |
| 2016 | 293656 | 39.46 | 450472 | 60.54 | |
注:GDP采用当年价,本表统计不含港澳台地区。 |
表4 1960—2016年胡焕庸线两侧经济总量占比变化(%)Tab. 4 Change of economic gross proportion on two sides of Hu Line, 1960-2016 (%) |
| 年份 | 1960 | 1970 | 1980 | 1990 | 2000 | 2010 | 2016 | 占比变化幅度 |
|---|---|---|---|---|---|---|---|---|
| 东南半壁 | 93.96 | 95.21 | 94.90 | 94.87 | 95.76 | 94.07 | 94.41 | 微减少1.84 |
| 西北半壁 | 6.04 | 4.79 | 5.10 | 5.13 | 4.24 | 5.93 | 5.59 | 微增加1.84 |
| 两侧大致比例 | 94∶6 | 95∶5 | 95∶5 | 95:5 | 96∶4 | 94∶6 | 94∶6 | 基本稳定 |
表5 1960—2016年博台线两侧经济均量指标对比分析Tab. 5 Change of economic average on two sides of Bole-Taipei Line, 1960-2016 |
| 年份 | 人均GDP(元/人) | 人口密度(人/km2) | 经济密度(万元/km2) | ||||||||
|---|---|---|---|---|---|---|---|---|---|---|---|
| 西南 半壁 | 东北 半壁 | 西南与东北 半壁之比 | 西南 半壁 | 东北 半壁 | 西南与东北 半壁之比 | 西南 半壁 | 东北 半壁 | 西南与东北 半壁之比 | |||
| 1960 | 149 | 275 | 0.54∶1 | 51.46 | 93.84 | 0.55∶1 | 0.77 | 2.58 | 0.30∶1 | ||
| 1970 | 196 | 321 | 0.61∶1 | 58.68 | 125.91 | 0.47∶1 | 1.15 | 4.05 | 0.28∶1 | ||
| 1980 | 358 | 539 | 0.66∶1 | 71.67 | 147.09 | 0.49∶1 | 2.57 | 7.92 | 0.32∶1 | ||
| 1982 | 392 | 654 | 0.60∶1 | 80.65 | 138.48 | 0.58∶1 | 3.16 | 9.06 | 0.35∶1 | ||
| 1990 | 1423 | 1875 | 0.76∶1 | 91.19 | 155.52 | 0.59∶1 | 12.97 | 29.16 | 0.44∶1 | ||
| 2000 | 6728 | 9222 | 0.73∶1 | 101.86 | 168.64 | 0.60∶1 | 68.53 | 155.52 | 0.44∶1 | ||
| 2010 | 24689 | 36305 | 0.68∶1 | 108.24 | 182.32 | 0.59∶1 | 267.23 | 661.90 | 0.40∶1 | ||
| 2015 | 43633 | 55392 | 0.79∶1 | 111.47 | 187.33 | 0.60∶1 | 486.39 | 1037.64 | 0.47∶1 | ||
| 2016 | 45797 | 59990 | 0.76∶1 | 113.79 | 189.39 | 0.60∶1 | 521.13 | 1136.12 | 0.46∶1 | ||
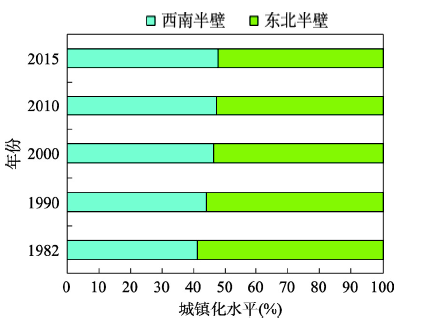
表6 1982—2015年博台线两侧城镇化水平对比(%)Tab. 6 Change of urbanization on two sides of Bole-Taipei Line, 1982-2015 (%) |
| 年份 | 西南半壁 | 东北半壁 | 西南与东北半壁之比 |
|---|---|---|---|
| 1982 | 16.74 | 23.74 | 0.71∶1 |
| 1990 | 22.83 | 29.00 | 0.79∶1 |
| 2000 | 34.16 | 39.30 | 0.87∶1 |
| 2010 | 47.17 | 52.89 | 0.89∶1 |
| 2015 | 53.63 | 58.49 | 0.92∶1 |
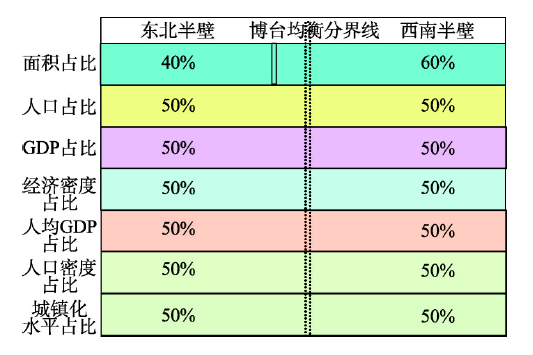
表7 博台线两侧主要经济社会指标占比变化趋向对比Tab. 7 Change of the proportion of major economic and social indicators on two sides of Bole-Taipei Line |
| 比较名称 | 2016年发展现状 | 未来均衡发展趋势 | 均衡发展比 (东北半壁/西南半壁) | |||
|---|---|---|---|---|---|---|
| 东北半壁 | 西南半壁 | 东北半壁 | 西南半壁 | |||
| 面积占比 | 40 | 60 | 40 | 60 | 40∶60 | |
| 人口占比 | 55 | 45 | 50 | 50 | 1∶1 | |
| GDP占比 | 60 | 40 | 50 | 50 | 1∶1 | |
| 人均GDP占比 | 56 | 44 | 50 | 50 | 1∶1 | |
| 经济密度占比 | 68 | 32 | 50 | 50 | 1∶1 | |
| 人口密度占比 | 62 | 38 | 50 | 50 | 1∶1 | |
| 城镇化水平占比 | 52 | 48 | 50 | 50 | 1∶1 | |
图7 博台线两侧占比现状及不均衡图Fig. 7 Current situation and imbalance of the proportion on two sides of Bole-Taipei Line |
本文在写作过程中得到中国科学院秦大河院士、叶大年院士、中国科学院地理科学与资源研究所何书金研究员的数次指导并提出了宝贵的修改意见;戚伟副研究员、刘海猛助理研究员、任宇飞博士生为本文搜集整理相关数据并清绘图件等,在此一并表示最诚挚的谢意!
| [1] |
[ 胡焕庸 . 中国人口之分布: 附统计表与密度图. 地理学报, 1935,2(2):33-74.]
|
| [2] |
[ 胡焕庸 . 中国人口的分布、区划和展望. 地理学报, 1990,45(2):139-145.]
|
| [3] |
[ 郑度 . 中国生态地理区域系统研究. 北京: 商务印书馆, 2008: 25-36.]
|
| [4] |
[ 张剑, 柳小妮, 谭忠厚 , 等. 基于GIS的中国南北地理气候分界带模拟. 兰州大学学报(自然科学版), 2012,48(2):1-8.]
|
| [5] |
[ 龚胜生 . 《禹贡》中的秦岭淮河地理界线. 湖北大学学报(哲学社会科学版), 1994,21(6):93-97.]
|
| [6] |
[ 方创琳, 王振波, 刘海猛 . 美丽中国建设的理论基础与评估方案探索. 地理学报, 2019,74(4):619-632.]
|
| [7] |
[ 邓铭江 . 中国西北“水三线”空间格局与水资源配置方略. 地理学报, 2019,73(7):1189-1203.]
|
| [8] |
[ 郭华东, 王心源, 吴炳方 , 等. 基于空间信息认知人口密度分界线: “胡焕庸线”. 中国科学院院刊, 2016,31(12):1385-1394.]
|
| [9] |
[ 陆大道, 王铮, 封志明 , 等. 关于“胡焕庸线能否突破”的学术争鸣. 地理研究, 2016,35(5):805-824.]
|
| [10] |
[ 方创琳, 王振波, 马海涛 . 中国城市群形成发育规律的理论认知与地理学贡献. 地理学报, 2018,73(4):651-665.]
|
| [11] |
[ 吴传钧 . 胡焕庸大师对发展中国地理学的贡献. 人文地理, 2001,16(5):1-4.]
|
| [12] |
[ 丁金宏, 何书金 . 中国人口地理格局与城市化未来: 纪念胡焕庸线发现80周年学术研讨会在上海举行. 地理学报, 2015,70(12):封2.]
|
| [13] |
[ 戚伟, 刘盛和, 赵美风 . “胡焕庸线”的稳定性及其两侧人口集疏模式差异. 地理学报, 2015,70(4):551-566.]
|
| [14] |
[ 陈明星, 李扬, 龚颖华 , 等. 胡焕庸线两侧的人口分布与城镇化格局趋势: 尝试回答李克强总理之问. 地理学报, 2016,71(2):179-193.]
|
| [15] |
[ 黄园淅. 杨波 . 从胡焕庸人口线看地理环境决定论. 云南师范大学学报: 哲学社会科学版, 2012,44(1):68-73.]
|
| [16] |
[ 王开泳, 邓羽 . 新型城镇化能否突破“胡焕庸线”: 兼论“胡焕庸线”的地理学内涵. 地理研究, 2016,35(5):825-835.]
|
| [17] |
[ 方创琳, 鲍超, 马海涛 . 中国城市群发展报告2016. 北京: 科学出版社, 2016: 12-17.]
|
| [18] |
[ 方创琳 . 天山北坡城市群可持续发展的战略思路与空间格局. 干旱区地理, 2019,42(1):1-9.]
|
| [19] |
[ 季珏, 高晓路 . 天山北坡城市群空间组织形态的识别研究. 干旱区地理, 2012,35(4):687-694.]
|
| [20] |
|
/
| 〈 |
|
〉 |