
Construction of an emergy and exergy coupling model for the analysis of regional sustainable development capability
Received date: 2018-06-11
Request revised date: 2019-05-05
Online published: 2019-10-29
Supported by
National Natural Science Foundation of China(No.41761116)
Natural Science Foundation of Ningxia(No.NZ17027)
Copyright
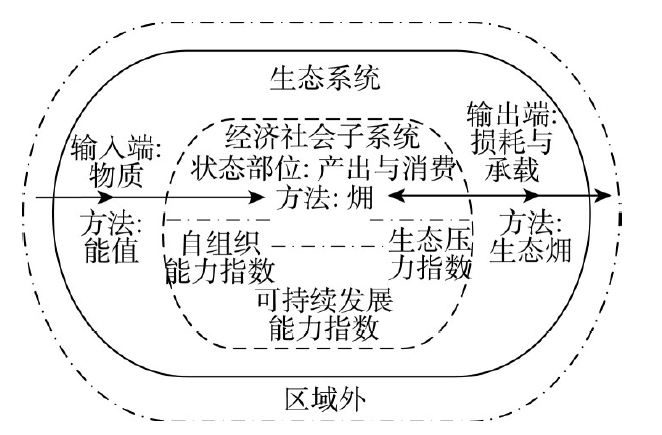
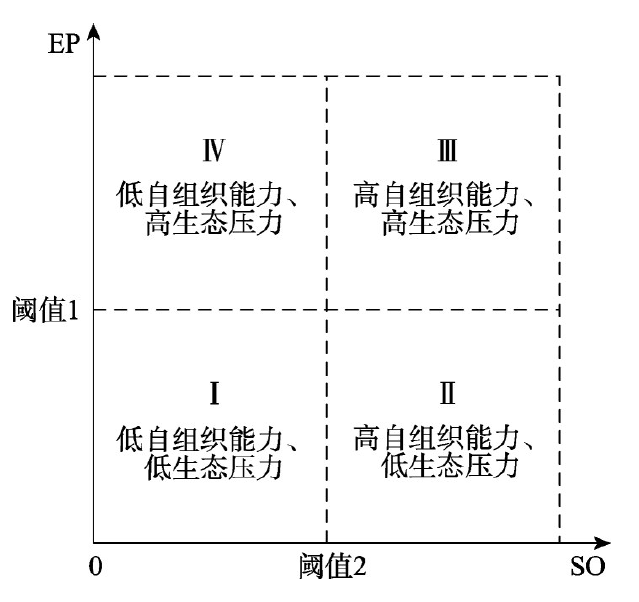
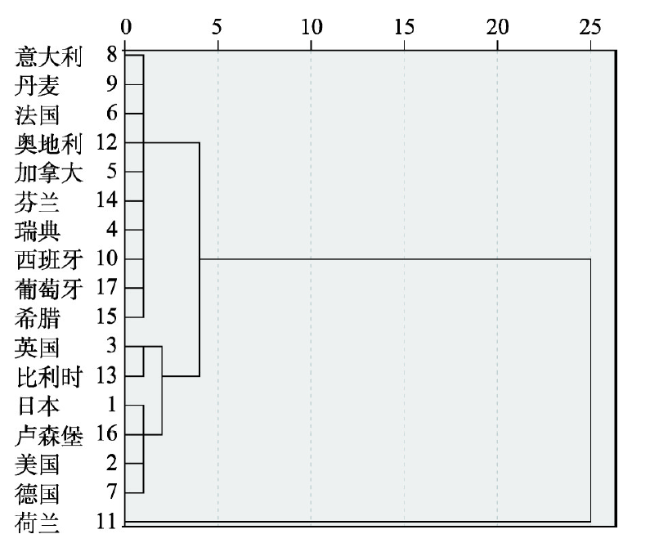
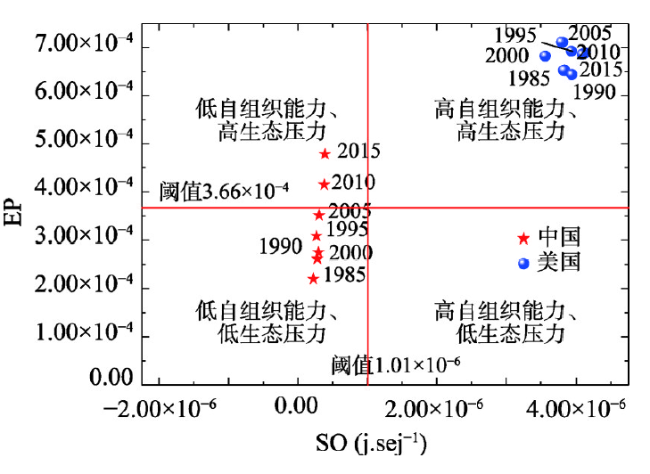
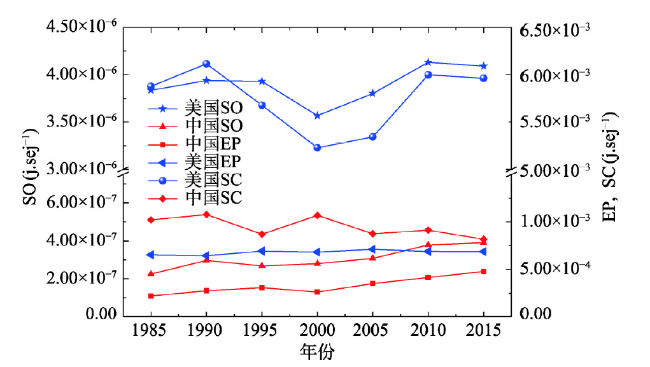
Methods for the evaluation of sustainable development capability are important and highly sought after tools for identifying the synergistic relationship between humans and the environment and guiding scientific decision-making for the implementation of ecological and environmental protection measures. Compared to traditional methods such as ecological footprint, environmental sustainability index, and human development index, emergy analysis and exergy analysis result in smaller errors and are more objective. These two methods can directly convert materials and services into energy units, without evaluation indicators and weight settings, and do not require raw dimensionless data. Exploring the coupling of emergy analysis and exergy analysis can provide a new perspective on and method for the analysis of regional sustainable development capabilities. Based on a literature review, a theoretical analysis framework was constructed. This study proposes an emergy and exergy coupling model for the analysis of sustainable development capability based on a thermodynamic theory. This analytical model has three indices, namely, self-organizing capability index (SO), ecological pressure index (EP), and sustainable development capability index (SC). The emergy and exergy input and output values of 17 typical developed countries in 1985 were screened via meta-analysis to calculate the SO and EP thresholds of the model, based on which sustainable development capability was divided into four stages. The model was tested via a comparative analysis of the sustainable development capability of China and the USA in 1985-2015. The results show that China was in the low self-organizing capacity and low ecological pressure stage before 2005. After 2005, it entered the low self-organizing capability and high ecological pressure stage. It has had low eco-efficiency and scale expansion driving characteristics. The USA is always in the high self-organizing capacity and high ecological pressure stage, and is characterized by high ecological efficiency, and economic and ecological decoupling. These results are consistent with the findings of the World Ecological Footprint Network and World Wildlife Fund, indicating that the proposed model is adaptive and reliable. In addition, the study results indicate that this model can express the ecological efficiency of an economic and social system in terms of "total annual exergy amount used/annual emergy input amount". Moreover, it can express the ecological pressure as "annual exergy loss of an economic and social system/annual eco-exergy produced by an ecosystem." This model connects the entropy path of an economic and social system to the ecosystem. Furthermore, it can identify sustainable development stage and analyze changes in sustainable development level and factors driving these changes. From an anthropological and ecological perspective, the model expresses the ecological efficiency of an economic and social system, evaluates the proportion of ecological space occupied, and can combine macroscopic scale with microscopic efficiency analysis, which is an improvement over conventional methods.
FAN Xingang , ZHONG Juntao , YANG Meiling , WEN Qi , MA Zhenning , MI Wenbao . Construction of an emergy and exergy coupling model for the analysis of regional sustainable development capability[J]. Acta Geographica Sinica, 2019 , 74(10) : 2062 -2077 . DOI: 10.11821/dlxb201910008
表1 1985年典型发达国家的自组织能力指数(SO)与生态压力指数(EP)值Tab. 1 Self-organizing capability index (SO) and ecological pressure index (EP) of typical developed countries |
| 序号 | 国家 | SO (j·sej-1) | 能值输入量(sej) | 㶲输出量 (j) | 㶲损耗量 (j) | 年生态产㶲量 (j) | EP (无量纲) |
|---|---|---|---|---|---|---|---|
| 1 | 日本 | 1.39×10⁻⁶ | 2.73×1024 | 3.78×10¹⁸ | 1.42×10¹⁹ | 2.75×10²² | 5.18×10⁻⁴ |
| 2 | 美国 | 3.83×10⁻⁶ | 1.29×1025 | 4.95×10¹⁹ | 2.42×10²⁰ | 3.70×10²³ | 6.53×10⁻⁴ |
| 3 | 英国 | 9.04×10⁻⁷ | 1.28×1024 | 1.15×10¹⁸ | 5.33×10¹⁸ | 5.43×10²¹ | 9.81×10⁻⁴ |
| 4 | 瑞典 | 8.91×10⁻⁷ | 3.25×10²³ | 2.89×10¹⁷ | 1.16×10¹⁸ | 3.07×10²² | 3.77×10⁻⁵ |
| 5 | 加拿大* | 2.54×10⁻⁶ | 7.99×10²³ | 2.03×10¹⁸ | 6.43×10¹⁸ | 3.78×10²³ | 1.70×10⁻⁵ |
| 6 | 法国 | 8.20×10⁻⁷ | 1.32×1024 | 1.09×10¹⁸ | 5.23×10¹⁸ | 2.28×10²² | 2.29×10⁻⁴ |
| 7 | 德国 | 1.06×10⁻⁶ | 1.95×1024 | 2.07×10¹⁸ | 8.95×10¹⁸ | 1.08×10²² | 8.26×10⁻⁴ |
| 8 | 意大利 | 6.26×10⁻⁷ | 1.36×1024 | 8.51×10¹⁷ | 3.96×10¹⁸ | 1.21×10²² | 3.27×10⁻⁴ |
| 9 | 丹麦 | 4.36×10⁻⁷ | 2.32×10²³ | 1.01×10¹⁷ | 5.39×10¹⁷ | 1.65×10²¹ | 3.27×10⁻⁴ |
| 10 | 西班牙 | 6.81×10⁻⁷ | 6.97×10²³ | 4.75×10¹⁷ | 1.85×10¹⁸ | 2.46×10²² | 7.54×10⁻⁵ |
| 11 | 荷兰 | 8.13×10⁻⁷ | 4.45×10²³ | 3.62×10¹⁷ | 1.64×10¹⁸ | 7.72×10²⁰ | 2.12×10⁻³ |
| 12 | 奥地利 | 5.19×10⁻⁷ | 2.94×10²³ | 1.52×10¹⁷ | 7.10×10¹⁷ | 3.99×10²¹ | 1.78×10⁻⁴ |
| 13 | 比利时 | 8.01×10⁻⁷ | 3.38×10²³ | 2.71×10¹⁷ | 1.09×10¹⁸ | 1.05×10²¹ | 1.04×10⁻³ |
| 14 | 芬兰 | 7.72×10⁻⁷ | 2.21×10²³ | 1.71×10¹⁷ | 6.52×10¹⁷ | 2.70×10²² | 2.41×10⁻⁵ |
| 15 | 希腊 | 3.66×10⁻⁷ | 2.94×10²³ | 1.08×10¹⁷ | 5.05×10¹⁷ | 4.41×10²¹ | 1.15×10⁻⁴ |
| 16 | 卢森堡 | 2.26×10⁻⁷ | 1.27×10²³ | 2.87×10¹⁶ | 8.36×10¹⁶ | 1.89×10²⁰ | 4.42×10⁻⁴ |
| 17 | 葡萄牙 | 3.27×10⁻⁷ | 2.33×10²³ | 7.63×10¹⁶ | 3.67×10¹⁷ | 5.29×10²¹ | 6.94×10⁻⁵ |
注:*加拿大缺乏1985年数据,用1986年数据代替。 |
表2 全球不同类型生态系统年生态㶲产出强度值Tab. 2 Annual eco-exergy output intensity of different types of ecosystems around the world |
| 生态系统类型(单位) | 淡水(河湖) | 林地(落叶林) | 农田 | 草原 |
|---|---|---|---|---|
| 年生物量(MJ·hm-2·a-1) | 11.00 | 26.40 | 20.00 | 7.20 |
| 生态㶲值(GJ·hm-2·a-1) | 93500 | 1000000 | 420000 | 18000 |
| [1] |
|
| [2] |
[ 樊杰 . 人地系统可持续过程、格局的前沿探索. 地理学报, 2014,69(8):1060-1068.]
|
| [3] |
[ 黄茄莉 . 国际可持续性评价方法研究进展与趋势. 生态经济, 2015,31(1):18-22.]
|
| [4] |
[ 靳相木, 柳乾坤 . 自然资源核算的生态足迹模型演进及其评论. 自然资源学报, 2017,32(1):163-176.]
|
| [5] |
|
| [6] |
[ 黄宝荣, 崔书红, 李颖明 . 中国2000~2010年生态足迹变化特征及影响因素. 环境科学, 2016,37(2):420-426.]
|
| [7] |
[ 吴健生, 李萍, 张玉清 . 基于生态足迹的城市地域可持续发展能力评价: 以深圳为例. 资源科学, 2008,30(6):850-856.]
|
| [8] |
|
| [9] |
[ 曹斌, 林剑艺, 崔胜辉 . 可持续发展评价指标体系研究综述. 环境科学与技术, 2010,33(3):99-105.]
|
| [10] |
[ 王红 . 基于物质流分析的中国减物质化趋势及循环经济成效评价. 自然资源学报, 2015,30(11):1811-1822.]
|
| [11] |
[ 王琳, 潘峰 . 环境—社会经济系统物质流分析研究述评. 生态经济, 2018,34(3):44-52.]
|
| [12] |
|
| [13] |
[ 樊新刚 . 宁夏限制开发生态区生态经济系统协调发展研究[D]. 银川: 宁夏大学, 2015.]
|
| [14] |
|
| [15] |
|
| [16] |
|
| [17] |
|
| [18] |
[ 樊新刚, 米文宝, 侯景伟 . 扩展㶲方法在区域生态经济驱动机制及效率研究中的应用. 应用生态学报, 2017,28(1):273-280.]
|
| [19] |
|
| [20] |
|
| [21] |
[ 张妍, 杨志峰 . 北京城市物质代谢的能值分析与生态效率评估. 环境科学学报, 2007,27(11):1892-1899.]
|
| [22] |
[ 刘耕源, 杨志峰, 陈彬 . 基于能值分析方法的城市代谢过程研究—理论与方法. 生态学报, 2013,33(15):4539-4551.]
|
| [23] |
|
| [24] |
[ 钟珍梅, 翁伯琦, 王义祥 , 等. 生态系统能值理论研究进展及若干问题思考. 福建农业学报, 2010,25(4):520-525.]
|
| [25] |
[ 陆宏芳, 蓝盛芳, 李雷 , 等. 评价系统可持续发展能力的能值指标. 中国环境科学, 2002,22(4):380-384.]
|
| [26] |
|
| [27] |
|
| [28] |
|
| [29] |
[ 郑宏飞, 吴裕远 . 㶲分析方法论. 西安交通大学学报(社会科学版), 2001,21(2):75-80.]
|
| [30] |
|
| [31] |
|
| [32] |
|
| [33] |
|
| [34] |
|
| [35] |
|
| [36] |
|
| [37] |
|
| [38] |
|
| [39] |
|
| [40] |
|
| [41] |
|
| [42] |
|
| [43] |
|
| [44] |
[ 樊新刚, 米文宝, 马振宁 . 区域经济—污染—环境三维评价模型的构建与应用. 环境科学, 2015(2):751-758.]
|
| [45] |
|
| [46] |
|
| [47] |
|
| [48] |
[ 王金南, 张静, 刘年磊 , 等. 基于EKC的全面小康中国与发达国家环境质量比较. 中国环境管理, 2016,8(2):9-15.]
|
| [49] |
|
| [50] |
|
| [51] |
|
| [52] |
|
| [53] |
|
| [54] |
|
| [55] |
[ 蓝盛芳, 钦佩, 陆宏芳 . 生态经济系统能值分析. 北京: 化学工业出版社, 2002.]
|
| [56] |
[
|
| [57] |
[ 李名升, 孙媛, 陈远航 , 等. 污染排放与环境质量关系模型构建与应用. 环境科学, 2014,35(3):1198-1204.]
|
| [58] |
|
| [59] |
[ 范小杉, 高吉喜 . 中国生态经济系统资源利用状况及演变趋势. 中国人口·资源与环境, 2009,19(5):37-44.]
|
| [60] |
|
| [61] |
[ 孙东琪, 张京祥, 朱传耿 , 等. 中国生态环境质量变化态势及其空间分异分析. 地理学报, 2012,67(12):1599-1610.]
|
| [62] |
[ 方恺 . 生态足迹深度和广度: 构建三维模型的新指标. 生态学报, 2013,33(1):267-274.]
|
| [63] |
Global Footprint Network. Footprint for Nations. , 2018-05-12.
|
| [64] |
[ 黄洁, 吝涛, 张宏强 . 基于DEA和Malmquist模型的中国三大城市群可持续发展效率研究. 中国人口·资源与环境, 2016,26(Suppl.1):373-376.]
|
| [65] |
[ 郑德凤, 郝帅, 孙才志 , 等. 中国大陆生态效率时空演化分析及其趋势预测. 地理研究, 2018,37(5):1034-1046.]
|
| [66] |
|
/
| 〈 |
|
〉 |
