
Impact of industrial spatial and organizational agglomeration patterns on industrial SO2 emissions of prefecture-level cities in China
Received date: 2018-06-03
Request revised date: 2019-05-19
Online published: 2019-10-29
Supported by
National Nature Science Foundation of China(No.41430637)
Henan Province Postdoctoral Science Foundation Funded 2018 Project(No.216305)
Copyright
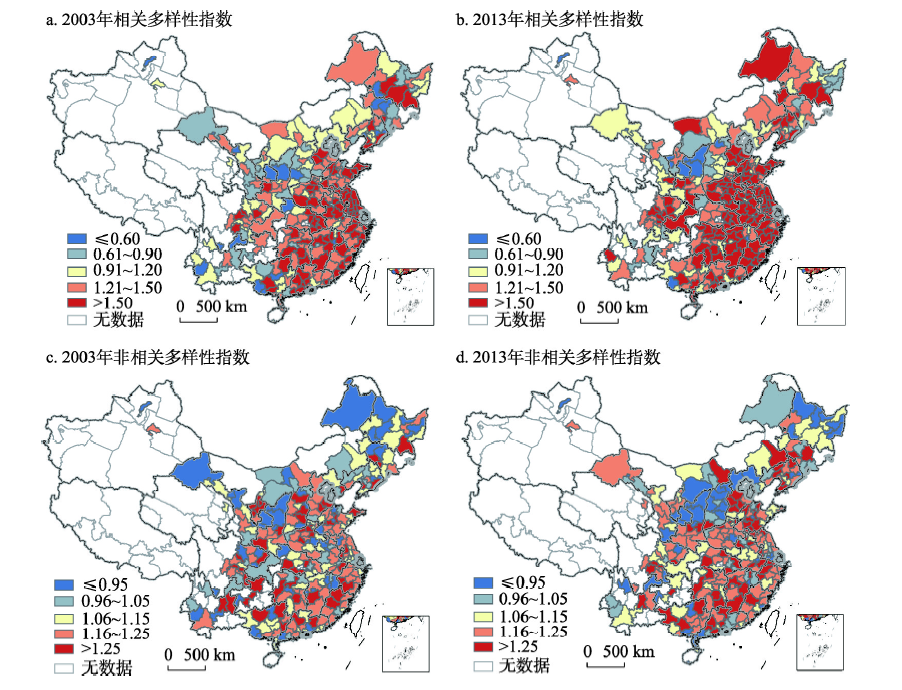
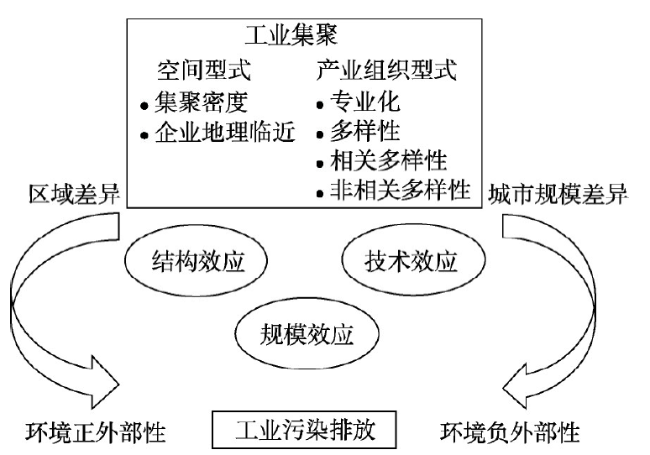
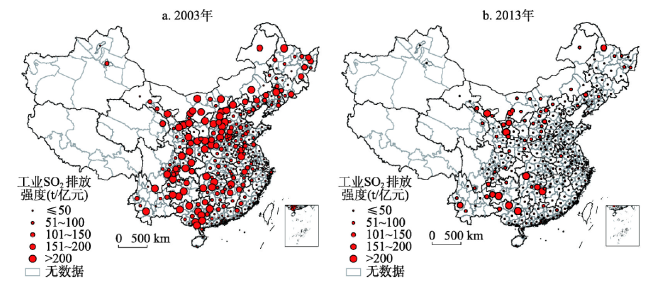
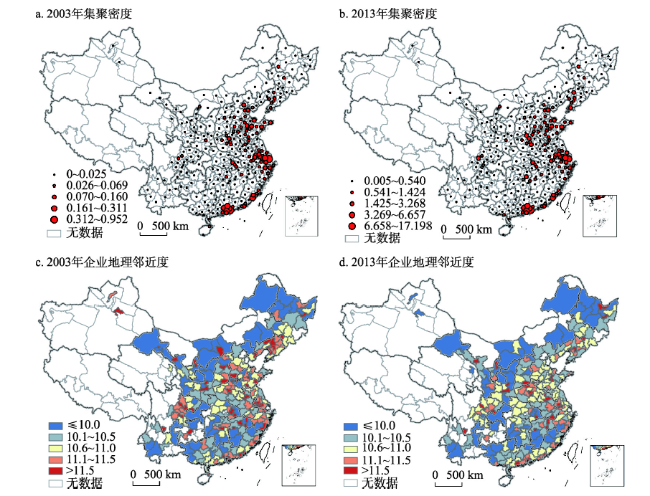
Agglomeration externality is an important mechanism for reducing industrial pollution emission. Different agglomeration patterns correspond to different pollution emission behaviors and effects. Based on the theory of agglomeration economies and the industrial data from 285 China's prefecture-level cities, this paper differentiates the agglomeration patterns into different types such as agglomeration density, geographical proximity, specialization, diversity, related diversity, and unrelated diversity from the spatial and organizational perspectives, and investigates the spatial patterns of industrial SO2 pollution intensity and industrial agglomeration levels, and examines the effects of different agglomeration types on industrial SO2 emissions by building econometric models. The main conclusions are as follows: (1) There exists the asymmetric spatial distribution between the industrial SO2 pollution intensity and the industrial agglomeration levels. The pollution intensity is higher in the west, but lower in the east. The levels of agglomeration density, geographic proximity, diversity, related diversity and unrelated diversity are higher in the eastern and central regions, but lower in the western. (2) There is the spatial spillover effect of industrial agglomeration on industrial SO2 pollution. The geographical agglomeration, diversity, and related diversity in neighboring regions have a negative impact on industrial pollution, while specialization has a positive effect. (3) Raising the agglomeration scale and guiding enterprises concentrated in industrial parks can help to reduce industrial SO2 emissions, and promoting the diverse and related industrial agglomeration is conducive to pollution reduction, while unrelated industries agglomeration will increase pollution emissions. (4) The impact of industrial agglomeration on industrial SO2 emissions has a notable spatial heterogeneity. Agglomeration density, geographic proximity, diversity and related diversity play a more significant role in pollution reduction in the central and western regions, while specialization and unrelated diversity are not conducive to pollution reduction in the eastern and central regions; Increasing agglomeration density and reducing diversity and unrelated diversity level are more beneficial to the small cities; Improving the geographic proximity, industrial diversity and related diversity levels are more helpful to the medium- and small-sized cites, but the reduction effect for the large cities goes obviously down because of the crowding effect. (5) To further reduce the intensity of industrial SO2 emissions, it is necessary to take the road of agglomeration, persist on increasing agglomeration density, guide enterprises' centralized layout, improve the level of industrial diversity based on technology association, strengthen the joint prevention and control among neighboring regions, and focus on the industrial linkage and environmental protection cooperation between regions.
HU Zhiqiang , MIAO Changhong , YUAN Feng . Impact of industrial spatial and organizational agglomeration patterns on industrial SO2 emissions of prefecture-level cities in China[J]. Acta Geographica Sinica, 2019 , 74(10) : 2045 -2061 . DOI: 10.11821/dlxb201910007
表1 不同集聚型式与工业SO2排放强度关系的回归结果(全国层面)Tab. 1 Regression result of the relationship between agglomeration pattern and industrial SO2 emission intensity at the national level |
| 模型1 | 模型2 | 模型3 | 模型4 | |
|---|---|---|---|---|
| ρ/λ | 0.536*** (0.016) | 0.565*** (0.016) | 0.497*** (0.017) | 0.506*** (0.017) |
| dens | -0.064** (0.026) | |||
| pro | -0.036*** (0.012) | |||
| rzi | 0.003 (0.002) | |||
| rdi | -0.622*** (0.100) | |||
| rv | -0.456*** (0.090) | |||
| uv | 0.458*** (0.117) | |||
| pop | -1.538*** (0.227) | -1.799*** (0.223) | -1.474*** (0.222) | -1.573*** (0.221) |
| sstr | 0.273** (0.119) | 0.290** (0.120) | 0.102 (0.120) | 0.052 (0.123) |
| open | -0.261 (0.735) | 0.938 (0.723) | 1.635** (0.715) | 1.428** (0.716) |
| tec | -5.294*** (1.508) | -11.141*** (1.380) | -8.557*** (1.369) | -10.118*** (1.358) |
| er | -0.034** (0.015) | -0.040*** (0.015) | -0.033** (0.015) | 0.041*** (0.015) |
| W×dens | -0.245*** (0.045) | |||
| W×pro | 0.021 (0.020) | |||
| W×rzi | 0.007** (0.004) | |||
| W×rdi | -1.079*** (0.172) | |||
| W×rv | -1.420*** (0.159) | |||
| W×uv | 0.323 (0.213) | |||
| R2 | 0.322 | 0.308 | 0.368 | 0.377 |
| Lli | -2579.101 | -2608.052 | -2539.161 | -2545.846 |
| 估计方法 | 固定效应 | 固定效应 | 固定效应 | 固定效应 |
注:*、**、***分别表示在0.1、0.05、0.01水平上显著;括号内数字为残差值。 |
表2 地理集聚密度和企业地理临近对工业SO2排放强度影响的分区域回归结果Tab. 2 Regression results of the relationship between geographical agglomeration, enterprises’ geographic proximity and industrial SO2 emission intensity in different regions of China |
| 东部 | 中部 | 西部 | 东部 | 中部 | 西部 | |
|---|---|---|---|---|---|---|
| dens | -0.163*** (0.025) | -0.941*** (0.096) | -2.275*** (0.260) | |||
| pro | 0.054** (0.025) | -0.074*** (0.022) | -0.061** (0.024) | |||
| pop | -0.302 (0.344) | -2.005*** (0.460) | -1.468** (0.648) | -0.926*** (0.336) | -3.235*** (0.461) | -3.638*** (0.638) |
| sstr | 1.093*** (0.271) | 1.088*** (0.222) | -0.023 (0.234) | 1.173*** (0.276) | 1.157*** (0.231) | 0.277 (0.241) |
| open | -1.161 (0.998) | -0.909 (1.972) | 4.120** (1.906) | -0.649 (1.014) | -1.339 (2.052) | 0.668 (1.938) |
| tec | -16.815*** (1.993) | -0.111 (2.476) | -54.787*** (7.370) | -21.836*** (1.858) | -12.005*** (2.442) | -77.033*** (7.172) |
| er | -0.708*** (0.072) | -1.453*** (0.098) | 0.008 (0.021) | -0.713*** (0.074) | -1.722*** (0.098) | -0.004 (0.022) |
| c | 5.478*** (2.126) | 15.878*** (2.640) | 12.613*** (3.304) | 8.686*** (2.112) | 23.717*** (2.658) | 24.216*** (3.299) |
| R2 | 0.369 | 0.467 | 0.314 | 0.344 | 0.423 | 0.258 |
| 估计方法 | 固定效应 | 固定效应 | 固定效应 | 固定效应 | 固定效应 | 固定效应 |
注:*、**、***分别表示在0.1、0.05、0.01水平上显著;括号内数字为残差值。 |
表3 专业化、多样性、相关(非相关)多样性对工业SO2排放强度影响的分区域回归结果Tab. 3 Regression results of the relationship between specialization, diversity, related and unrelated variety levels and industrial SO2 emission intensity in different regions of China |
| 东部 | 中部 | 西部 | 东部 | 中部 | 西部 | |
|---|---|---|---|---|---|---|
| rzi | 0.012** (0.005) | 0.015*** (0.004) | 0.002 (0.004) | |||
| rdi | -0.545*** (0.149) | -1.380*** (0.167) | -1.772*** (0.292) | |||
| rv | -0.446*** (0.145) | -1.195*** (0.159) | -0.872*** (0.197) | |||
| uv | 0.485* (0.242) | 0.741*** (0.211) | 0.304 (0.246) | |||
| pop | -0.948*** (0.332) | -2.507*** (0.446) | -3.093*** (0.624) | -0.339*** (0.088) | -3.072*** (0.452) | -3.020*** (0.635) |
| sstr | 1.076*** (0.276) | 0.701*** (0.227) | 0.170 (0.237) | 1.093*** (0.242) | 0.525** (0.244) | 0.095 (0.243) |
| open | -0.343 (1.006) | 0.004 (1.965) | 1.710 (1.912) | -0.944 (0.906) | -0.355 (2.016) | 0.979** (1.931) |
| tec | -21.942*** (1.833) | -6.600*** (2.276) | -71.874*** (7.099) | -23.996*** (1.728) | -10.613*** (2.321) | -77.865*** (7.118) |
| er | -0.689*** (0.073) | -1.522*** (0.096) | -0.003 (0.022) | -0.702*** (0.072) | -1.627*** (0.097) | 0.001 (0.022) |
| c | 9.993*** (2.065) | 20.060*** (2.547) | 22.424*** (3.186) | 5.820*** (0.635) | 22.938*** (2.595) | 21.146*** (3.238) |
| R2 | 0.356 | 0.474 | 0.286 | 0.346 | 0.447 | 0.270 |
| 估计方法 | 固定效应 | 固定效应 | 固定效应 | 随机效应 | 固定效应 | 固定效应 |
注:*、**、***分别表示在0.1、0.05、0.01水平上显著;括号内数字为残差值。 |
表4 集聚型式对工业SO2排放强度影响的分城市规模回归结果Tab. 4 Regression results of the relationship between industrial agglomeration patterns and industrial SO2 emission intensity at different urban scales |
| 小城市Ⅰ型 | 小城市Ⅱ型 | 中等城市 | 大城市 | |
|---|---|---|---|---|
| dens | -5.386*** (1.274) | -0.580*** (0.120) | -0.965*** (0.094) | -0.132*** (0.020) |
| pro | 0.008 (0.048) | -0.062*** (0.023) | -0.072** (0.023) | 0.032 (0.022) |
| rzi | 0.009 (0.006) | 0.009** (0.004) | 0.013** (0.005) | 0.005 (0.007) |
| rdi | 2.016*** (0.604) | -1.483*** (0.234) | -1.720*** (0.176) | -0.416*** (0.132) |
| rv | -0.175 (0.309) | -0.813*** (0.177) | -1.674*** (0.173) | -0.105 (0.190) |
| uv | 1.415*** (0.314) | 0.153 (0.250) | 0.208 (0.257) | 0.032 (0.295) |
注:*、**、***分别表示在0.1、0.05、0.01水平上显著;括号内数字为残差值。 |
| [1] |
[ 贺灿飞, 郭琪 . 集聚经济、技术关联与中国产业发展. 北京: 经济科学出版社, 2016.]
|
| [2] |
[ 李佳洺, 张文忠, 孙铁山 , 等. 中国城市群集聚特征与经济绩效. 地理学报, 2014,69(4):474-484.]
|
| [3] |
|
| [4] |
|
| [5] |
[ 贺灿飞, 周沂 . 环境经济地理研究. 北京: 科学出版社, 2016.]
|
| [6] |
[ 田光辉, 苗长虹, 胡志强 , 等. 环境规制、地方保护与中国污染密集型产业布局. 地理学报, 2018,73(10):1954-1969.]
|
| [7] |
[ 程钰, 任建兰, 陈延斌 , 等. 中国环境规制效率空间格局动态演变及其驱动机制. 地理研究, 2016,35(1):123-136.]
|
| [8] |
[ 高爽, 魏也华, 陈雯 . 发达地区制造业集聚和水污染的空间关联: 以无锡市区为例. 地理研究, 2011,30(5):902-912.]
|
| [9] |
[ 张姗姗, 张磊, 张落成 , 等. 苏南太湖流域污染企业集聚与水环境污染空间耦合关系. 地理科学, 2018,38(6):954-962.]
|
| [10] |
[ 赵海霞, 蒋晓威, 崔建鑫 . 泛长三角地区工业污染重心演变路径及其驱动机制研究. 环境科学, 2014,35(11):4387-4394.]
|
| [11] |
|
| [12] |
[ 谢荣辉, 原毅军 . 产业集聚动态演化的污染减排效应研究. 经济评论, 2016(2):18-28.]
|
| [13] |
|
| [14] |
|
| [15] |
[ 王兵, 聂欣 . 产业集聚与环境治理: 助力还是阻力. 中国工业经济, 2016(12):75-89.]
|
| [16] |
[ 石敏俊, 逄瑞, 郑丹 , 等. 中国制造业产业结构演进的区域分异与环境效应. 经济地理, 2017,37(10):108-115.]
|
| [17] |
|
| [18] |
|
| [19] |
|
| [20] |
[ 刘耀彬, 袁华锡, 封亦代 . 产业集聚减排效应的空间溢出与门槛特征. 数理统计与管理, 2018,37(2):224-234.]
|
| [21] |
|
| [22] |
[ 周锐波, 石思文 . 中国产业集聚与环境污染互动机制研究. 软科学, 2018,32(2):30-33.]
|
| [23] |
|
| [24] |
[ 邵宜航, 李泽扬 . 空间集聚、企业动态与经济增长: 基于中国制造业的分析. 中国工业经济, 2017(2):5-23.]
|
| [25] |
|
| [26] |
[ 孙晓华, 柴玲玲 . 相关多样化、无关多样化与地区经济发展: 基于中国282个地级市面板数据的实证研究. 中国工业经济, 2012(6):5-17.]
|
| [27] |
[ 贺灿飞, 董瑶, 周沂 . 中国对外贸易产品空间路径演化. 地理学报, 2016,71(6):970-983.]
|
| [28] |
[ 贺灿飞, 金璐璐, 刘颖 . 多维邻近性对中国出口产品空间演化的影响. 地理研究, 2017,36(9):1613-1626.]
|
| [29] |
[ 林兰 . 重化工业集群式创新机制与空间响应研究. 地理学报, 2016,71(8):1400-1415.]
|
| [30] |
|
| [31] |
|
| [32] |
|
| [33] |
|
| [34] |
[ 李琳, 熊雪梅 . 产业集群生命周期视角下的地理邻近对集群创新的动态影响: 基于对我国汽车产业集群的实证. 地理研究, 2012,31(11):2017-2030.]
|
| [35] |
[ 栾贵勤, 田芳, 孟仁振 . 集聚经济条件下的中国城市规模选择. 经济问题, 2008(11):44-47.]
|
| [36] |
|
| [37] |
[ 杨仁发 . 产业集聚能否改善中国环境污染. 中国人口·资源与环境, 2015,25(2):23-29.]
|
| [38] |
[ 潘文卿, 李子奈, 刘强 . 中国产业间的技术溢出效应: 基于35个工业部门的经验研究. 经济研究, 2011(7):18-29.]
|
| [39] |
[ 王晓硕, 宇超逸 . 空间集聚对中国工业污染排放强度的影响. 中国环境科学, 2017,37(4):1562-1570.]
|
/
| 〈 |
|
〉 |