
Supply and demand matching of ecosystem services in loess hilly region: A case study of Lanzhou
Received date: 2019-03-04
Request revised date: 2019-08-01
Online published: 2019-09-25
Supported by
National Natural Science Foundation of China(41861034)
Copyright
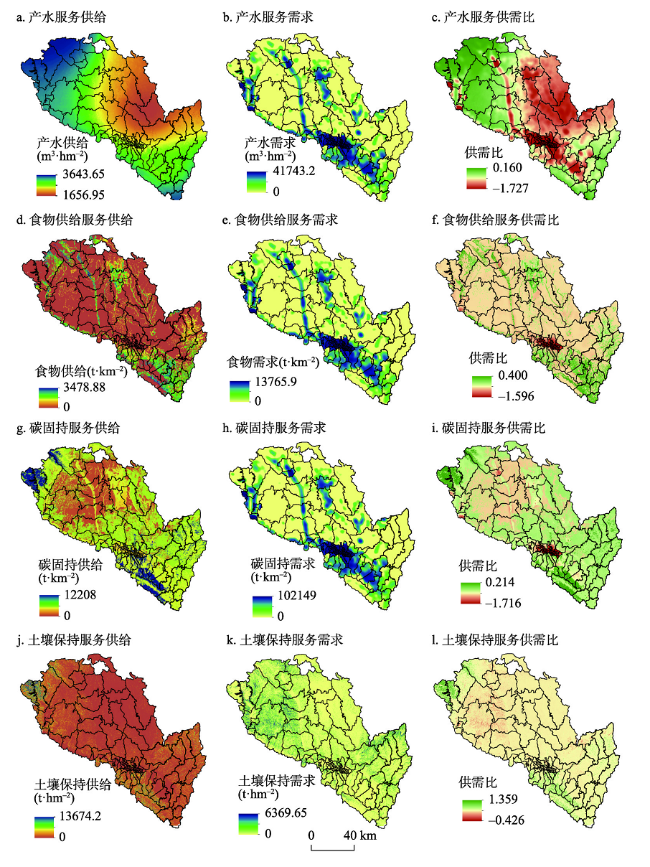
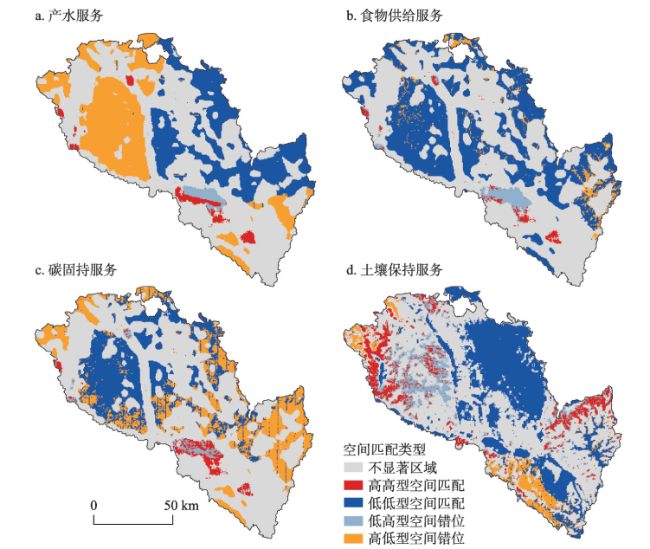
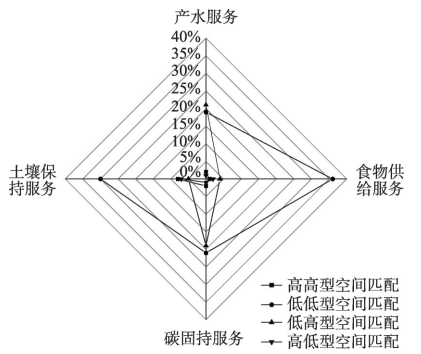
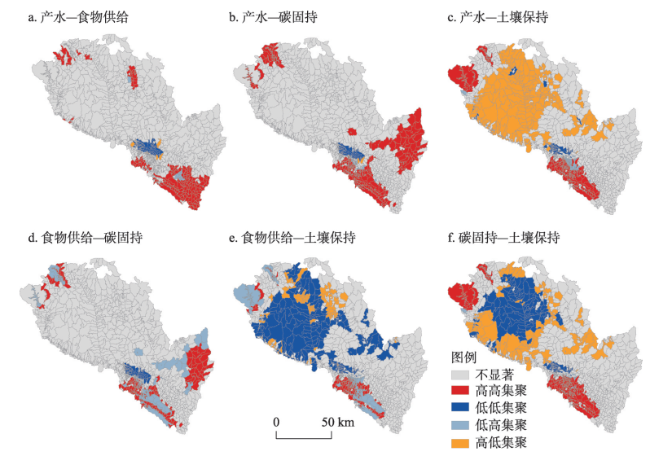
The sustainable supply of ecosystem services is the basis of the sustainable development. Human beings satisfy the demand and improve their own well-being through the consumption of ecosystem services. It is of great significance for the management of regional ecosystems and the effective allocation of resources to study the demand and consumption of ecosystem services and to analyze the supply and demand characteristics of ecosystem services and their spatial trade-offs. Based on the multi-source data such as land cover, meteorological observation and statistical yearbook in Lanzhou in 2017, the spatial analysis tools including InVEST model, ArcGIS and GeoDA were used to calculate the supply and demand of water yield, food supply, carbon storage and soil conservation. The supply and demand matching of ecosystem services in the study area was analyzed and evaluated. The results show that: (1) The supply and demand of ecosystem services have obvious spatial heterogeneity. The total supply of services is greater than the total demand, but there are differences between different sub-regions and different kinds of ecosystem services. (2) The supply-demand ratio of comprehensive ecosystem services is 0.039. There are differences in supply-demand matching of different kinds of ecosystem services: water yield service (0.098) > carbon storage service (0.066) > food supply service (0.030) > soil conservation service (0.001), and there are significant differences in supply-demand matching between urban and rural areas. (3) There are different kinds of spatial matching pattern between supply and demand of ecosystem services, including "high-high spatial matching", "low-low spatial matching", "high-low spatial dislocation" and "low-high spatial dislocation". (4) There are obvious synergic effects in the balance of supply and demand of services in Lanzhou, which are "high-high synergy" and "low-low synergy".

LIU Licheng , LIU Chunfang , WANG Chuan , LI Pengjie . Supply and demand matching of ecosystem services in loess hilly region: A case study of Lanzhou[J]. Acta Geographica Sinica, 2019 , 74(9) : 1921 -1937 . DOI: 10.11821/dlxb201909016
表1 兰州市人均食物需求量Tab. 1 Food demand per capita in Lanzhou |
| 食物类型 | 粮食 | 油类 | 蔬菜 | 肉类 | 水产品 | 蛋 | 奶 | 瓜果 | 总计 |
|---|---|---|---|---|---|---|---|---|---|
| 重量(kg) | 151 | 8.5 | 75 | 17 | 2.2 | 7.3 | 14 | 55 | 330 |
2.3.3 碳固持服务 碳固持服务是生态系统中一项重要的调节服务,使用InVEST模型中的Carbon Storage(碳固持)模块评估兰州市2017碳储量作为碳固持服务的供给量。以兰州市2017年人均碳排放量作为碳固持服务的需求量。基于兰州市2017年能源消耗总量,乘以碳排放系数得到兰州市2017年碳排放总量,再除以兰州市2017年常住人口得到兰州市2017年人均碳排放量,最后结合栅格化的人口密度数据,得到兰州市碳固持服务的需求空间分布图。公式如下: |
表2 兰州市各区县生态系统服务供需特征Tab. 2 Current situation of supply and demand of ecosystem services in Lanzhou |
| 产水服务(m3·hm-2) | 食物供给服务(t·km-2) | 碳固持服务(t·km-2) | 土壤保持服务(t·hm-2) | |||||
|---|---|---|---|---|---|---|---|---|
| 供给 | 需求 | 供给 | 需求 | 供给 | 需求 | 供给 | 需求 | |
| 兰州市 | 2570.17 | 343.82 | 376.41 | 113.38 | 4625.65 | 841.37 | 24.53 | 13.19 |
| 城关区 | 2442.38 | 5903.54 | 79.62 | 1946.84 | 5959.09 | 14446.41 | 21.42 | 9.40 |
| 七里河区 | 2666.76 | 1555.42 | 816.52 | 1147.00 | 7034.88 | 3806.24 | 57.59 | 8.09 |
| 安宁区 | 2459.80 | 3228.87 | 113.25 | 1693.93 | 5159.55 | 7901.30 | 10.38 | 9.71 |
| 西固区 | 2617.93 | 587.88 | 270.99 | 209.87 | 5220.65 | 1438.59 | 26.94 | 16.79 |
| 红古区 | 2824.80 | 313.02 | 269.59 | 103.23 | 3992.89 | 766.00 | 15.63 | 18.29 |
| 榆中县 | 2574.14 | 235.00 | 690.80 | 77.50 | 6086.43 | 575.06 | 30.24 | 10.93 |
| 永登县 | 2733.25 | 169.03 | 301.32 | 55.74 | 3649.31 | 413.64 | 25.95 | 16.20 |
| 皋兰县 | 2054.09 | 111.61 | 115.71 | 36.81 | 4609.20 | 273.12 | 9.06 | 7.96 |
表3 兰州市各区县生态系统服务供需比Tab. 3 ESDR in each district and county of Lanzhou |
| 产水服务供需比 | 食物供给服务供需比 | 碳固持服务供需比 | 土壤保持服务供需比 | 综合供需比 | |
|---|---|---|---|---|---|
| 兰州市 | 0.098 | 0.030 | 0.066 | 0.001 | 0.039 |
| 城关区 | -0.152 | -0.215 | -0.148 | 0.001 | -0.102 |
| 七里河区 | 0.048 | 0.035 | 0.057 | 0.005 | 0.028 |
| 安宁区 | -0.033 | -0.110 | -0.047 | 0.000 | -0.038 |
| 西固区 | 0.089 | 0.009 | 0.066 | 0.001 | 0.033 |
| 红古区 | 0.111 | 0.020 | 0.057 | 0.000 | 0.037 |
| 榆中县 | 0.103 | 0.071 | 0.096 | 0.002 | 0.054 |
| 永登县 | 0.086 | 0.028 | 0.057 | 0.001 | 0.034 |
| 皋兰县 | 0.113 | 0.009 | 0.076 | 0.000 | 0.040 |
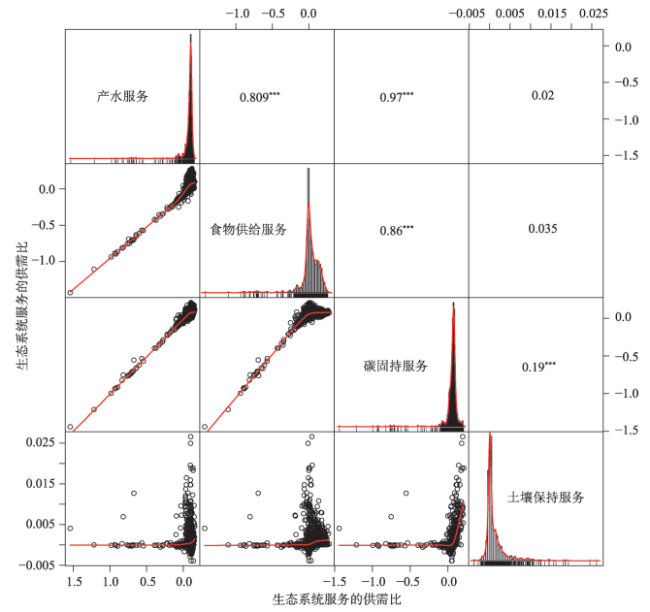
表4 兰州市生态系统服务供需匹配度双变量局部自相关指数Tab. 4 Bivariate Local Moran's I among supply and demand ratio of ecosystem services in Lanzhou |
| 生态系统服务对 | Moran's I指数 |
|---|---|
| 产水—食物供给 | 0.638 |
| 产水—碳固持 | 0.657 |
| 产水—土壤保持 | 0.015 |
| 食物供给—碳固持 | 0.630 |
| 食物供给—土壤保持 | 0.072 |
| 土壤保持—碳固持 | 0.136 |
| [1] |
[ 刘春芳, 王川, 刘立程 . 三大自然区过渡带生境质量时空差异及形成机制: 以榆中县为例. 地理研究, 2018,37(2):419-432.]
|
| [2] |
[ 刘春芳, 薛淑艳, 乌亚汗 . 土地整治的生态环境效应: 作用机制及应用路径. 应用生态学报, 2019,30(2):329-337.]
|
| [3] |
|
| [4] |
|
| [5] |
[ 张立伟, 傅伯杰 . 生态系统服务制图研究进展. 生态学报, 2014,34(2):316-325.]
|
| [6] |
[ 景永才, 陈利顶, 孙然好 . 基于生态系统服务供需的城市群生态安全格局构建框架. 生态学报, 2018,38(12):4121-4131.]
|
| [7] |
|
| [8] |
|
| [9] |
|
| [10] |
|
| [11] |
|
| [12] |
|
| [13] |
|
| [14] |
|
| [15] |
[ 严岩, 朱捷缘, 吴钢 , 等. 生态系统服务需求、供给和消费研究进展. 生态学报, 2017,37(8):2489-2496.]
|
| [16] |
|
| [17] |
|
| [18] |
|
| [19] |
|
| [20] |
|
| [21] |
|
| [22] |
|
| [23] |
[ 黄智洵, 王飞飞, 曹文志 . 耦合生态系统服务供求关系的生态安全格局动态分析: 以闽三角城市群为例. 生态学报, 2018,38(12):4327-4340.]
|
| [24] |
|
| [25] |
|
| [26] |
|
| [27] |
|
| [28] |
|
| [29] |
|
| [30] |
|
| [31] |
|
| [32] |
|
| [33] |
|
| [34] |
|
| [35] |
|
| [36] |
|
| [37] |
|
| [38] |
|
| [39] |
[ 刘慧敏, 范玉龙, 丁圣彦 . 生态系统服务流研究进展. 应用生态学报, 2016,27(7):2161-2171.]
|
| [40] |
[ 肖玉, 谢高地, 鲁春霞 , 等. 基于供需关系的生态系统服务空间流动研究进展. 生态学报, 2016,36(10):3096-3102.]
|
| [41] |
[ 马琳, 刘浩, 彭建 , 等. 生态系统服务供给和需求研究进展. 地理学报, 2017,72(7):1277-1289.]
|
| [42] |
[ 石忆邵, 史东辉 . 洞庭湖生态经济区生态服务供需平衡研究. 地理研究, 2018,37(9):1714-1723.]
|
| [43] |
[ 欧维新, 王宏宁, 陶宇 . 基于土地利用与土地覆被的长三角生态系统服务供需空间格局及热点区变化. 生态学报, 2018,38(17):6337-6347.]
|
| [44] |
[ 孟士婷, 黄庆旭, 何春阳 , 等. 区域碳固持服务供需关系动态分析: 以北京为例. 自然资源学报, 2018,33(7):1191-1203.]
|
| [45] |
[ 彭建, 杨旸, 谢盼 , 等. 基于生态系统服务供需的广东省绿地生态网络建设分区. 生态学报, 2017,37(13):4562-4572.]
|
| [46] |
[ 刘文辉, 李春亮, 吴永强 . 甘肃省兰州—白银地区土壤有机碳库储量估算与空间分布特征. 物探与化探, 2012,36(3):367-371.]
|
| [47] |
[ 闫庆武, 卞正富, 张萍 , 等. 基于居民点密度的人口密度空间化. 地理与地理信息科学, 2011,27(5):95-98.]
|
| [48] |
|
| [49] |
|
| [50] |
|
| [51] |
|
| [52] |
[ 蔡崇法, 丁树文, 史志华 , 等. 应用USLE模型与地理信息系统IDRIS预测小流域土壤侵蚀量的研究. 水土保持学报, 2000,14(2):19-24.]
|
| [53] |
|
| [54] |
[ 陈刚强, 李郇, 许学强 . 中国城市人口的空间集聚特征与规律分析. 地理学报, 2008,63(10):1045-1054.]
|
/
| 〈 |
|
〉 |