
Spatiotemporal variability of actual heating energy efficiency and its influencing factors in areas south and north of Qinling-Huaihe Line
Received date: 2018-09-10
Request revised date: 2019-07-01
Online published: 2019-09-25
Supported by
National Natural Science Foundation of China(41701592)
National Natural Science Foundation of China(41877519)
Fundamental Research Funds for the Central Universities(GK201703048)
Copyright
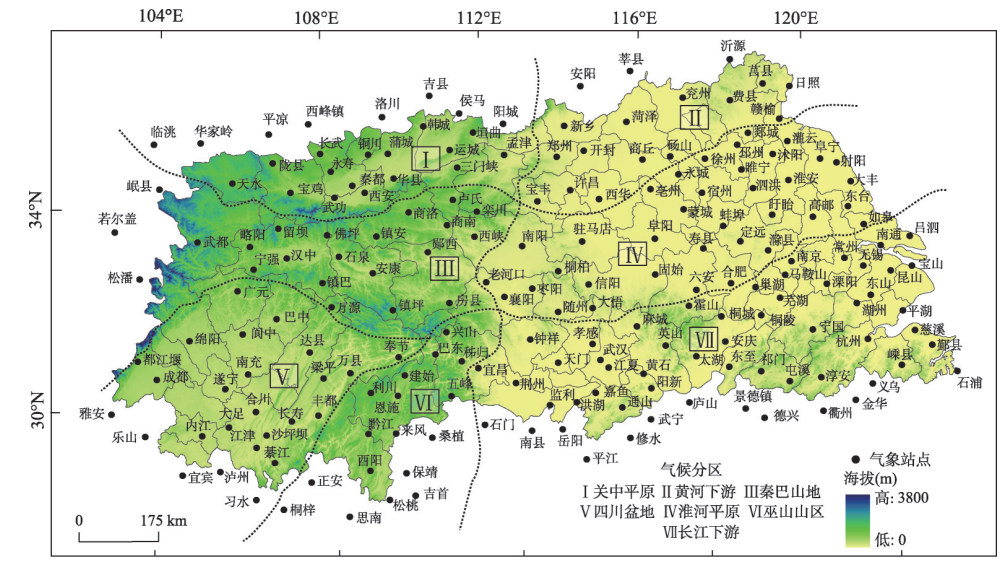
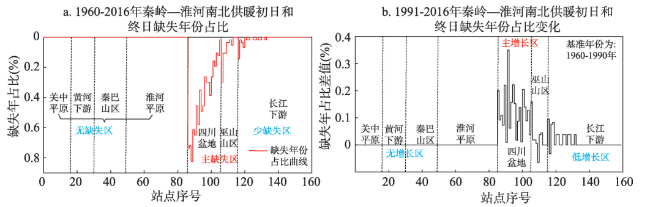
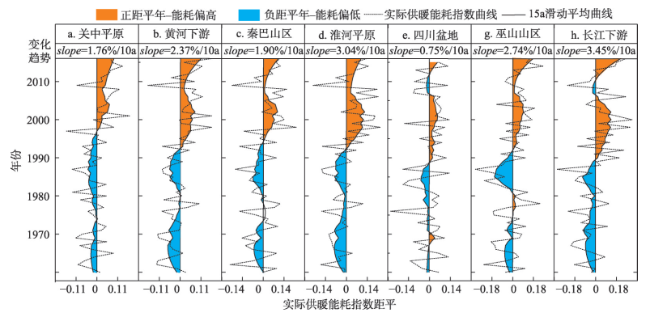
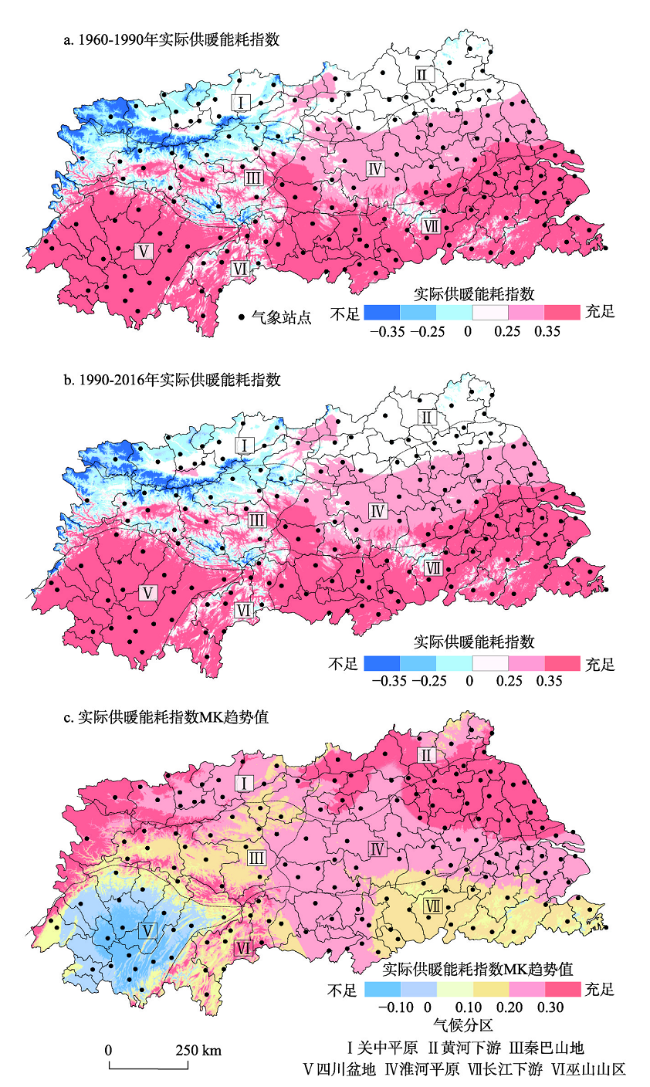
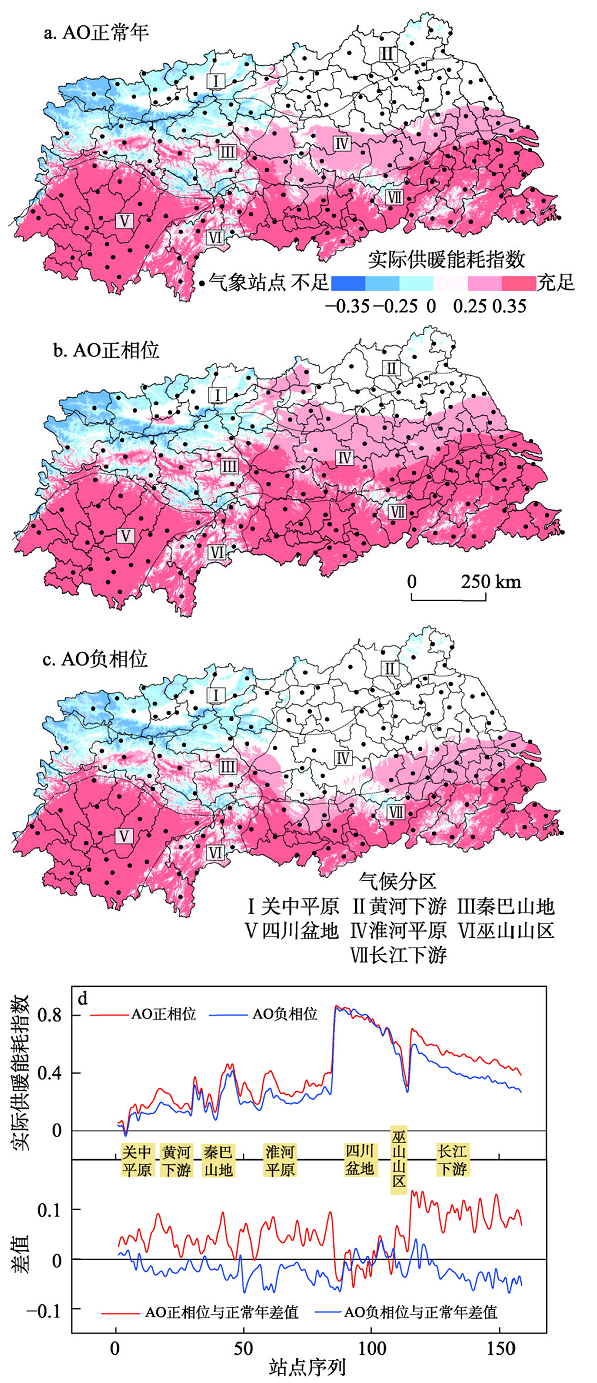
Using daily temperature observations from the National Meteorological Information Center of China, we analyzed the spatiotemporal variation in actual heating energy efficiency in areas south and north of the Qinling Mountains-Huaihe River (hereafter Qinling-Huanhe Line) over the period 1960-2016. The dynamic heating index, defined as the difference between fixed and dynamic heating energy consumption during the entire heating season, was used. Specifically, we analyzed the spatiotemporal response of actual heating energy efficiency to the Arctic Oscillation (AO) index, where changes in the circulation pattern bring frigid winter air to eastern China in the negative phase, resulting in increased heating energy demand. The results showed that: (1) spatial pattern of heating energy consumption in areas south and north of the Qinling-Huaihe Line was high in the eastern and southern regions, but low in the western and northern regions. The signal of decreasing heating energy demand in the lower latitudes of the region occurred earlier than in the higher latitudes. (2) On the whole, actual regional heating energy efficiency showed a decreasing trend that was corresponded with regional warming. In the north, however, the decreasing trend was weaker than in the south during the study period. This implies that residents continued to adopt a fixed-date strategy in the heating season, thus heating energy waste would increase consistently throughout the seven sub-regions, especially in the south. (3) Comparing the situation before and after climate change, i.e., 1960-1990 versus 1990-2016, we found that substantial changes were not evident in the spatial pattern of heating energy consumption in areas south and north of the Qinling-Huaihe Line. Nevertheless, there were differences in the response of temperature variations to climate change. The lower reaches of the Yangtze River, the Hanjiang River Basin, and the Wushan Mountains were some areas where heating energy waste was slowly increasing. A faster increase in heating energy waste mainly occurred in the eastern Huaihe Plain, the northwestern lower Yellow River Basin, and the Qinling-Bashan Mountains. (4) Actual heating energy efficiency had a close relationship with AO in the south-north transitional zone of China. Over the past 57 years, the AO alternated between positive and negative phases. Starting in the 1990s, the AO tended to be more of a positive phase pattern, in which higher pressure at the mid-latitudes drove warm air farther north, bringing warmer winters to the Qinling-Huaihe region, and thus decreased heating energy consumption. Spatially, the most sensitive responses of heating energy efficiency to climate change occurred in the southern Huaihe Plain and the northern regions of the lower Yangtze River Basin. In future, we should mitigate the risks of extreme climate change in sharply negative phases of the AO warrant attention, and develop policies concerning household heating in the south-north transitional zone of China.
LI Shuangshuang , YAN Junping , WU Yaqun , WANG Chengbo . Spatiotemporal variability of actual heating energy efficiency and its influencing factors in areas south and north of Qinling-Huaihe Line[J]. Acta Geographica Sinica, 2019 , 74(9) : 1866 -1877 . DOI: 10.11821/dlxb201909012
表1 秦岭—淮河南北实际供暖能耗指数统计特征Tab. 1 The statistics of actual heating energy consumption in areas south and north of Qinling-Huaihe Line |
| 指标 | 秦岭—淮河以北 | 秦岭—淮河以南 | |||||
|---|---|---|---|---|---|---|---|
| 关中平原 | 黄河下游 | 秦巴山区 | 淮河平原 | 四川盆地 | 巫山山区 | 长江下游 | |
| 1960-1990年 | 0.063 | 0.123 | 0.229 | 0.195 | 0.782 | 0.470 | 0.381 |
| 1990-2016年 | 0.115 | 0.200 | 0.293 | 0.299 | 0.819 | 0.572 | 0.511 |
| 两阶段增长率(%) | 83.1↑ | 62.0↑ | 27.8↑ | 53.6↑ | 4.7↑ | 21.8↑ | 33.9↑ |
| 变化趋势(%/10a) | 1.76 | 2.37 | 1.90 | 3.04 | 0.75 | 2.74 | 3.45 |
| 变异系数 | 0.807 | 0.489 | 0.374 | 0.432 | 0.115 | 0.248 | 0.335 |
| Pettier突变点 | 1997 | 1993 | 1997 | 1993 | 1989 | 1989 | 1987 |
表2 北极涛动正负相位异常年份Tab. 2 The Arctic Oscillation in positive and negative phases |
| 标准 | 年份 | |
|---|---|---|
| 正距平 ≥ 0.5 | 1972, 1975, 1988, 1989, 1991, 1992, 1994, 1999, 2001, 2006, 2007, 2011, 2013, 2014, 2016 | |
| 负距平 ≤ -0.5 | 1961, 1962, 1964, 1965, 1968, 1969, 1976, 1979, 1980, 1984, 1985, 1986, 1995, 1997, 2000, 2005, 2009, 2012 | |
| [1] |
|
| [2] |
[ 秦大河 . 中国极端气候事件和灾害风险管理及适应国家评估报告. 北京: 科学出版社, 2015.]
|
| [3] |
[ 吴绍洪, 潘韬, 刘燕华 , 等. 中国综合气候变化风险区划. 地理学报, 2017,72(1):3-17.]
|
| [4] |
[ 李双双, 延军平, 杨赛霓 , 等. 1960-2016年秦岭—淮河地区热浪时空变化特征及其影响因素. 地理科学进展, 2018,37(4):504-514.]
|
| [5] |
[ 李双双, 杨赛霓, 刘宪锋 . 1960-2013年秦岭—淮河南北极端降水时空变化特征及其影响因素. 地理科学进展, 2015,34(3):354-363.]
|
| [6] |
[ 陈莉, 方修琦, 李帅 , 等. 中国与欧美寒冷地带采暖耗能的比较. 自然资源学报, 2011,26(7):1258-1268.]
|
| [7] |
|
| [8] |
|
| [9] |
中华人民共和国建筑部. 民用建筑供暖通风与空气调节设计规范(GB50736-2012). 北京: 中国计划出版社, 2003.
[ Ministry of Construction of People Republic China. Design Code for Design of Heating, Ventilation and Air Condition of Civil Buildings (GB50736-2012). Beijing: China Planning Press, 2003.]
|
| [10] |
[ 闫丹丹 . 南方供暖尝试“破冰”: 杭州推天然气家庭分户供暖. 新华社. 2017-02-05.]
|
| [11] |
[ 陈莉, 李帅, 覃雪 , 等. 东北地区采暖气候条件变化特征及预测. 自然资源学报, 2014,29(7):1185-1195.]
|
| [12] |
|
| [13] |
|
| [14] |
|
| [15] |
|
| [16] |
|
| [17] |
[ 刘玉莲, 任国玉 . 基于度—时法的哈尔滨冬季采暖强度评价. 自然资源学报. 2018,33(1):139-148.]
|
| [18] |
[ 严中伟, 李珍, 夏江江 . 气候序列的均一化: 定量评估气候变化的基础. 中国科学: 地球科学, 2014,44(10):2101-2111.]
|
| [19] |
|
| [20] |
[ 许艳, 唐国利, 张强 . 基于均一化格点资料的全球变暖趋缓期中国气温变化特征分析. 气候变化研究进展, 2017,13(6):569-577.]
|
| [21] |
National Climate Committee of China Meteorological Administration. China Climate Bulletin in 2017. Beijing: National Climate Committee of the China Meteorological Adminstration, 2018.
[ 中国气象局国家气候委员会. 2017. 中国气候公报. 北京: 中国气候局国家气候委员会, 2018.]
|
| [22] |
|
| [23] |
[ 吴绍洪, 刘文政, 潘韬 , 等. 1960-2011年中国陆地表层区域变动幅度与速率. 科学通报, 2016,61(19):2187-2197.]
|
| [24] |
|
| [25] |
|
| [26] |
[ 张乐英, 徐海明, 施宁 . 春季北极涛动对盛夏长江流域地表气温的影响. 大气科学, 2015,19(5):1049-1058.]
|
| [27] |
|
| [28] |
|
| [29] |
|
| [30] |
[ 李双双, 芦佳玉, 延军平 , 等. 1970-2015年秦岭南北气温时空变化及其气候分界意义. 地理学报, 2018,73(1):13-24.]
|
| [31] |
[ 丁一汇, 柳艳菊, 梁苏洁 , 等. 东亚冬季风的年代际变化及其与全球气候变化的可能联系. 气象学报, 2014,72(5):835-852.]
|
| [32] |
[ 李双双, 延军平, 孔锋 , 等. 极点对称模态分解下西安高温天气的趋势特征. 地理研究, 2018,37(1):209-219.]
|
| [33] |
[ 穆穆, 任宏利 . 2014-2016年超强厄尔尼诺事件研究及其预测给予我们的启示. 中国科学: 地球科学, 2017,47(9):993-995.]
|
| [34] |
[ 吴绍洪, 高江波, 邓浩宇 , 等. 气候变化风险及其定量评估方法. 地理科学进展, 2018,37(1):28-35.]
|
/
| 〈 |
|
〉 |