Climate Change and Surface Processes

Effects of urban morphology and wind conditions on land surface temperature in Changchun

  • FENG Zhangxian 1 ,
  • WANG Shijun 1 ,
  • JIN Shanhe 2 ,
  • YANG Jun , 2
Expand
  • 1. School of Geographical Sciences, Northeast Normal University, Changchun 130024, China
  • 2. Human Settlements Research Center, Liaoning Normal University, Dalian 116029, Liaoning, China

Received date: 2018-08-27

  Request revised date: 2019-02-27

  Online published: 2019-05-24

Supported by

National Natural Science Foundation of China(41571150)

National Natural Science Foundation of China(41630749)

National Natural Science Foundation of China(41771178)

National Natural Science Foundation of China(41471140)

Program of Innovation Talents in Universities of Liaoning Province(LR2017017)

Copyright

Copyright reserved © 2019

Abstract

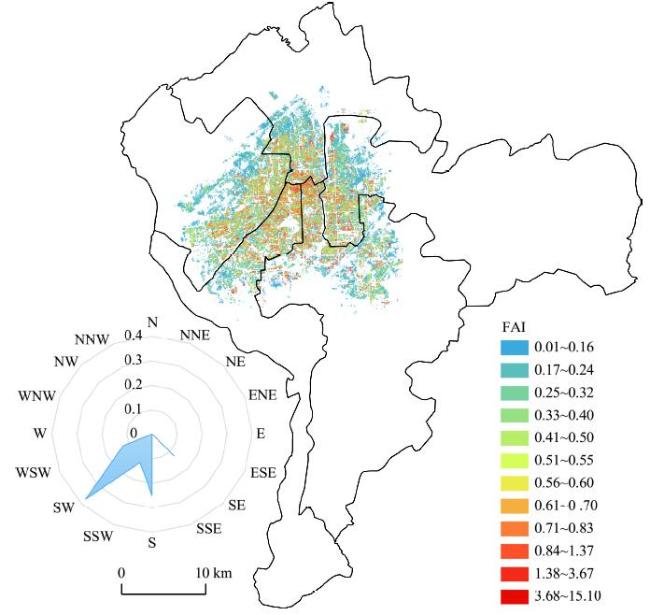
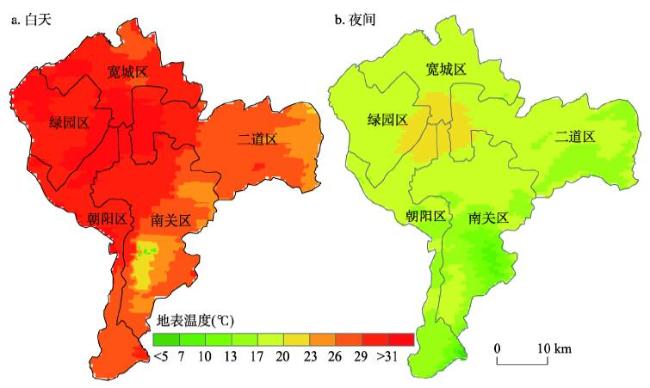
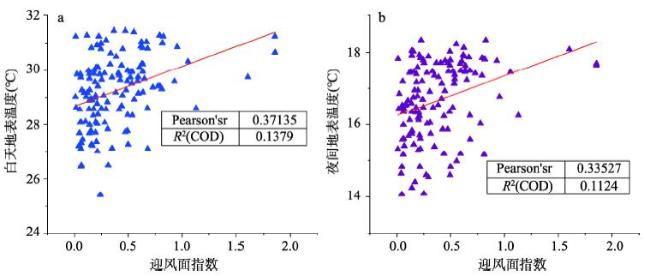
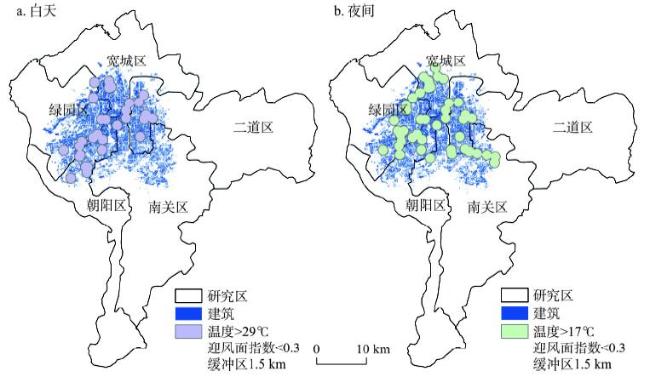
The urban heat island effect has received an increasing attention recently with the acceleration of urbanization. However, so far few studies have focuses on the effects of urban morphology and wind conditions on land surface temperature (LST). This study utilizes a range of multi-source data including architecture and remote sensing and applies a GIS spatial method combined with urban building frontal area index (FAI) and LST. This research aims to evaluate spatiotemporal differences in the FAI of urban built-up areas as well as to explore the influence of urban form on surface temperature. Results initially reveal that building FAI conforms to a spatial trend comprising outward diffusion from the city center and shows that high density, higher elevation buildings hinder the wind strongly. Data show that FAI values for the north of Chaoyang District are the largest, reaching a maximum of 15.1, while those for edge areas for each district are the smallest, falling to a minimum of 0.01. Secondly, the results of this analysis reveal large differences in surface temperature between day and night within the study area, ranging between 18.15 ℃ and 31.73 ℃ and between 4.27 ℃ and 18.43 ℃, respectively. Spatial distribution values exhibit the same characteristics as those for the FAI; the urban central city is characterized by high temperature, which gradually spreads out in a concentric manner. The range of high temperature areas during the day is also larger than that at night as these values are influenced by other variables including urban architectural form and artificial heat sources. Thirdly, the data assembled here show that FAI is related to surface temperature to a certain extent; recorded correlations between day and night are 0.371 and 0.355, respectively, both significant at the 0.01 level. It is also the case that building spatial shape is distinct in both vertical and horizontal directions and that the influence of surface temperature varies. Wind environmental data is an important component of quantitative research on building form and is necessary if urban climate scientists and planners are to explore and enhance potential ventilated corridors within cities.

Cite this article

FENG Zhangxian , WANG Shijun , JIN Shanhe , YANG Jun . Effects of urban morphology and wind conditions on land surface temperature in Changchun[J]. Acta Geographica Sinica, 2019 , 74(5) : 902 -911 . DOI: 10.11821/dlxb201905005

1 引言

城市气温比周边农村地区气温或地表温度高,称为热岛现象。全球气候变暖背景下,热岛效应对农业[1]、城市发展[2]、植被生长[3]都具有一定影响。城市热岛被认为是21世纪对人类生活影响最重要因素之一[4,5,6]。城市热岛效应会加重城市地区的热胁迫,城市结构的辐射热量对温度的增加起重要作用,人为因素给城市带来了大量的问题,深刻改变了城市微气候,影响城市人居环境舒适度。2018年7月北半球罕见高温,中国东北地区尤为明显,长春市连续17天气温超过32 ℃,最高气温达到37 ℃,追平历史极值,城市热岛效应进一步加强了异常天气对城市的不利影响。国内外研究者从宏观到微观角度,研究了城市热岛效应带来的影响,以及如何缓解城市热岛现象。希腊雅典大学教授Mat Santamouris研究欧洲城市热岛形成的因素认为风速、云量等气象条件是决定热岛形成的气象因素[7]。Zhou等利用2006年城市形态数据研究500个欧洲城市群城市热岛(UHI)强度,强调城市越大、越紧凑,UHI强度往往越强[8],城市扩展逐渐由水平向垂直空间延伸[9],城市建筑的高度、密度和朝向是影响城市热岛的重要因素。陈利顶等研究城市景观格局的热岛效应影响,提出要重视城市景观格局演变与热岛效应的定量关系研究[10]
城市风环境是城市微气候的重要形成因素之一,目前,对城市风环境的研究可以划分为高空风场、城市冠层风场和城市近地面风场。从城市建筑的空间形态入手,Wong等通过计算香港九龙半岛建筑迎风面指数,设计通风廊道,改善城市气候[11];Shi等利用回归模型对城市热岛效应进行精细评估,表示高密度城市环境中,复杂城市的建筑形态通过扰乱风,显著改变城市地区的微气候条件[12];张佳华等通过气象数据分析北京热岛变化,说明风速的减小导致城市热岛强度的增大[13];Hsieh等对潜在的通风路径进行规划,引入海风缓和城市热岛效应,能够使城市更好地渗透凉爽的新鲜空气,改善城市空气污染和降低热岛效应[14]。对于城市通风模拟计算主要集中在国外及香港地区,国内大陆地区研究正处于起步阶段,Yang等阐述了城市通风的重要性和必要性[15,16],Edward等尝试探索了如何通过改变城市形态来改善高密度城市的风环境[17],杨俊宴等探讨了城市风环境研究的技术演进及其评价体系整合[18]
随着热红外遥感技术的发展,利用遥感研究城市热岛效应被广泛应用,遥感能够观测整个城市的地表温度(land surface temperature, LST),王天星等用温度比辐射率分离算法(TES)算法实现了ASTER地表温度的反演从而分析热岛效应的时空演变[19],Weng探讨利用热红外遥感数据研究城市表面与LST之间的关系[20],Katoa等利用Landsat 8数据热红外波段,基于像素确定热点温度[21]。近年来MODIS数据被广泛应用,姚永慧等采用MODIS数据对青藏高原气温与增温效应进行估算[22],徐伟燕等应用MODIS数据估算近地表温度证明MODIS地表参数产品估算近地表气温的可行性[23]。为缓解城市热岛现象,Gulbe等利用Landsat 8数据分析城市植被覆盖和建筑覆盖对城市温度的贡献,发现Landsat温度模拟与植被覆盖呈负相关,与建筑覆盖度呈现正相关[24],因此城市建筑物的能源评估,对于未来气候变得尤为重要。袁振等研究发现城市用地是城市热岛的主要贡献因素,绿地能够缓解城市热岛并且取决于绿地斑块的面积[25,26],绿地的减少加剧了城市热环境效应[27]
城市热岛影响日益严重,从时间变化上看,Zhou等研究表明城市热岛夜间突出[28],Tran指出城市热岛现象白天高于夜间[29],因此昼夜热岛影响存在差异性。另外,大多数城市通风研究主要限于城市建筑群与风环境的影响与制约,缺少定量分析城市通风对地表温度影响。鉴于此,本文以建筑矢量数据和遥感等多源数据,结合GIS空间方法、地表温度反演、建筑迎风面指数,分析建筑迎风面指数在空间和时间上的差异性,研究长春市主城区建筑迎风面指数对昼夜地表温度影响。

2 研究数据与方法

2.1 研究区概况

长春位于中国东北地区中部(43°05′N~45°15′N、124°18′E~127°05′E),居北半球中纬度北温带,属温带大陆性湿润气候类型。气候总体特征是春季干旱多风,夏季温暖短促,秋季晴朗温差大,冬季严寒漫长。长春市下辖7区3县,其中双阳区和九台区均为近年来撤县设区,与主城存在较为明显的空间距离,因此出于研究需要,选取长春市辖区的宽城区、绿园区、二道区、朝阳区和南关区作为研究区(图1)。
图1 研究区概况

Fig. 1 Location of the study area

2.2 数据获取与预处理

选取长春市建筑数据,Terra卫星搭载MODIS地表温度产品数据(表1)。依据现行国家《民用建筑设计通则》(GB50352-2005)[30],对建筑物进行高度统计。NASA提供基于MODIS数据的地表温度产品,其中包括单日影像数据、8天和每月合成影像数据。单日影像会有一些云量覆盖,因此选取云量覆盖小于5%的遥感影像。Terra卫星每日过境时间为上午10:30左右和下午22:30左右,数据包括Day_view_time(白天数据观测时间)和Night_view_time(夜晚数据观测时间)子数据集。已有研究表明,MODIS数据反演地表温度精度小于1 K,因此MODIS反演地表温度产品被广泛应用[31]
表1 数据来源和说明

Tab. 1 Descriptions of data sources

相关参数 数据类型
Terra-MODIS(MODLT1D) 建筑矢量数据(建筑楼层数) 气象数据(风速、风频率)
空间分辨率 1 km - -
时间 2016-5-17 2016 2016
数据来源 https://ladsweb.modaps.eosdis.nasa.gov/ 百度地图 https://rp5.ru/
已有研究发现春季植被覆盖与地表温度呈现负相关[3]。长春市位于两景影像边界处(轨道号为h26v04和h27v04),首先对数据进行几何校正,重采样等预处理,然后根据MODIS数据头文件和产品说明得知该数据产品的数据比例因子为0.02,依据MODIS数据地表温度产品头文件和产品说明中相关转换公式(公式(1))将其转化为摄氏温度:
T s = DN × 0.02 - 273.15
式中:Ts为反演后地表温度(℃);DN为MODIS产品的灰度值。

2.3 研究方法

2.3.1 迎风面指数 大气层中气流从上至下延伸至城市建筑表面,建筑必然会对风场产生影响。利用规则格网对研究区域进行划分,在确定空间尺度问题时,最重要的是考虑实际应用,根据建筑的占地面积以及计算过程中精度的要求,选取30 m×30 m格网大小[32]。因单一建筑周边的风环境受到自身及其他建筑的朝向、长度等多因素影响,它与风向有着直接的关系,风向不同则建筑的迎风面积不同,从而该风向下城市空间形态对城市空气流通的影响也不同[33,34,35]。在这样的理论前提下,采用C#基于矢量数据编写了计算迎风面指数的程序,用于测度和模拟迎风面指数(FAI)。迎风面指数可表示为:
λ f Z = θ = 1 16 λ f θ × P θ
式中: λ f ( Z ) 代表特定风向的迎风面指数; λ f ( θ ) 代表单一风向建筑迎风面指数即垂直于某一风向的建筑迎风面面积与建筑所在地块面积比;Pθ代表特定风向的频率。16个风向迎风面指数进行加权,得到该区迎风面指数。迎风面指数越大,表示该地区阻碍风能力强,风速小;迎风面指数越小,表示该地域阻碍风能力弱,风速大。
2.3.2 Pearson相关性 通过创建随机点,随机获取该区域迎风面指数与地表温度,利用Pearson算法计算迎风面指数与地表温度相关性,计算公式为:
r p i , j = k = 1 n X ik - X i ¯ X jk - X j ¯ k = 1 n X ik - X i ¯ 2 k = 1 n X jk - X j ¯ 2
式中: r p i , j 为相关系数; X ik X jk 分别是迎风面指数和地表温度数值; X i ¯ X j ¯ 分别表示迎风面指数和地表温度值的平均数;n为样方数。

3 结果与分析

3.1 迎风面指数空间分异性

城市建筑空间分布直接影响迎风面指数,根据图2,城市建筑主要分布在研究区中心,呈现中心建筑高,周边建筑低的形态,除了西南方向,其他方向周边都分布低建筑群。绿园区主要为低层和多层建筑;朝阳区和南关区为多层和高层建筑;宽城区和二道区主要为低层建筑。依据图3可以看出,风向主要为西南风和南风,频率分别为0.375和0.250。建筑迎风面指数呈现从中心城区向外扩散的空间趋势,迎风面指数大小表征通风情况的强弱程度,建筑迎风面指数呈现从中心城区向外扩散的空间趋势,这一现象是由于建筑顶部以上的气流主要在树冠层,不易进入行人高度处的街道中,因此城市中心迎风面指数大,温度高。造成城市中心迎风面指数大,温度高。贯穿全市主城区的伊通河、城市中心区南湖公园等主要绿地对相邻区域的迎风面指数产生了明显的影响,形成了明显的气流通道,一定程度上改变了中心到外围的指数分布,城市周围区域形成了明显的相对低值区。
图2 2016年5月长春城区建筑空间分布

Fig. 2 The spatial distribution of buildings in Changchun urban area in May 2016

图3 2016年5月长春城区迎风面指数(FAI)空间布局

Fig. 3 The spatial pattern of frontal area index in Changchun urban area in May 2016

3.2 地表温度分布

在时间分布上,根据表2可以看出,白天地表温度范围18.15 ℃~31.73 ℃,夜间地表温度范围4.27 ℃~18.43 ℃。与夜间相比,白天高温地区范围更大,绿城区、宽城区和朝阳区北部最高温度达到31.73 ℃。夜间温度高的地方只有城市市辖区中心。在城市冠层中白天城市建筑吸收太阳光辐射热量并释放热量,由于高密度的城市建筑集中于城市中心,存储更多热量在夜间释放,因此夜间高温只集中于城市中心。
表2 长春市不同市辖区地表温度分布

Tab. 2 The distribution of surface temperature within different municipal districts in Changchun

城区 建筑占地面积(km2) 昼/夜地表温度(℃)
绿园区 19.89 26.61~31.73/13.47~18.13
宽城区 10.36 24.33~31.29/13.57~18.17
二道区 13.86 19.01~31.41/10.33~18.23
朝阳区 11.84 23.33~31.25/4.27~18.13
南关区 15.61 18.15~31.25/6.15~18.43
从空间上看,依据图4发现,白天地表温度分布高的城区分别为绿园区、宽城区南部和二道区西部,地表温度较低的地区为有大量植被覆盖的山地,夜间地表温度同白天差别很大,但在空间分布上同样呈现中心城区地表温度高,而外围区域地表温度低的空间分布特征。这是由于该城区中心分布着高密度建筑(图2),植被覆盖面积小;并且城市中心区在人类活动影响下的人为热释放较高,低风速或静风时相对高温的空气流动缓慢。
图4 2016年5月长春市城区地表温度空间分布

Fig. 4 The spatial distribution of Land surface temperature in Changchun urban area in May 2016

3.3 迎风面指数与地表温度相关性分析

图5表明建筑迎风面指数对地表温度具有明显的影响,白天迎风面与地表温度在0.01级别显著相关,相关系数为0.371,夜间则为0.335。随着迎风面指数增大,地表温度也存在增高的趋势,这是由于建筑对于通风的阻碍作用导致的地表温度增高。具体而言,通过对三维城市建筑的垂直和水平两个方向的分析可以看出,垂直方向上随着建筑高度的增加,建筑迎风面积也随之增大,地表温度明显升高。水平方向则表现为建筑的单体形态和组合方式,随着建筑物密度的提升,气流通过速度下降,也同样导致地表温度升高。长春市主城区建筑平均高度为40 m,最高建筑达到475 m,建筑的高密度形态以及新建的超高建筑都大大强化了风阻效应。另外城市中心的高密度高度建筑存储热量在夜间释放,使得夜间高温集中在城市中心。白天太阳辐射强,从而白天气温很高;晚上地面长波辐射强,大气逆辐射弱,气温迅速下降,气温很低。
图5 长春市城区迎风面指数与地表温度关系

Fig. 5 The relationship between frontal area index and land surface temperature in Changchun urban area

但是值得注意的是,这种趋势并不绝对,一般而言建筑迎风面指数越大,表明建筑迎风面积大,然而除了建筑形态之外,影响地表温度的因素还包括其他地表覆被要素,因此会出现部分地区迎风面指数大但地表温度低的现象。利用缓冲区分析筛选迎风面指数小,地表温度高的地区,如图6所示,可以看出,白天地表温度大于29 ℃,并且迎风面指数小于0.3的区域由西南至东北方向延伸。西南方向周边有少量低层建筑,东北方向建筑类型则多为多层和高层建筑,阻碍通风,因此具有迎风面指数小,但地表温度增高的特性。夜间地表温度大于17 ℃,并且迎风面指数小于0.3的区域为研究区的西北方向。西北部建筑多为低层建筑,主体是居民区,虽然迎风面指数小,但是由于人为热源释放的热量高,导致地表温度升高。
图6 2016年5月长春市城区迎风面指数与地表温度时空分异

Fig. 6 Spatiotemporal differentiation between frontal area index and land surface temperature in Changchun urban area in May 2016

4 结论与讨论

城市热岛问题日益加重,定量计算城市建筑对地表温度的贡献,能够有效反映影响城市热岛形成的主要因素。本文以长春市辖区城市三维建筑和MODIS数据的地表温度数据为基础,计算城市建筑迎风面指数,研究其空间分布对地表温度的作用。结论如下:
(1)建筑迎风面指数呈现从中心城区向外扩散的空间趋势,中心城区大量高密度以及高建筑对风的阻碍程度大。
(2)昼夜地表温度空间上呈现出高建筑区温度高的特征。昼夜差异显著,白天气温为18.15~31.73℃,夜间气温为4.27~18.43 ℃,与夜间相比,白天高温地区范围更大。
(3)迎风面指数空间分异性与地表温度呈现相关,白天相关系数达到0.371,夜间为0.335。在三维空间中垂直方向上建筑物高,水平方向上建筑物密度大,造成气流缓慢通过,地表温度升高。但是受建筑本身形态和其他地表覆被影响,有些建筑物覆盖区域不存在相应趋势。
本文主要结合风环境开展城市整体建筑形态对城市地表温度的影响研究,在计算城市建筑迎风面指数时,受当前数据和研究手段的限制,采用了30 m×30 m格网大小,在后续的进一步研究中,可以尝试缩小格网尺度,提高研究精度,从而获取更好的研究结果。对建筑的空间分布状态进行了分析,但未能将城市建成区的树木精确量化并纳入模型中,这对研究结论产生了一定的不利影响。同时,除了建筑高度外,不同的城市建筑类型也会对地表温度产生直接的影响,由于数据限制,本研究中未能将长春市城市建筑类型进行分类探讨,从而缺失了对不同类型城市建筑对地表温度影响程度的探索。在今后的研究中,可以考虑将城市建成区划分不同局部类型进一步探讨并加强不同区域多个城市的对比研究,将对提高研究结果的普适性具有明显的作用。在数据获取中,传统的气象台站数据具有一定的限制,而结合MODIS数据的研究具有很好的可靠性和拓展价值,MODIS数据获取的城市地表温度能够较为明确的实现设定研究目标。但需要注意的是,MODIS数据虽然能够获取每日地表温度,但其空间分辨率相对较低,对于中小尺度的高精度研究可能存在精度不足,后续的研究中将尝试强化多源数据融合,开展多时空尺度的对比研究,以提高研究精度和结果的普适性。

The authors have declared that no competing interests exist.

作者已声明无竞争性利益关系。

[1]
Chu Zheng, Guo Jianping, Zhao Junfang . Impacts of projected climate change on agricultural climate resources in Northeast China. Acta Geographica Sinica, 2017,72(7):1248-1260.

[ 初征, 郭建平, 赵俊芳 . 东北地区未来气候变化对农业气候资源的影响. 地理学报, 2017,72(7):1248-1260.]

[2]
Qiao Zhi, Tian Guangjin . Dynamic monitoring of the footprint and capacity for urban heat island in Beijing between 2001 and 2012 based on MODIS. Journal of Remote Sensing, 2015,19(3):476-484.

[ 乔治, 田光进 . 基于MODIS的2001年-2012年北京热岛足迹及容量动态监测. 遥感学报, 2015,19(3):476-484.]

[3]
Zhao Jie, Du Ziqiang, Wu Zhitao , et al. Seasonal variations of day- and nighttime warming and their effects on vegetation dynamics in China's temperate zone. Acta Geographica Sinica, 2018,73(3):395-404.

[ 赵杰, 杜自强, 武志涛 , 等. 中国温带昼夜增温的季节性变化及其对植被动态的影响. 地理学报, 2018,73(3):395-404.]

[4]
Zhao L, Lee X, Smith R B , et al. Strong contributions of local background climate to urban heat islands. Nature, 2014,511(7508):216-219.

DOI

[5]
Bai X, Dawson R J, Ürge-Vorsatz D , et al. Six research priorities for cities and climate change. Nature, 2018,555(7694):23-25.

DOI

[6]
Irina M, Daniel J S . Solomon Susan. Pace of shifts in climate regions increases with global temperature. Nature Climate Change, 2013,3(8):739-743.

DOI

[7]
Santamouris M . Heat island research in Europe: The state of the art. Advances in Building Energy Research, 2007,1(1):123-150.

DOI

[8]
Zhou B, Rybski D, Kropp Jürgen P . The role of city size and urban form in the surface urban heat island. Scientific Reports, 2017,7(1):1-9.

DOI

[9]
Yang Jun, Guo Andong, Xi Jianchao , et al. Spatial-temporal differentiation of three-dimensional urban landscape pattern: A case study of Zhongshan District in Dalian. Acta Geographica Sinica, 2017,72(4):646-656.

[ 杨俊, 国安东, 席建超 , 等. 城市三维景观格局时空分异特征研究: 以大连市中山区为例. 地理学报, 2017,72(4):646-656.]

[10]
Chen Liding, Sun Ranhao, Liu Hailian . Eco-environmental effects of urban landscape pattern changes: Progresses, problems, and perspectives. Acta Ecologica Sinica, 2013,33(4):1043-1050.

[ 陈利顶, 孙然好, 刘海莲 . 城市景观格局演变的生态环境效应研究进展. 生态学报, 2013,33(4):1043-1050.]

[11]
Wong M S, Nichol J E, To P H , et al. A simple method for designation of urban ventilation corridors and its application to urban heat island analysis. Building and Environment, 2010,45(8):1880-1889.

DOI

[12]
Shi Y, Katzschner L, Ng E . Modelling the fine-scale spatiotemporal pattern of urban heat island effect using land use regression approach in a megacity. Science of the Total Environment, 2017,618:891-904.

[13]
Zhang Jiahua, Meng Qianwen, Li Xin , et al. Urban heat island variations in Beijing region in multi spatial and temporal scales. Scientia Geographica Sinica, 2011,31(11):1349-1354.

[ 张佳华, 孟倩文, 李欣 , 等. 北京城区城市热岛的多时空尺度变化. 地理科学, 2011,31(11):1349-1354.]

[14]
Hsieh C M, Huang H C . Mitigating urban heat islands: A method to identify potential wind corridor for cooling and ventilation. Computers, Environment and Urban Systems, 2016,57:130-143.

DOI

[15]
Yang J, Jin S, Xiao X , et al. Local climate zone ventilation and urban land surface temperatures: Towards a performance-based and wind-sensitive planning proposal in megacities. Sustainable Cities and Society, 2019,47:101487. DOI: 10.1016/j.scs.2019.101487.

DOI

[16]
Ren Chao, Yuan Chao, He Zhengjun , et al. A study of air path and its application in urban planning. Urban Planning Forum, 2014(3):52-60.

[ 任超, 袁超, 何正军 , 等. 城市通风廊道研究及其规划应用. 城市规划学刊, 2014(3):52-60.]

[17]
Ng E, Yuan C, Chen L , et al. Improving the wind environment in high-density cities by understanding urban morphology and surface roughness: A study in Hong Kong. Landscape and Urban Planning, 2011,101(1):59-74.

DOI

[18]
Yang Junyan, Zhang Tao, Tan Ying . Research on urban wind environment: Technology evolution and integration of evaluation systems. South Architecture, 2014,1(3):31-38.

[ 杨俊宴, 张涛, 谭瑛 . 城市风环境研究的技术演进及其评价体系整合. 南方建筑, 2014,1(3):31-38.]

[19]
Wang Tianxing, Chen Songlin, Yan Guangjian . Estimation of land surface parameters and spatio-temporal characteristics of urban heat island. Scientia Geographica Sinica, 2009,29(5):697-702.

[ 王天星, 陈松林, 阎广建 . 地表参数反演及城市热岛时空演变分析. 地理科学, 2009,29(5):697-702.]

[20]
Weng Q . Thermal infrared remote sensing for urban climate and environmental studies: Methods, applications, and trends. Isprs Journal of Photogrammetry and Remote Sensing, 2009,64(4):335-344.

DOI

[21]
Katoa S, Kouyamaa T, Nakamuraa R , et al. Simultaneous retrieval of temperature and area according to sub-pixel hotspots from nighttime Landsat 8 OLI data. Remote Sensing of Environment, 2018,204:276-286.

DOI

[22]
Yao Yonghui, Zhang Baiping . MODIS-based estimation of air temperature and heating-up effect of the Tibetan Plateau. Acta Geographica Sinica, 2013,68(1):95-107.

[ 姚永慧, 张百平 . 基于MODIS数据的青藏高原气温与增温效应估算. 地理学报, 2013,68(1):95-107.]

[23]
Xu Weiyan, Sun Rui, Jin Zhifeng , et al. Estimation of near surface air temperature based on MODIS data. Meteorological and Environmental Sciences, 2015,38(1):1-6.

[ 徐伟燕, 孙睿, 金志凤 , 等. 基于MODIS数据的近地表气温估算. 气象与环境科学, 2015,38(1):1-6.]

[24]
Gulbe L, Caune V, Korats G . Urban area thermal monitoring: Liepaja case study using satellite and aerial thermal data. International Journal of Applied Earth Observation and Geoinformation, 2017,63:45-54.

DOI

[25]
Yuan Zhen, Wu Xiangli, Zang Shuying , et al. Cooling effect of green patche based on TM image in Harbin downtown city. Scientia Geographica Sinica, 2017,37(10):1600-1608.

[ 袁振, 吴相利, 臧淑英 , 等. 基于TM影像的哈尔滨市主城区绿地降温作用研究. 地理科学, 2017,37(10):1600-1608.]

[26]
Yang J, Wang Y, Xiao X , et al. Spatial differentiation of urban wind and thermal environment in different grid sizes. Urban Climate, 2019,28:100458. DOI: 10.1016/j.uclim.2019.100458.

DOI

[27]
Yang J, Sun J, Ge Q S , et al. Assessing the impacts of urbanization-associated green space on urban land surface temperature: A case study of Dalian, China. Urban Forestry & Urban Greening, 2017,22:1-10.

[28]
Zhou D C, Zhao S Q, Liu S G , et al. Surface urban heat island in China's 32 major cities: Spatial patterns and drivers. Remote Sensing of Environment, 2014,152:51-61.

DOI

[29]
Tran H, Uchihama D, Ochi S , et al. Assessment with satellite data of the urban heat island effects in Asian mega cities. International Journal of Applied Earth Observation and Geoinformation, 2006,8(1):34-48.

DOI

[30]
Code for Design of Civil Buildings (GB50352-2005) Beijing: China Architecture and Building Press, 2005.

[ 民用建筑设计通则(GB50352-2005). 北京: 中国建筑工业出版社, 2005.]

[31]
Wan Z, Zhang Y, Zhang Q , et al. Quality assessment and validation of the MODIS global land surface temperature. International Journal of Remote Sensing, 2004,25(1):261-274.

DOI

[32]
Peng F, Wong M S, Nichol J E , et al. Historical GIS data and changes in urban morphological parameters for the analysis of urban heat islands in Hong Kong. ISPRS - International Archives of the Photogrammetry, Remote Sensing and Spatial Information Sciences, 2016, XLI- B2:55-62.

[33]
Macdonald R W, Griffiths R F, Hall D J . An improved method for the estimation of surface roughness of obstacle arrays. Atmospheric Environment, 1998,32(11):1857-1864.

DOI

[34]
Hsieh C M, Huang H C . Mitigating urban heat islands: A method to identify potential wind corridor for cooling and ventilation. Computers, Environment and Urban Systems, 2016,57:130-143.

DOI

[35]
Bottema M, Mestayer P G . Urban roughness mapping-validation techniques and some first results. Journal of Wind Engineering & Industrial Aerodynamics, 1998,76(2):163-173.

Outlines

/